
Design and Implementation of an IoT-Based Smart Classroom Incubator


1
Department of Electrical and Electronics Engineering, Faculty of Technology, Gazi University, Ankara 06560, Turkey
2
Institute of Natural and Applied Sciences, Gazi University, Ankara 06500, Turkey
*
Authors to whom correspondence should be addressed.
Appl. Sci. 2022, 12(4), 2233; https://doi.org/10.3390/app12042233
Submission received: 31 December 2021
/
Revised: 15 February 2022
/
Accepted: 16 February 2022
/
Published: 21 February 2022
(This article belongs to the Special Issue Data Analytics and Machine Learning in Education)
Abstract
:Ambient conditions influence human health, emotions, and mental power. Therefore, numerous studies have been conducted in different disciplines on the measurement and control of ambient conditions in classrooms. Moreover, a number of studies identify some physical and mental performances of students simultaneously or for informative purposes by utilizing various hardware and software. However, these studies did not consider automatic control processes and individuality in fulfilling classroom ambient conditions, which influence students’ behavior. This study aims to reduce the adverse impacts of environmental factors on learning and control more necessary physical parameters with higher accuracy using the latest technology and methods. Thus, a new smart classroom incubator (SCI) algorithm, including hardware, software, and experimental studies, in which individual differences could be considered even in the same classroom environment, and its implementation were presented. The system enables access and monitoring of data wherever there is Internet connection. Moreover, it was designed based on IoT because it allows for data transfer over web services or data-dependent operations. All the necessary equipment was placed in the classroom without affecting the learning environment and distracting the class. Cronbach’s α coefficient, which indicates the reliability of the implemented model, was 0.891.
1. Introduction
The effects of the physical parameters of ambient conditions on people may vary according to age, health status, work, etc. This is similar to Hippocrates’s statement, “There is no disease, but the patient,” which is considered the main principle of the right medical practice. Particularly in educational institutions, the ambient conditions in classrooms affect the learning efficiency. However, the degree of this effect cannot be assessed accurately and adequately due to variations and fluctuations in ambient conditions and the inability to keep all the variables under control. Previous studies did not approach these factors holistically. Studies were conducted on only the control or effects of some variables or conditions.
Furthermore, hardware or methods, which either disrupt the natural conditions of the measurement environment or are expensive, are used in practice. Therefore, these are not sustainable and useful. Smart teaching aids should also have a healthy physical environment [1]. Moreover, it is difficult to create a system that can meet the needs of all students without considering the individual differences [1]. However, in many studies on students’ affective state levels, physical conditions were not controlled. Saini and Goel reported that a complete smart class would be costly due to its infrastructure requirements [1]. Therefore, a cost-effective solution will increase sustainability and applicability.
At the same time, it is essential that the elements controlling these variables in the environment do not affect the general physical environment negatively and do not distract attention. Ricciardi and Buratti defined comfort conditions in their measurement and survey studies based on thermal and acoustic properties and lighting in an environment [2]. Zuhaib et al. stated that the problem of heating could be decreased with improvements such as the arrangement of heating programs and adequate mechanical ventilation [3]. Likewise, Bajc et al. conducted an experimental study on the effect of thermal comfort and revealed the adverse effects of high temperature and carbon dioxide [4]. Haverinen-Shaughnessy and Shaughnessy observed the effect of ventilation and air conditioning on grades [5]. In their experimental study, Almaqra et al. thought that air temperature might affect students’ cognitive performance [6]. Tagliabue et al. concluded that indoor air quality and thermal conditions could improve the learning performance of users and energy savings [7]. Zaki et al. reached a conclusion that thermal comfort conditions varied between individuals [8]. Ceranic et al. stressed the importance of smartly managing thermal, ventilation, and humidity control strategies adapting to climate, season, and weather [9]. Song et al. used skin temperature for air conditioning control [10].
Cheryan et al. expressed that the learning environment deeply affected learning and success level [11]. Najafi et al. concluded that the sound level should be between 35 and 45 dB in a classroom, and a combination of artificial and natural light could be beneficial for classroom lighting [12]. Sahin et al. demonstrated that the light wavelength influenced a person’s wakefulness and performance [13,14]. Smolders and de Kort also observed the effects of bright light [15]. Yang and Jeon observed the effects of led light on cognitive performance [16]. de Rubeis et al. conducted a study on lighting control, cost, and energy savings [17]. Keis et al. reported that the cognitive processing speed and concentration of students increased under the lighting conditions they recommended, compared to standard lighting conditions [18]. Sun et al. presented an effective lighting control model [19].
Some studies investigate the effects of particulate matter on health and measure its amount [20,21,22,23]. Yang and Moon tested the ambient air quality conditions [24]. Twardella et al. revealed that classroom air quality influenced student performance [25]. Stazi et al. implemented and observed an automatic window opening system to improve air quality [26]. Dutta et al. enabled ventilation in the environment with IoT-based fan control [27].
Klatte and Sutjarittham et al. equipped classrooms with IoT sensors to measure real-time utilization and used artificial intelligence techniques to predict attendance [28,29]. In their experimental study, Ahmawati et al. proved that the physical environment of the classroom affected the learning motivation of students considerably [30].
Examination and model proposition studies measure, observe, or locally control physical conditions using different methods [1,31,32,33]. Furthermore, experimental studies conducted in classroom environments ignored the effect of physical classroom conditions [34,35,36,37,38,39,40,41,42,43,44,45,46,47,48]. In learning environments, the main purpose is learning efficiency. However, some studies paid attention only to energy efficiency while controlling the ambient variables [49,50,51]. Some studies examined the usability and future classroom technologies and presented architectural, smart model, and data management proposals regarding the arrangement of the inside and outside of the classroom in these respects [52,53,54,55,56,57,58,59]. In some other studies, Multimedia Learning Technologies based on loT, physiological measuring instruments, cost effective digital systems’ hardware were used to increase the quality and efficiency of education [60,61,62]. As can be seen, when studies on this subject in the literature are reviewed in a bit more detail, it is realized that these studies were generally conducted in the fields of social sciences or educational sciences, and measurements and observations were made, and findings were obtained in this regard. Therefore, the technical aspect of the subject is missing. Moreover, there are no studies in which all the relevant variables were controlled according to general or individual requirements using an engineering approach toward learning environment and efficiency. Consequently, it is clear that the effects of ambient conditions on learning are important. Nevertheless, it would be more useful to approach variables as a whole and include individuality as much as possible.
Accordingly, some of the most important factors influencing the learning environment are sound intensity and distribution, temperature, relative humidity rate, light intensity, air quality, and ambient pollution. Therefore, this study measured the above-mentioned parameters. On the other hand, the most important control parameters are individualized temperature control, automatically controlled position-based lighting, improved air quality, and ambient cleanliness. The sound distribution in the classroom was also measured, mapped, and made more homogeneous.
This study used engineering approach and engineering methods, and the above-mentioned parameters were monitored simultaneously and controlled by automation. Unlike previous studies, a higher number of necessary parameters could be monitored and controlled individually. An adaptive software algorithm that used dynamic values instead of fixed values, which are considered standard, was used to control the parameters. In this SCI, the focus was set on maintaining the learning efficiency and health of students, and student readiness in education could be monitored instantly with IoT. The study’s validity was confirmed by analyzing the data collected from SCI and ordinary learning environments, survey studies, and experimental study results. Hence, the benefits of this study in real learning environments were presented.
2. Materials and Methods
In this study, the most significant variables that influenced smart classroom management were considered as light intensity, temperature, relative humidity rate, air cleanliness, sound intensity and distribution, the amount of dust and particulate matter. The analog and digital data regarding these parameters are monitored as mobile using software. Moreover, the control of parameters was individualized. For example, students can enter the desired temperature value simultaneously and instantly with a button on their desks. In the system, the temperature is not kept constant at ideal or standard values. Instead, the average values of individual differences are calculated and updated dynamically and continuously. Ambient variables and these calculated values are evaluated and controlled by an adaptive algorithm. For example, in addition to sensors, individual heating and cooling units were installed on the desk and table of each student.
Because relative humidity rate and temperature are directly correlated with each other, they are controlled together using an additional fan. The level of light intensity needed can also change individually. Therefore, light intensity was kept at a certain value and controlled by taking into account its reflection in the classroom. Air quality is important in terms of the momentary mental efficiency and health of a person. Especially during the pandemic, the cleanliness and sterilization of the environment have gained more importance. These parameters, which affect the learning environment, were controlled. The sound intensity and distribution of the teacher in the classroom were measured, and a sound distribution map was obtained. Sound distribution was made more homogeneous by providing the necessary feedback.
This study was conducted in Private Ankara Chamber of Industry Vocational and Technical Anatolian High School classrooms. First, the existing physical conditions of the classrooms in this educational institution were identified: 19 of the 24 classrooms in the school are located on the same facade. The average classroom areas are 51 m2, and the height of the ceilings is 3.5 m. Class sizes are limited to 24 people. All classrooms have a blowing-type heating and cooling system, roller blinds, and smartboards.
Before and after installing the automation system, the data on these variables in the environment were collected with the sensor systems, and their time-dependent web-based records were kept. To determine the increase in efficiency, the experimental group in the classroom with system installation and the control group in the classroom without system installation were lectured. For identical education, both groups were lectured by the same teachers from five different branches. Then, a test covering five different courses was applied to the subjects simultaneously. Afterward, the success of both groups was compared. Identical levels of readiness for education were ensured in both groups. To this end, the percentiles of the secondary education transition exam were taken into consideration. Confirmation was ensured by statistical methods by providing different groups with different education and applying the test a few times. Moreover, the students’ satisfaction was measured through surveys.
To increase the popularity of this system, hardware with the lowest cost was used. While designing the system, importance was given to ergonomics. Unlike other studies, all the system and measurement instruments were placed in a way that would not affect the learning environment. Thus, the motivation of students and the visual order were not disturbed. The manual control of the ambient conditions such as sound, light, etc., during the lesson can be distracting and affect classroom management. However, this negativity, which is often ignored, was eliminated with the automation in this study. Additionally, this automation system also increases energy efficiency by ensuring more efficient use of the school’s heating and lighting resources. On the other hand, the digital transformation targeted in Industry 4.0 was partially achieved in the field of education with this system.
2.1. SCI Physical Conditions and Hardware
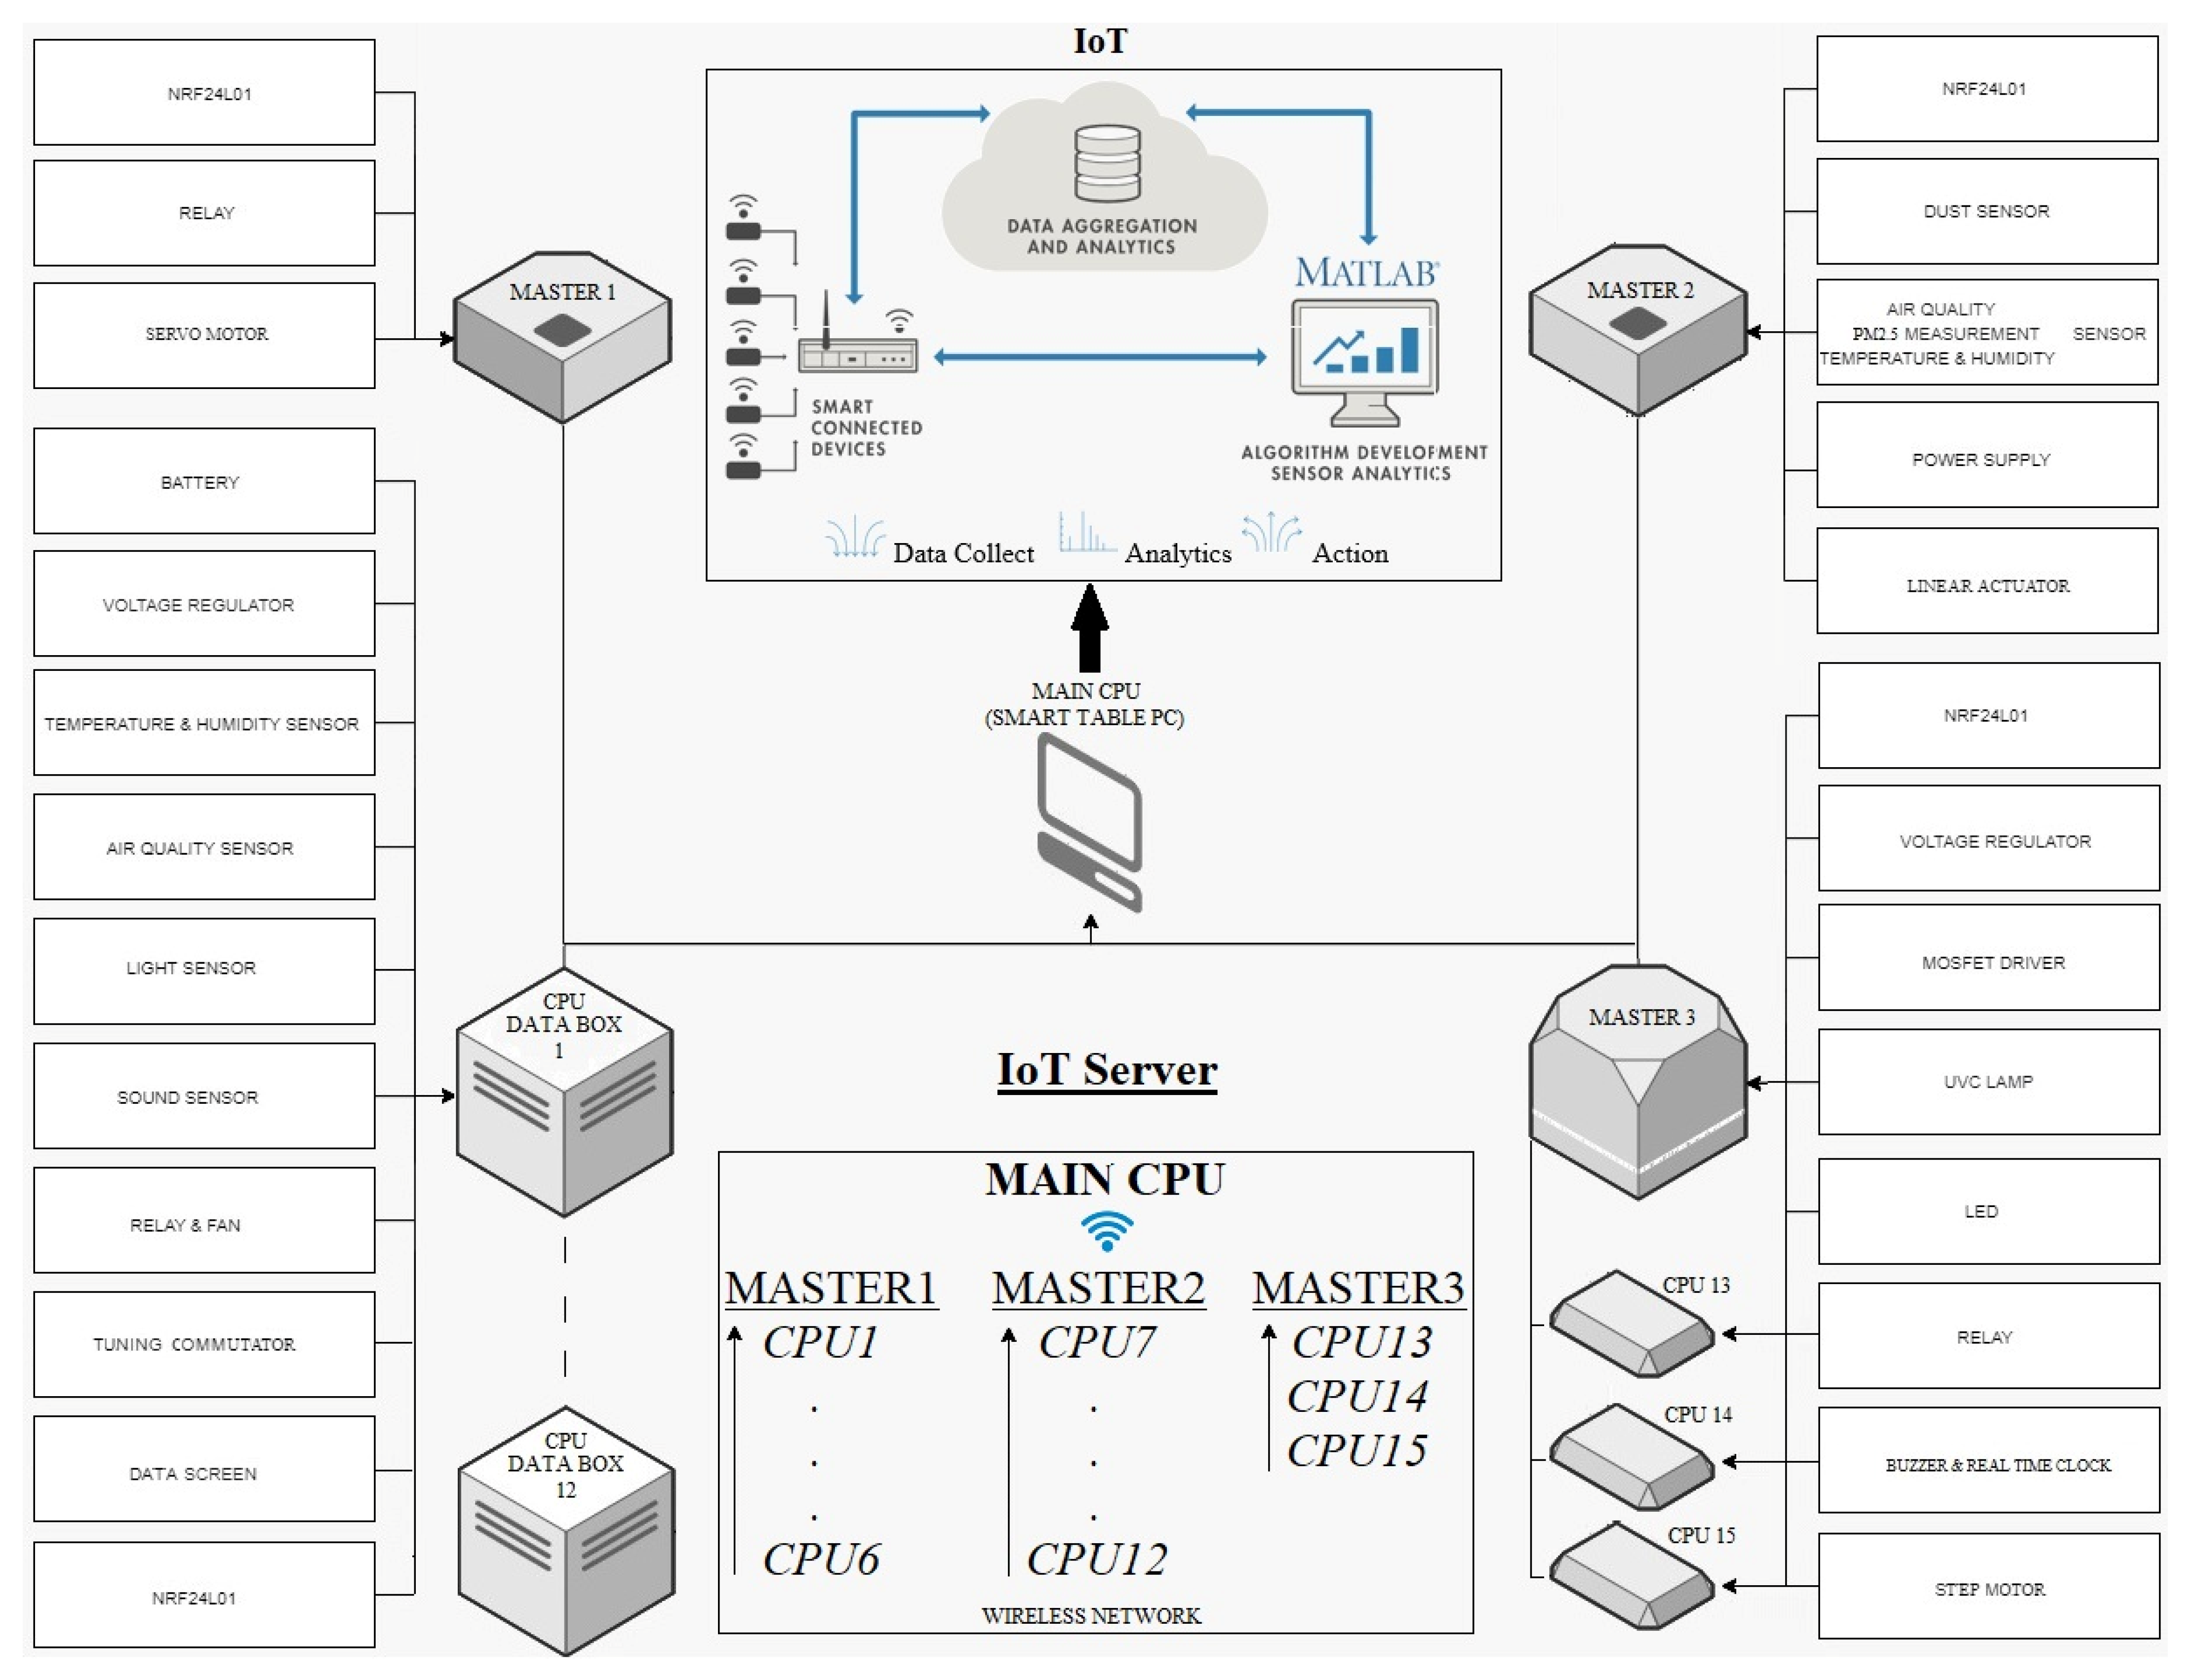
The IoT-based SCI shown in Figure 1 can be used to measure and control all the parameters of the physical conditions in the environment. It is also possible to use any parameter, whose effect is desired to be observed, as a controlled variable. For this purpose, data of eight different variables were received with 76 sensors from 13 different positions using 18 processors seen in Figure 1, and seven types of actuators were controlled in 24 different positions. At the same time, these data were transferred to the cloud system via IoT so that the data could be monitored when required and converted into a database to be used in analyses. For sustainability and applicability, in addition to the previously mentioned ergonomics, processors, sensors, and hardware with sufficient capacity and the lowest cost were used to collect data.
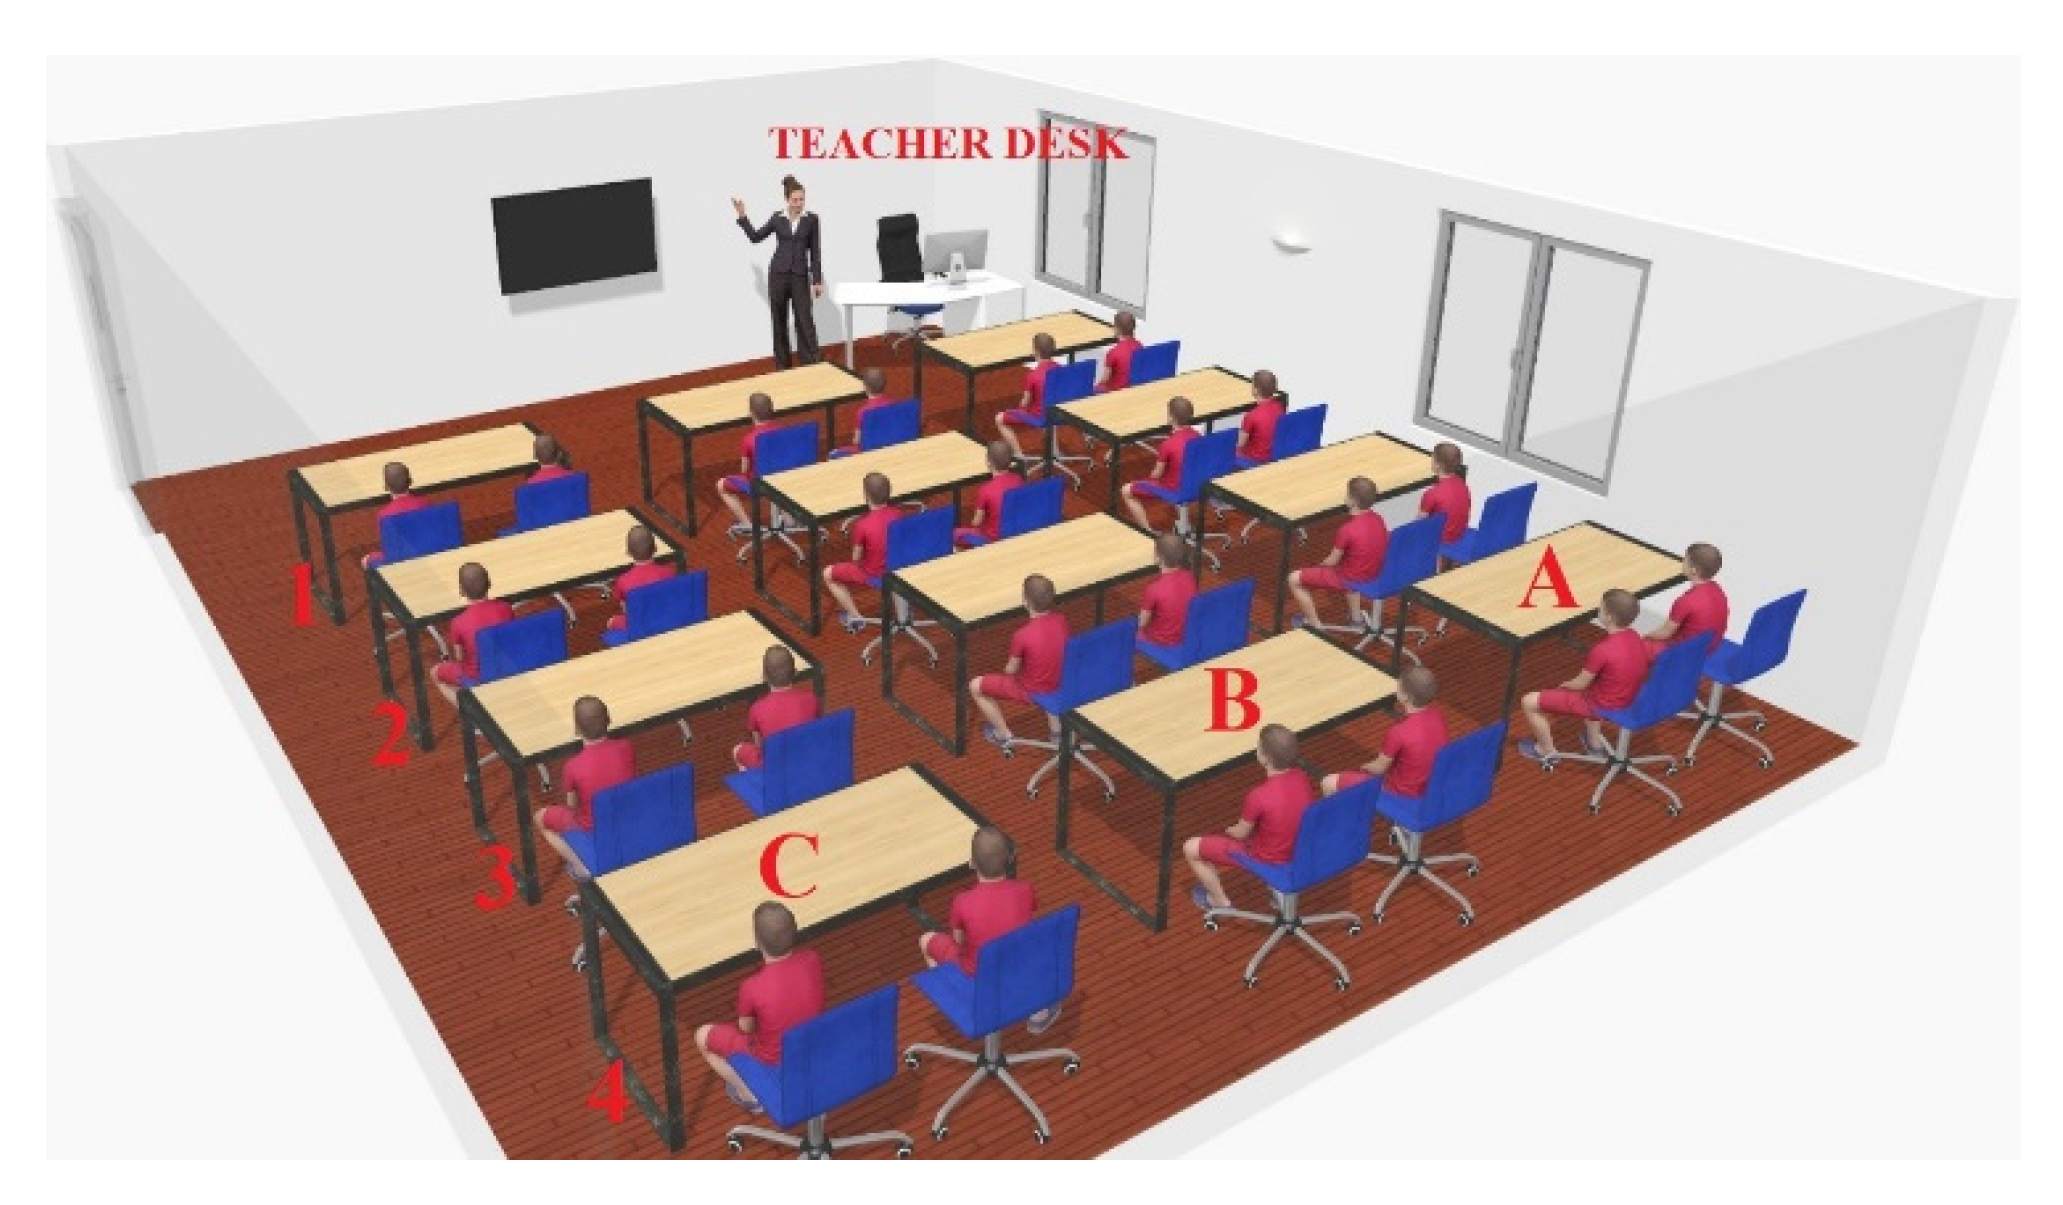
Figure 2 shows the seating plan of students with numbers 1–12. From these 12 different positions, six types of data are obtained: temperature, humidity, light, sound intensity, air quality, and individual temperature preference. Five types of data, namely outdoor air quality, PM2.5 value, dust amount, temperature, and humidity, are received from the section where natural ventilation is controlled, which is expressed with number 13 and letter A in Figure 2. Each of these data is processed with different processors, and the natural ventilation system, dynamic air conditioning system, dynamic lighting system, personal air conditioning system, UVC sterilization system, and roller blind positioning system are controlled automatically.
Moreover, the data transferred to the cloud via IoT were analyzed, and it was possible to provide feedback to teachers, school administration, or parents over web services. The sound level of the teacher, which reached the students’ positions during the lesson, was recorded with sound sensors. A sound distribution map was obtained using these data, and an experimental study in which its effects were observed as uncontrolled variables was conducted. When necessary, these data can be sent through applications such as web services. Thus, the relevant units can be notified or warned on matters such as the cleanliness of the classroom. For such situations, the system is open to development and can be easily fixed. Figure 3 shows the classroom in which the system was applied.
The dimensions of the classroom where the implementation was carried out and the geographical position of the classroom are presented in Figure 4.
2.1.1. Data Box and Personal Air Conditioning System
There is a data box designed to make measurements at all positions numbered from 1 to 12 in Figure 2. On this box, there is a display where students can see the collected data and a tuning commutator to enter the personal temperature value. The collected data are transmitted wirelessly to the processor called MASTER1 (Figure 1). The average classroom temperature is calculated using the values received from a total of 12 positions. However, if a student requests a value different from the average value, the personal air conditioning fan on the student’s desk is activated. This hardware has a central processor card. With this card, the data of other sensors can also be used in the classroom automation system and transferred to the IoT system. In each box, there is a sound sensor, light sensor, temperature and humidity sensor, air quality sensor, wireless communication card, double relay card, battery slot, regulator card, and processor. Figure 5 shows the basic algorithm of this system’s software.
The structure of the SCI system is very complex since it contains a lot of data and a sensor network. However, it has a simple interface so that students cannot be distracted and prevented from focusing on the lesson and do not waste time with it. Therefore, each student can only see the data on their desk using this interface and enter the temperature demand for personal air conditioning. The images of the interface are presented in Figure 6.
2.1.2. Outdoor Air Quality Measurement and Natural Ventilation System
The system enables natural ventilation when necessary. For this purpose, there is a temperature, humidity, PM2.5 particulate matter ratio and air quality sensor, dust sensor, wireless communication card, motor driver card, regulator, battery, and processor in position 13 (in Figure 2). There is also a linear actuator to open or close the window in position A. If the air quality is lower than the determined level according to the data received from the data boxes in the classroom, the temperature, humidity, PM2.5 particulate matter ratio in front of the window, and the data received from the sensors that measure the air quality are compared. Thus, the linear actuator is activated, and the window opens. The window is kept open for the required time to enable natural ventilation (Figure 7). If the measured outdoor air temperature differs from the temperature measured indoors, the dynamic air conditioning system in the classroom is activated. Figure 8 shows the basic algorithm of this system’s software.
2.1.3. Dynamic Lighting and UVC Sterilization System
Dynamic lighting and UVC sterilization system have been used in the SCI. For lighting, LED lighting panel was placed in each of the B, C, D, E, F, G positions (Figure 2). The panels placed with both sides were driven in parallel. In Figure 2, there are roller blinds in positions I, J, and K. The dynamic lighting system also controls them. Accordingly, it prevents students from exposure to direct sunlight and ensures making use of natural lighting as much as possible. A wireless communication card, buzzer, MOSFET driver, real-time clock module, processor, and UVC lamp were placed between these panels. Three step motors were used to control the roller blinds individually. Light sensor data and a real-time clock module are used to control the roller blinds. In line with the light sensor data received from positions 1, 4, 7, 10, 2, 5, 8, 11 and 3, 6, 9, 12 in Figure 2, LED panels in positions B, C, D, E and F, G are driven. Moreover, the environment is sterilized between 03:00 and 04:00 at night when the school is closed. To this end, a UVC lamp and buzzer system (for warning) are used. The basic algorithm of the system’s software is given in Figure 9.
2.1.4. Dynamic Air Conditioning System
Dynamic air conditioning system has been used in the SCI. For this purpose, in Figure 2, there is a fan coil control panel in position H and a fan coil air conditioning system in each of two positions represented by red rectangles. As a standard, the fan coil system has three different fan blowing levels and thermostatic control. The thermostatic part was normally controlled manually by a potentiometer. For the automatic control of this unit, a servo motor was connected to the shaft of the potentiometer. To adjust the fan speed, another servo motor was used. These servo motors were driven using the average values of the temperature data received from positions 1–12 in the classroom. A relay driver was used for on-off operation. A processor and a wireless communication card were used for these operations. The system is shown in Figure 10.
2.2. Data and Network Topology
The data collected from sensors are 10 bits. Some arithmetic formulae were used to interpret these data. The range of these values was adapted to the actual values. A smartboard computer is used as the main processor. The processors communicate with the web service in the computer using the wireless communication protocol. Data obtained from the classroom are collected with the Python Service that runs on the smartboard. The Data Collection System has three independent Python web services running on the server computer. The Python Service serially communicates with the main processor and requests instant data of the desired sensor from the processor in a certain order and sends the response to the ThingSpeak Platform with RESTAPI. This process is repeated every 20 s for each sensor. Since the dynamic speeds of the variables are low, an interval of 20 s is appropriate for receiving each data.
Communication with NRF24L01 microcontrollers, which are used for wireless data transfer, is enabled with the SPI communication protocol. The NR24L01 communication chip has the capacity to run 6 transmitters simultaneously in a star topology. Since the number of transmitters was more than 6, a network design was made with tree topology in this study. In a tree topology, each node can have a maximum of 5 sub-nodes, which can go deep at 5 levels. This means that a network of 3125 nodes in total can be created.
Based on the tree topology method in Figure 11, there is a master NRF24L01, three NRF24l01 nodes, and five slave NRF24L01s under each of these nodes in the system. Microcontrollers with each slave transmitter transfer the data they read at 20 s intervals to a higher node to which they are connected. All nodes transfer the data to the controller where the master NRF24l01 is located. All data collected on the master controller are sent to the main processor and transmitted to the IoT system. A structure consisting of variables, as seen in Figure 11, is designed, and the data read from the controllers are sent to the next receiver as a data package. In this structure, the variable named “nodenumber” was used so that the master controller could analyze which transmitter the sent data came from. This variable must be a unique number for all transmitter controllers with NRF24101.
IoT-Based Data Monitoring
The ThingSpeak web platform was used to monitor data simultaneously and act. As seen in Figure 12, an account is opened through the application. Four channels are created in this account. Eight fields are opened in each channel, and a total of 32 data can be displayed and recorded. The time and date when each data was received can be seen on the chart.
With this application, an IoT analysis platform service, which enabled the collection, visualization, and analysis of live data streams in the cloud, was obtained. The application provides instant visualization of the data sent by devices. With the ability to run the MATLAB code on the website, data can be analyzed and processed online. The application communicates with connected devices and people. It usually provides sensor data to cloud storage and cloud computing resources, where data are processed and analyzed for monitoring. Many high-level IoT systems can be defined using the IoT diagram in Figure 1.
3. Results
In this study, a case study was carried out using the designed SCI system in a real education environment. Information about the study, the statistical surveys applied, the results obtained, etc., are presented in the following sections.
3.1. Case Study
In this study, first, sensor mechanisms used to measure variables and collect data were set up. Before installing the automation system, one-day monitoring was carried out in 24 classrooms using these sensors, and the data were used for needs analysis. In line with the data received from the sensors, the value range of the parameters varies substantially during the day when there is no automatic control in classrooms. Based on this observation, a 5-point Likert-type questionnaire that consisted of 30 questions (Strongly agree (5), Agree (4), Undecided (3), Disagree (2), and Strongly disagree (1)) and measured the effects of physical conditions was applied to students to determine their needs. After the survey and measurement results were analyzed, the classroom automation was installed.
In Turkey, students are subjected to the secondary education transition exam at the end of the 8-year compulsory primary education system. This exam includes 20 mathematics, 20 science, 20 Turkish, 10 history, 10 religious culture and moral knowledge, and 10 English questions. Students are placed in the schools they have written in the preference list according to the scores they have received in this exam. Students’ classes are also determined according to these placements. Thus, identical distribution is ensured. In the study, 24 students were included in the experimental group and 24 students in the control group. First, the experimental and control groups attended 30-h lessons, which were presented by the same teachers in five different branches, namely Mathematics, Physics, Chemistry, Biology, and Turkish, every week for five weeks. They were then subjected to examination. It was observed that the average score of students in the classroom where the automation system defined as SCI was installed was 85, and the average score of students studying in the classical classroom was 74. The coding showing students’ positions in the classroom for score comparison is presented in Figure 13.
During the lessons, the sound distribution of 10 teachers was measured at 12 points where the students’ desks were located. Accordingly, sound distribution maps were obtained. If the sound level was inadequate in any part of the classroom or if there was an indoor or outdoor noise that prevented hearing, the teacher was warned visually with a sound distribution map at the end of the lesson. The data distribution chart of the teachers who were provided with feedback, obtained after 3 weeks, is presented in Figure 14. It was observed that the relevant course success of the teachers who taught in the SCI became similar to each other independently of the positions, and the teachers ensured a more homogeneous sound distribution.
3.2. Statical Survey
The model’s reliability in the study was tested with Cronbach’s α coefficient. A Cronbach’s α coefficient (Equation (1)) between 0.80 and 1.00 indicates that the scale is highly reliable and the items are consistent with each other and measure the same property [63]. The study was found to be highly reliable since Cronbach’s α coefficient was 0.891 (Table 1). The alpha values obtained when each question was removed are presented in Table 2. The number of the question removed is given in the “No” column.
Cronbach’s α Equation:
The results of the survey on the efficiency of the system applied to students are presented in Table 3. The weights of the students’ answers were calculated, and it was observed that the questions were accepted minimum by 46.51%, maximum by 81.29%, and by 61.76% on average. According to the answers to the survey, it is realized that the physical ambient conditions affect the focus, health, emotions, and thoughts of students. Moreover, it is observed that students are concerned about ventilation conditions.
Students received education in the SCI, designed according to the survey results and in line with the needs observed in the literature. The actual average test scores of students are given in Figure 15 on a position basis to represent students. It is observed that, in the SCI, the students’ scores were higher and parallel with the surveys despite individual differences.
4. Discussion
In this study, research on the measurement and control of the physical conditions of learning environments in the literature was reviewed, and the result of a comparison between previous research and this study is given in Table 4. As can be seen, previous research has rather focused on the measurement of parameters in learning environments; the number of the measured parameters was usually 1, and a maximum of 3 parameters were measured in two studies. In experimental studies, only 1 parameter was measured with a standard measuring instrument in general. In few studies, 3 parameters were only measured but not controlled. As seen in Table 4, the number of studies involving automation and control processes on this subject, in other words, applications, is quite limited in the literature. In this limited number of studies, only one parameter was usually measured and controlled. Furthermore, the number of studies in which more than one parameter was controlled simultaneously is 2. The number of studies on temperature control is only 2. The number of model studies is also limited.
Since all parameters of the learning environment affect learning efficiency, the subject was approached holistically from two aspects in this study. First, this study incorporates hardware, software, experimental studies, case studies, and survey studies. Second, a higher number of necessary parameters were measured and controlled. For this reason and other reasons mentioned in this study, the system and the environment in which it was installed were called a smart classroom incubator (SCI). Unlike previous studies, not only methods used in educational sciences and social sciences but also engineering techniques and methods were employed effectively and in depth in the system design.
The parameters measured in this study were sound intensity, temperature, relative humidity rate, light intensity, air quality, and ambient pollution. The parameters to be controlled were temperature, automatically controlled position-based lighting, improved air quality, and ambient cleanliness. As can be seen, more parameters were measured and controlled. Moreover, temperature control, one of the most variable parameters in the environment and therefore one of the most effective parameters on human comfort, convenience, and thus performance, was studied, and control processes were individualized as the temperature level preference changes more from person to person. Lighting was adjusted according to the position, air quality was improved, and a more efficient and healthier environment was provided through UV sterilization. The sound distribution of the teacher in the classroom was measured, the sound distribution was mapped, and the sound distribution was made more homogeneous with necessary feedback. Upon analyzing the data obtained, it was observed that the sound distribution between teacher-based points decreased from a 21.1-decibel average difference value to an 11.1-decibel average difference value.
The data were transferred to the cloud system via IoT. With data-based operations, it became possible to monitor students’ success and provide feedback to the relevant people. In the system’s design, importance was attached to ergonomics. Unlike other studies, all the system and measurement instruments were placed in a way that would not affect the learning environment. In the system, these parameters were controlled more accurately by making use of the latest technology and methods. For sustainability, attention was paid to keeping costs low using new technologies. However, this is not the subject of this study. Therefore, it is not discussed here.
This study revealed that students’ success and efficiency in education increased when the afore-mentioned ambient conditions were controlled. The average score of students studying in the SCI environment was 85, and the average score was 74 in the conventional classroom. The high reliability of the model implemented in the study was proven by obtaining Cronbach’s α coefficient of 0.891. The survey results indicate that physical ambient parameters affect students’ focus, health, emotions, and thoughts.
It is expected that this study will help use energy resources more efficiently and save energy. It may also be helpful in making classroom environments, which bring together the teacher and the student, healthier, especially during the pandemic. Efficiency can be increased even more by using small-sized and new-generation sensors in such systems [64,65,66,67]. It is thought that the SCI implemented in this study and the successful results obtained may pioneer studies to be conducted for increasing the efficiency of the following educational activities.
Author Contributions
Conceptualization, M.B. and K.D.; methodology, M.B. and K.D.; software, K.D. and M.B.; validation, M.B. and K.D.; formal analysis, K.D. and M.B.; investigation, M.B. and K.D.; resources, K.D. and M.B.; data curation, K.D. and M.B.; writing—original draft preparation, M.B. and K.D.; writing—review and editing, M.B. and K.D.; visualization, K.D. and M.B.; supervision, K.D. and M.B.; project administration, M.B. and K.D.; funding acquisition, K.D. All authors have read and agreed to the published version of the manuscript.
Funding
There is no funding.
Institutional Review Board Statement
Not applicable.
Informed Consent Statement
Not applicable.
Data Availability Statement
Not applicable.
Conflicts of Interest
The authors declare that they have no conflict of interest.
References
- Saini, M.K.; Goel, N. How Smart Are Smart Classrooms? A Review of Smart Classroom Technologies. ACM Comput. Surv. 2020, 52, 1–28. [Google Scholar] [CrossRef]
- Ricciardi, P.; Buratti, C. Environmental quality of university classrooms: Subjective and objective evaluation of the thermal, acoustic, and lighting comfort conditions. Build. Environ. 2018, 127, 23–36. [Google Scholar] [CrossRef]
- Zuhaib, S.; Manton, R.; Griffin, C.; Hajdukiewicz, M.; Keane, M.M.; Goggins, J. An Indoor Environmental Quality (IEQ) assessment of a partially-retrofitted university building. Build. Environ. 2018, 139, 69–85. [Google Scholar] [CrossRef]
- Bajc, T.; Banjac, M.; Todorovic, M.; Stevanovic, Z. Experimental and statistical survey on local thermal comfort impact on working productivity loss in university classrooms. Therm. Sci. 2019, 23, 379–392. [Google Scholar] [CrossRef]
- Haverinen-Shaughnessy, U.; Shaughnessy, R.J. Effects of Classroom Ventilation Rate and Temperature on Students’ Test Scores. PLoS ONE 2015, 10, e0136165. [Google Scholar] [CrossRef]
- Almaqra, A.; Almuqri, M.; Alshathri, A.; Aloraini, A.; AlRehaili, Y.; Bin-Mubarak, A.; Alabdulkarim, S.; Ragab, A. Effect of caffeine consumption and air temperature on student performance. In Proceedings of the 10th International Conference on E-Education, E-Business, E-Management and E-Learning—IC4E ’19, Tokyo, Japan, 10–13 January 2019; Association for Computing Machinery (ACM): New York, NY, USA, 2019; pp. 250–254. [Google Scholar]
- Tagliabue, L.C.; Cecconi, F.R.; Rinaldi, S.; Ciribini, A.L.C. Data driven indoor air quality prediction in educational facilities based on IoT network. Energy Build. 2021, 236, 110782. [Google Scholar] [CrossRef]
- Zaki, S.A.; Damiati, S.A.; Rijal, H.B.; Hagishima, A.; Razak, A.A. Adaptive thermal comfort in university classrooms in Malaysia and Japan. Build. Environ. 2017, 122, 294–306. [Google Scholar] [CrossRef]
- Ceranic, B.; Beardmore, J.; Cox, A. Rapid deployment modular building solutions and climatic adaptability: Case based study of a novel approach to “thermal capacity on demand”. Energy Build. 2018, 167, 124–135. [Google Scholar] [CrossRef]
- Song, G.-S.; Lim, J.-H.; Ahn, T.-K. Air conditioner operation behaviour based on students’ skin temperature in a classroom. Appl. Ergon. 2012, 43, 211–216. [Google Scholar] [CrossRef]
- Cheryan, S.; Ziegler, S.A.; Plaut, V.C.; Meltzoff, A. Designing Classrooms to Maximize Student Achievement. Policy Insights Behav. Brain Sci. 2014, 1, 4–12. [Google Scholar] [CrossRef]
- Najafi, N.; Movahed, K.; Barzegar, Z.; Samani, S. Environmental Factors Affecting Students’ Stress in the Educational Environment: A Case Study of Shiraz Schools. Int. J. Sch. Health 2018, 5, 1–7. [Google Scholar] [CrossRef]
- Sahin, L.; Figueiro, M.G. Alerting effects of short-wavelength (blue) and long-wavelength (red) lights in the afternoon. Physiol. Behav. 2013, 116–117, 1–7. [Google Scholar] [CrossRef] [PubMed]
- Sahin, L.; Wood, B.M.; Plitnick, B.; Figueiro, M.G. Daytime light exposure: Effects on biomarkers, measures of alertness, and performance. Behav. Brain Res. 2014, 274, 176–185. [Google Scholar] [CrossRef]
- Smolders, K.C.; de Kort, Y. Bright light and mental fatigue: Effects on alertness, vitality, performance and physiological arousal. J. Environ. Psychol. 2014, 39, 77–91. [Google Scholar] [CrossRef]
- Yang, W.; Jeon, J.Y. Effects of Correlated Colour Temperature of LED Light on Visual Sensation, Perception, and Cognitive Performance in a Classroom Lighting Environment. Sustainability 2020, 12, 4051. [Google Scholar] [CrossRef]
- De Rubeis, T.; Muttillo, M.; Pantoli, L.; Nardi, I.; Leone, I.; Stornelli, V.; Ambrosini, D. A first approach to universal daylight and occupancy control system for any lamps: Simulated case in an academic classroom. Energy Build. 2017, 152, 24–39. [Google Scholar] [CrossRef]
- Keis, O.; Helbig, H.; Streb, J.; Hille, K. Influence of blue-enriched classroom lighting on student’ cognitive performance. Trends Neurosci. Educ. 2014, 3, 86–92. [Google Scholar] [CrossRef]
- Sun, B.; Zhang, Q.; Cao, S. Development and Implementation of a Self-Optimizable Smart Lighting System Based on Learning Context in Classroom. Int. J. Environ. Res. Public Health 2020, 17, 1217. [Google Scholar] [CrossRef]
- Braniš, M.; Řezáčová, P.; Domasová, M. The effect of outdoor air and indoor human activity on mass concentrations of PM10, PM2.5, and PM1 in a classroom. Environ. Res. 2005, 99, 143–149. [Google Scholar] [CrossRef]
- Sangiorgi, G.; Ferrero, L.; Ferrini, B.; Porto, C.L.; Perrone, M.; Zangrando, R.; Gambaro, A.; Lazzati, Z.; Bolzacchini, E. Indoor airborne particle sources and semi-volatile partitioning effect of outdoor fine PM in offices. Atmos. Environ. 2013, 65, 205–214. [Google Scholar] [CrossRef]
- Chithra, V.; Nagendra, S.S. Indoor air quality investigations in a naturally ventilated school building located close to an urban roadway in Chennai, India. Build. Environ. 2012, 54, 159–167. [Google Scholar] [CrossRef]
- Canha, N.; Almeida, S.M.; Freitas, M.D.C.; Trancoso, M.; Sousa, A.; Mouro, F.; Wolterbeek, H.T. Particulate matter analysis in indoor environments of urban and rural primary schools using passive sampling methodology. Atmos. Environ. 2014, 83, 21–34. [Google Scholar] [CrossRef]
- Yang, W.; Moon, H.J. Cross-modal effects of noise and thermal conditions on indoor environmental perception and speech recognition. Appl. Acoust. 2018, 141, 1–8. [Google Scholar] [CrossRef]
- Twardella, D.; Matzen, W.; Lahrz, T.; Burghardt, R.; Spegel, H.; Hendrowarsito, L.; Frenzel, A.C.; Fromme, H. Effect of classroom air quality on students’ concentration: Results of a cluster-randomized cross-over experimental study. Indoor Air 2012, 22, 378–387. [Google Scholar] [CrossRef] [PubMed]
- Stazi, F.; Naspi, F.; Ulpiani, G.; DI Perna, C. Indoor air quality and thermal comfort optimization in classrooms developing an automatic system for windows opening and closing. Energy Build. 2017, 139, 732–746. [Google Scholar] [CrossRef]
- Dutta, J.; Roy, S.; Chowdhury, C. Unified framework for IoT and smartphone based different smart city related applications. Microsyst. Technol. 2018, 25, 83–96. [Google Scholar] [CrossRef]
- Klatte, M.; Bergström, K.; Lachmann, T. Does noise affect learning? A short review on noise effects on cognitive performance in children. Front. Psychol. 2013, 4, 578. [Google Scholar] [CrossRef] [PubMed]
- Sutjarittham, T.; Gharakheili, H.H.; Kanhere, S.S.; Sivaraman, V. Experiences With IoT and AI in a Smart Campus for Optimizing Classroom Usage. IEEE Internet Things J. 2019, 6, 7595–7607. [Google Scholar] [CrossRef]
- Marlina, S.; Rahmawati, A. The Effect of Teacher’s Competency, Physical Environment of Classroom and Family Environment Towards Students’ Learning Motivation. KnE Soc. Sci. 2018, 3, 224–237. [Google Scholar] [CrossRef]
- Recalde, J.M.; Palau, R.; Galés, N.L.; Gallon, R. Developments for Smart Classrooms. Int. J. Mob. Blended Learn. 2020, 12, 34–50. [Google Scholar] [CrossRef]
- Cebrián, G.; Palau, R.; Mogas, J. The Smart Classroom as a Means to the Development of ESD Methodologies. Sustainability 2020, 12, 3010. [Google Scholar] [CrossRef]
- Durães, D.; Carneiro, D.; Bajo, J.; Novais, P. Modelling a smart environment for nonintrusive analysis of attention in the workplace. Expert Syst. 2018, 35, e12275. [Google Scholar] [CrossRef]
- Babiker, A.; Faye, I.; Mumtaz, W.; Malik, A.S.; Sato, H. EEG in classroom: EMD features to detect situational interest of students during learning. Multimed. Tools Appl. 2018, 78, 16261–16281. [Google Scholar] [CrossRef]
- Kim, P.W. Ambient intelligence in a smart classroom for assessing students’ engagement levels. J. Ambient Intell. Humaniz. Comput. 2018, 10, 3847–3852. [Google Scholar] [CrossRef]
- Bluyssen, P.M.; Zhang, D.; Kurvers, S.; Overtoom, M.; Ortiz-Sanchez, M. Self-reported health and comfort of school children in 54 classrooms of 21 Dutch school buildings. Build. Environ. 2018, 138, 106–123. [Google Scholar] [CrossRef]
- Li, J.; Shi, D.; Tumnark, P.; Xu, H. A system for real-time intervention in negative emotional contagion in a smart classroom deployed under edge computing service infrastructure. Peer-to-Peer Netw. Appl. 2020, 13, 1706–1719. [Google Scholar] [CrossRef]
- Radosavljevic, V.; Radosavljevic, S.; Jelic, G. Ambient intelligence-based smart classroom model. Interact. Learn. Environ. 2019, 30, 307–321. [Google Scholar] [CrossRef]
- Liu, L.; Peng, N. Evaluation of user concentration in ubiquitous and cognitive artificial intelligence-assisted English online guiding system integrating face and eye movement detection. Int. J. Commun. Syst. 2021, 34. [Google Scholar] [CrossRef]
- Kim, Y.; Soyata, T.; Behnagh, R.F. Towards Emotionally Aware AI Smart Classroom: Current Issues and Directions for Engineering and Education. IEEE Access 2018, 6, 5308–5331. [Google Scholar] [CrossRef]
- Gupta, S.K.; Ashwin, T.S.; Guddeti, R.M.R. Students’ affective content analysis in smart classroom environment using deep learning techniques. Multimed. Tools Appl. 2019, 78, 25321–25348. [Google Scholar] [CrossRef]
- Guo, J.; Bai, L.; Yu, Z.; Zhao, Z.; Wan, B. An AI-Application-Oriented In-Class Teaching Evaluation Model by Using Statistical Modeling and Ensemble Learning. Sensors 2021, 21, 241. [Google Scholar] [CrossRef]
- Guo, Q. Detection of Head Raising Rate of Students in Classroom Based on Head Posture Recognition. Trait. Signal 2020, 37, 823–830. [Google Scholar] [CrossRef]
- Henry, J.; Tang, S.; Mukhopadhyay, S.; Yap, M.H. A randomised control trial for measuring student engagement through the Internet of Things and serious games. Internet Things 2021, 13, 100332. [Google Scholar] [CrossRef]
- Da-Hong, L.; Hong-Yan, L.; Wei, L.; Guo, J.; En-Zhong, L. Application of flipped classroom based on the Rain Classroom in the teaching of computer-aided landscape design. Comput. Appl. Eng. Educ. 2020, 28, 357–366. [Google Scholar] [CrossRef]
- Mergany, N.N.; Dafalla, A.-E.; Awooda, E. Effect of mobile learning on academic achievement and attitude of Sudanese dental students: A preliminary study. BMC Med. Educ. 2021, 21, 121. [Google Scholar] [CrossRef]
- Kang, K.; Kushnarev, S.; Pin, W.W.; Ortiz, O.; Shihang, J.C. Impact of Virtual Reality on the Visualization of Partial Derivatives in a Multivariable Calculus Class. IEEE Access 2020, 8, 58940–58947. [Google Scholar] [CrossRef]
- Dabbour, E. Assessing the Effects of Implementing an Online Student-Response System in a Transportation Engineering Course. J. Prof. Issues Eng. Educ. Pract. 2017, 143, 05016006. [Google Scholar] [CrossRef]
- Paudel, P.; Kim, S.; Park, S.; Choi, K.-H. A Context-Aware IoT and Deep-Learning-Based Smart Classroom for Controlling Demand and Supply of Power Load. Electronics 2020, 9, 1039. [Google Scholar] [CrossRef]
- Li, Y.; Chen, L. Improved LSTM data analysis system for IoT-based smart classroom. J. Intell. Fuzzy Syst. 2020, 39, 5141–5148. [Google Scholar] [CrossRef]
- Zhu, Z.M.; Xu, F.Q.; Gao, X. Research on School Intelligent Classroom Management System Based on Internet of Things. Procedia Comput. Sci. 2020, 166, 144–149. [Google Scholar] [CrossRef]
- Celdrán, A.H.; Ruipérez-Valiente, J.A.; Clemente, F.J.G.; Rodríguez-Triana, M.J.; Shankar, S.K.; Pérez, G.M. A Scalable Architecture for the Dynamic Deployment of Multimodal Learning Analytics Applications in Smart Classrooms. Sensors 2020, 20, 2923. [Google Scholar] [CrossRef] [PubMed]
- Gao, Z.; Huang, Y.; Zheng, L.; Li, X.; Lu, H.; Zhang, J.; Zhao, Q.; Diao, W.; Fang, Q.; Fang, J. A Student Attendance Management Method Based on Crowdsensing in Classroom Environment. IEEE Access 2021, 9, 31481–31492. [Google Scholar] [CrossRef]
- Anitha, S.; Padma, T. A web service-based internet of things framework for mobile resource augmentation. Int. J. Commun. Syst. 2020, 33, e4475. [Google Scholar] [CrossRef]
- Yin, S.; Zhang, D.; Zhang, D.; Li, H. Wireless sensors application in smart English classroom design based on artificial intelligent system. Microprocess. Microsyst. 2021, 81, 103798. [Google Scholar] [CrossRef]
- Min-Allah, N.; Alrashed, S. Smart campus—A sketch. Sustain. Cities Soc. 2020, 59, 102231. [Google Scholar] [CrossRef] [PubMed]
- Shapsough, S.Y.; Zualkernan, I.A. A Generic IoT Architecture for Ubiquitous Context-Aware Learning. IEEE Trans. Learn. Technol. 2020, 13, 449–464. [Google Scholar] [CrossRef]
- Belapurkar, N.; Harbour, J.; Shelke, S.; Aksanli, B. Building Data-Aware and Energy-Efficient Smart Spaces. IEEE Internet Things J. 2018, 5, 4526–4537. [Google Scholar] [CrossRef]
- Zaguia, A.; Ameyed, D.; Haddar, M.; Cheikhrouhou, O.; Hamam, H. Cognitive IoT-Based e-Learning System: Enabling Context-Aware Remote Schooling during the Pandemic. J. Healthc. Eng. 2021, 2021, 1–12. [Google Scholar] [CrossRef]
- Liu, J.; Wang, C.; Xiao, X. Internet of Things (IoT) Technology for the Development of Intelligent Decision Support Education Platform. Sci. Program. 2021, 2021, 6482088. [Google Scholar] [CrossRef]
- López-Jiménez, J.J.; Fernández-Alemán, J.L.; González, L.L.; Sequeros, O.G.; Valle, B.M.; García-Berná, J.A.; Idri, A.; Toval, A. Taking the pulse of a classroom with a gamified audience response system. Comput. Methods Programs Biomed. 2021, 213, 106459. [Google Scholar] [CrossRef]
- Razzaq, S.; Shah, B.; Iqbal, F.; Ilyas, M.; Maqbool, F.; Rocha, A. DeepClassRooms: A deep learning based digital twin framework for on-campus class rooms. Neural Comput. Appl. 2022, 1–10. [Google Scholar] [CrossRef] [PubMed]
- Yildiz, D.; Uzunsakal, E. Alan Araştırmalarında Güvenilirlik Testlerinin Karşılaştırılması ve Tarımsal Veriler Üzerine Bir Uygulama [Comparison of Reliability Tests in Field Studies and an Implementation on Agricultural Data]. Uygul. Sos. Bilimler Derg. 2018, 2, 14–18. [Google Scholar]
- Yucel, M.; Ozturk, N.F.; Gemci, C. Design of a Fiber Bragg Grating multiple temperature sensor. In Proceedings of the 2016 Sixth International Conference on Digital Information and Communication Technology and Its Applications (DICTAP), Konya, Turkey, 21–23 July 2016; Institute of Electrical and Electronics Engineers (IEEE): Manhattan, NY, USA, 2016; pp. 6–11. [Google Scholar]
- Yucel, M.; Ozturk, N.F.; Goktas, H.H.; Gunduz, A.E. Design of a Fiber Bragg Grating based temperature sensor. In Proceedings of the 2016 24th Signal Processing and Communication Application Conference (SIU), Zonguldak, Turkey, 16–19 May 2016; Institute of Electrical and Electronics Engineers (IEEE): Manhattan, NY, USA, 2016; pp. 669–672. [Google Scholar]
- Yücel, M.; Yücel, M.; Gündüz, A.E.; Göktaş, H.H.; Öztürk, N.F. Using single-mode fiber as temperature sensor. In Proceedings of the 24th Signal Processing and Communication Application Conference (SIU), Zonguldak, Turkey, 16–19 May 2016; pp. 461–464. [Google Scholar]
- Burunkaya, M.; Yucel, M. Measurement and Control of an Incubator Temperature by Using Conventional Methods and Fiber Bragg Grating (FBG) Based Temperature Sensors. J. Med. Syst. 2020, 44, 178. [Google Scholar] [CrossRef] [PubMed]
Figure 1.
System structure of the SCI.

Figure 2.
The layout of the SCI’s measurement and control points.

Figure 3.
The classroom with the installed smart classroom incubator (SCI).

Figure 4.
Dimensions (cm) and geographical position of the SCI.

Figure 5.
The basic algorithm of the software of the data box.

Figure 6.
Data box interface.

Figure 7.
Natural ventilation system.

Figure 8.
The basic algorithm of the software of the natural ventilation system.

Figure 9.
The basic algorithm of the software of the dynamic lighting and UVC sterilization system.

Figure 10.
Dynamic air conditioning control system.

Figure 11.
Tree topology diagram.

Figure 12.
Data visualization.

Figure 13.
Coding that represents students’ positions.

Figure 14.
Teachers’ sound distribution measurements before (on the left) and after (on the right) feedback.
Figure 14.
Teachers’ sound distribution measurements before (on the left) and after (on the right) feedback.

Figure 15.
Average score chart of the five tests applied in classical and smart classrooms.


Table 1.
Test results.
| The Number of Participants | Cronbach’s Alpha Coefficient | Number of Expressions |
|---|---|---|
| 295 | 0.891 | 30 |
Table 2.
Alpha values obtained when questions are removed.
| No | Alpha | No | Alpha | No | Alpha | No | Alpha | No | Alpha | No | Alpha |
|---|---|---|---|---|---|---|---|---|---|---|---|
| 1 | 0.890 | 6 | 0.890 | 11 | 0.890 | 16 | 0.889 | 21 | 0.888 | 26 | 0.887 |
| 2 | 0.888 | 7 | 0.889 | 12 | 0.891 | 17 | 0.888 | 22 | 0.890 | 27 | 0.893 |
| 3 | 0.889 | 8 | 0.887 | 13 | 0.889 | 18 | 0.888 | 23 | 0.886 | 28 | 0.888 |
| 4 | 0.888 | 9 | 0.886 | 14 | 0.888 | 19 | 0.888 | 24 | 0.887 | 29 | 0.889 |
| 5 | 0.887 | 10 | 0.887 | 15 | 0.890 | 20 | 0.887 | 25 | 0.891 | 30 | 0.889 |
Table 3.
Survey results.
| No | Question | Score % |
|---|---|---|
| 1 | The high temperature negatively affects my focus in the lesson. | 68.14 |
| 2 | The low temperature negatively affects my focus in the lesson. | 68.81 |
| 3 | Someone walking around the classroom to adjust the ambient temperature negatively affects my focus in the lesson. | 52.27 |
| 4 | Constantly changing the temperature setting by the students or the teacher negatively affects my focus on the lesson. | 53.56 |
| 5 | The automatic control of the temperature system has a positive effect on my focus on the lesson. | 70.71 |
| 6 | The fact that the temperature system is not controlled automatically affects my health negatively. | 46.51 |
| 7 | The fact that the temperature system is individual has a positive effect on my focus on the lesson. | 57.29 |
| 8 | In situations where the lighting is insufficient, I get sleepy and this negatively affects my focus on the lesson. | 75.66 |
| 9 | In situations where the lighting is insufficient, I have visual difficulties and this affects my focus in the lesson negatively. | 67.93 |
| 10 | The automatic control of the lighting has a positive effect on my focus on the lesson. | 68.88 |
| 11 | The direct sunlight on my face or its reflection in the classroom negatively affects my focus in the lesson. | 77.76 |
| 12 | Excessive light negatively affects my focus in the lesson. | 72.14 |
| 13 | Preventing the sunlight from coming into my field of view with the automatic curtain has a positive effect on my focus on the lesson. | 75.66 |
| 14 | I am having trouble understanding the information the teacher writes or reflects on the board because the temperature is unstable. | 46.92 |
| 15 | I have trouble understanding the information that the teacher writes or reflects on the board because my perspective is not clear. | 53.22 |
| 16 | I am having trouble understanding the information that the teacher writes or reflects on the board due to insufficient light. | 47.25 |
| 17 | I disagree with my friends about leaving windows open to ventilate the classroom. | 51.19 |
| 18 | The wind/cold caused by keeping the windows open all the time affects my health negatively. | 63.73 |
| 19 | The external noise caused by keeping the windows open all the time negatively affects my focus on the lesson. | 66.92 |
| 20 | Not properly ventilating the classroom environment negatively affects my focus on the lesson. | 62.85 |
| 21 | Automatic control of the window for natural ventilation positively affects my focus on the lesson. | 66.51 |
| 22 | Perfume etc. in the classroom environment. Smells negatively affect my focus on the lesson. | 52.54 |
| 23 | The fact that the teacher’s voice is not heard in the class I am in makes it difficult for me to learn. | 62.37 |
| 24 | The fact that the air in the classroom environment does not have enough humidity negatively affects my focus on the lesson. | 53.76 |
| 25 | The high humidity of the air in the classroom negatively affects my focus on the lesson. | 60.07 |
| 26 | Flu, COVID-19 etc. I think that infectious diseases are transmitted due to insufficient ventilation in the classroom environment. | 55.53 |
| 27 | The high air quality in the classroom has a positive effect on my focus on the lesson. | 81.29 |
| 28 | Regular temperature measurement in the classroom makes me feel comfortable in terms of COVID-19 measures. | 57.69 |
| 29 | Since the school is in the OIZ, I feel worried that the air coming from outside smells bad. | 58.24 |
| 30 | The thought that the air coming from outside can be harmful because the school is in the OIZ worries me. | 57.49 |
Table 4.
Work comparison.
| Classification | Reference No | Thermal | Lighting | Air Quality | Acoistic, Noise | Experimental | Measurement | Automation Control | Energy-saving | Financial sustainability | Model |
|---|---|---|---|---|---|---|---|---|---|---|---|
| Physical Conditions | 2 | ✔ | ✔ | ✔ | ✔ | ||||||
| Physical Conditions | 3 | ✔ | ✔ | ||||||||
| Physical Conditions | 4 | ✔ | |||||||||
| Physical Conditions | 5 | ✔ | ✔ | ✔ | |||||||
| Physical Conditions | 6 | ✔ | ✔ | ✔ | |||||||
| Physical Conditions | 7 | ✔ | ✔ | ✔ | ✔ | ||||||
| Physical Conditions | 8 | ✔ | |||||||||
| Physical Conditions | 9 | ✔ | ✔ | ✔ | ✔ | ✔ | |||||
| Physical Conditions | 10 | ✔ | |||||||||
| Physical Conditions | 11 | ✔ | ✔ | ✔ | ✔ | ✔ | |||||
| Physical Conditions | 12 | ✔ | ✔ | ✔ | ✔ | ||||||
| Physical Conditions | 13 | ✔ | |||||||||
| Physical Conditions | 14 | ✔ | ✔ | ✔ | |||||||
| Physical Conditions | 15 | ✔ | |||||||||
| Physical Conditions | 16 | ✔ | ✔ | ||||||||
| Physical Conditions | 17 | ✔ | ✔ | ✔ | ✔ | ✔ | |||||
| Physical Conditions | 18 | ✔ | ✔ | ||||||||
| Physical Conditions | 19 | ✔ | ✔ | ✔ | |||||||
| Physical Conditions | 20 | ✔ | |||||||||
| Physical Conditions | 21 | ✔ | |||||||||
| Physical Conditions | 22 | ✔ | |||||||||
| Physical Conditions | 23 | ✔ | |||||||||
| Physical Conditions | 24 | ✔ | |||||||||
| Physical Conditions | 25 | ✔ | ✔ | ||||||||
| Physical Conditions | 26 | ✔ | ✔ | ||||||||
| Physical Conditions | 27 | ✔ | ✔ | ||||||||
| Physical Conditions | 28 | ✔ | ✔ | ✔ | |||||||
| Physical Conditions | 29 | ✔ | ✔ | ||||||||
| Physical Conditions | 30 | ✔ | ✔ | ||||||||
| Efficient | 49 | ✔ | ✔ | ✔ | |||||||
| Efficient | 50 | ✔ | |||||||||
| Efficient | 51 | ✔ | |||||||||
| Technology | 55 | ✔ | ✔ | ✔ | ✔ | ||||||
| Technology | 56 | ✔ | ✔ | ||||||||
| Smart Classroom Incubator | ✔ | ✔ | ✔ | ✔ | ✔ | ✔ | ✔ | ✔ | ✔ | ✔ |
Publisher’s Note: MDPI stays neutral with regard to jurisdictional claims in published maps and institutional affiliations. |
© 2022 by the authors. Licensee MDPI, Basel, Switzerland. This article is an open access article distributed under the terms and conditions of the Creative Commons Attribution (CC BY) license (https://creativecommons.org/licenses/by/4.0/).
Share and Cite
MDPI and ACS Style
Burunkaya, M.; Duraklar, K. Design and Implementation of an IoT-Based Smart Classroom Incubator. Appl. Sci. 2022, 12, 2233. https://doi.org/10.3390/app12042233
AMA Style
Burunkaya M, Duraklar K. Design and Implementation of an IoT-Based Smart Classroom Incubator. Applied Sciences. 2022; 12(4):2233. https://doi.org/10.3390/app12042233
Chicago/Turabian StyleBurunkaya, Mustafa, and Kazım Duraklar. 2022. "Design and Implementation of an IoT-Based Smart Classroom Incubator" Applied Sciences 12, no. 4: 2233. https://doi.org/10.3390/app12042233
Note that from the first issue of 2016, this journal uses article numbers instead of page numbers. See further details here.