
A Comprehensive Techno-Economic Model for Fast and Reliable Analysis of the Telecom Operator Potentials

1
HT Eronet Mostar, 88000 Mostar, Bosnia and Herzegovina
2
FESB Split, University of Split, 21000 Split, Croatia
*
Author to whom correspondence should be addressed.
Appl. Sci. 2022, 12(20), 10658; https://doi.org/10.3390/app122010658
Submission received: 30 August 2022
/
Revised: 8 October 2022
/
Accepted: 13 October 2022
/
Published: 21 October 2022
Abstract
:Modern telecom operators will have to change their business approach, organization, products development and services development, customer approach and many other important issues if they want to be competitive on the telecom markets in the following years and decades. They will have key roles in this period dubbed the Industry 4.0 era. There are many different models of analysis for telecom operators, but they all have a partial approach to analysis and none of them gives a complete picture of the analysis of telecoms. The Comprehensive Techno-Economic (CTE) model for the analysis of telecom operator potentials is a new and original model for analysis and will significantly help in their transformation processes. This model will enable a quick and easy analysis of the potential of the telecom operator, but also of individual parts of it, regardless of other parts of the company. Despite the fact that the model is easy to define the input data and that it is fast in applying the analysis, it gives precise and mathematically defined results from which one can see the assessment of the potential of telecom or independent assessment of its parts. The main advantages of this model are simplicity, speed of telecom analysis, accuracy of results and its modularity, i.e., independent evaluation of individual parts. Such a model is necessary for telecom operators to achieve fast and reliable potential assessment, analysis, modeling and the easier adaptation of new products and services. This is a unique model with a scientific background and theoretical settings, and it provides practical application in the telecommunication market.
1. Introduction
The era known as Industry 4.0 brings big changes to all business segments and, therefore, people’s lives. Perhaps the biggest impact of this economic revolution will be on the telecommunications segment and thus on telecom operators.
Telecom operators will have a key role in the Industry 4.0 era. Their participation in the full capacity and contribution to the development of the quality of people’s lives will require that they adapt in accordance with the changes brought about by this period. This adjustment will not be easy, and many will make mistakes, further slowing their own development, as well as Industry 4.0 activity. Therefore, it is necessary to have a comprehensive model that will provide an accurate, fast and high-quality assessment of the potential of telecoms, suggesting guidelines for the development and transformation of telecom operators according to the results.
After researching currently known and primarily used models and their applications [1,2,3,4,5,6], it was concluded that there is no model for very fast, high-quality telecom operator potential analysis “from the top to the bottom”.
The analyzed models and frameworks are: Enhanced Telecom Operations Map (eTOM) Frameworks, the Shared Information and Data (SID) Model, the Technology Acceptance Model (TAM), the Training Needs Assessment (TNA), Technological-Organizational-Environmental Frameworks (TOE), Information Technology Infrastructure Library Frameworks (ITIL), Different Techno-Economical Models [7], Different Business Analysis, Different Cost Analysis, the SWOT Model, the PESTLE Model, Porter’s Five Forces, the Ansoff Matrix, the Boston Consultancy Group Matrix (BCG) and other relevant models. All relevant explanations of these models can be found in Appendix A of this paper.
eTOM (Enhanced Telecom Operations Map) Frameworks [8,9,10,11,12,13,14,15,16] defines all details and parts of the telecom service provider activities. The set of documents helps in creating business processes “from end to end” for telecom operators [17]. Sharing information and data model (SID) defines telecom operator business processes and serves the purpose of the quality development of open and automated OSS/BSS systems [18,19,20]. The Technology Acceptance Model (TAM) [21,22,23], together with the Technology-Organization-Environment (TOE) model [24], explore factors of building information modelling (BIM), but the TAM model also analyzes the substantial use of Internet technologies for training and learning purposes. The TOE framework model defines three main levels and their influence on how individual organizations accept innovations based on new technologies and their dimensions and characteristics. The TNA model [25,26,27] creates and defines rules for Human Resources (HR) issues in any company and represents an excellent base for HR in the CTE Model. The IT Infrastructure Library (ITIL) framework [28,29,30] analyzes, among other items in the IT segment, maturity level and smart city readiness. This framework was one of the very good starting points in the development of certain areas (Technological Development Area and Service Development Area) in the CTE model.
Business Analysis models [31,32,33,34,35] analyze different segments in telecom operators; for example, price controls and defining margin rules, competitive strategy, interaction of the OTT business model and the telecom operator, competition and sustainable competitiveness in the business ecosystem, identifying business ecosystems, IT investments in telecom operators and their usability in business processes, and many other purposes. The Cost Analysis Model [36,37,38,39] develops the mechanism of risk-adjusted scheduling and cost budgeting of research and development (R&D) projects in telecommunications, analyzes customer satisfaction, switching intentions, perceived switching costs and perceived alternative attractiveness, and develops case studies for cost allocation regarding flex-grid optical networks and similar projects, churn prediction in the telecommunications sector, etc. TEM serves many different purposes [40,41,42] of analysis. For example, it analyzes pure 5G network models and comparison of the Cognitive Radio and Software Defined Network (SDN) in 5G mobile networks, defines and develops business modeling of optical networks for Metropolitan Area Networks (MAN), evaluates optical disaggregation architectures in the context of metropolitan area networks, and so on.
Also, commonly used models for evaluating certain companies are SWOT, PESTLE, the Ansoff Matrix, Porter’s Five Forces and the BCG Matrix models. All relevant explanations of these models can be found in Appendix A of this paper.
All of the above-mentioned facts point to there being no single model for a quick but precise analysis of the telecom operator’s potential (from top to bottom). In this period and in the years and decades that follow, the telecommunications market will go through many challenges and changes during Industry 4.0. Due to these reasons, it is mandatory to have a unique model for a quick, precise, and high-quality assessment of the potential of telecom operators with an assessment of the main advantages and disadvantages. The CTE model was created exactly for this purpose.
During the Industry 4.0 era, the telecommunications market will change drastically. This is being reflected in almost all business segments, from the introduction of new technologies, through the development of new products, services and the development of sales networks and customer service, as well as a greater orientation towards the development of its own employees. Because of such rapid, sweeping changes, there is a need for such a model and a completely different approach for analysis than is prevalent in current models used for analyses in telecommunications.
This article presents and describes the Comprehensive Techno-Economic (CTE) model for the assessing of telecom operator potentials. The CTE model is a new and original model based on the research of existing models of analysis and experience in telecommunications. This model is fast, reliable and efficient in assessing the potential of a particular telecom and provides accurate potential assessment results. In addition, this model is modular and can be used to estimate individual parts of telecoms. The CTE model can also be used to compare two or more telecoms from the same or different countries.
The main goals of the CTE model are defined as follows:
- To calculate and evaluate the potential of a telecom operator easily and quickly with remarkably high accuracy;
- To calculate and evaluate the potential of area(s) of the telecom operator easily and quickly with very high accuracy;
- To compare two or more telecom operators from one or more countries;
- To aid managers and employees in making certain strategic business decisions.
This model can be used wholly unto itself, but can also be used modularly: one or several items from one or more areas, an entire area or several areas together for assessing the data of telecom operators(s). It measures the potential of internal items on the business of telecoms but also assesses the potential of telecom resilience in the face of external factors. The model gives results that will help to support relevant business and strategic decisions, which have been noticed as the main shortcoming of the existing models used for telecom modeling and adaptation to the changes brought forth by Industry 4.0.
In this research, of which one of its parts is shown in this paper, two hypotheses have been proven and thus confirmed:
Main hypothesis: By developing a modular model for telecom operator analysis, and based on defined areas and defined items for analysis within certain areas, it is possible to make an objective quantitative assessment of individual segments of telecom operators for better and more efficient operations.
Second hypothesis: This model will enable comprehensive or partial qualitative and quantitative comparison among telecom operators in the same or different countries.
The scientific contributions of this research and final model are:
- -
- The development of a new modular model of the telecom operator, which will make it possible to objectively and more easily optimize the adoption of certain key and strategic technological and business decisions.
- -
- The application of the model in optimizing different areas of a telecom operator separately and independently, easily and quickly.
In Section 2, a brief presentation of the scientific literature is given in order to show that significant research is being carried out regarding the transformation of the telecommunications market in the Industry 4.0 era. Changes in the telecommunications market directly affect the need for fast and high-quality transformation of telecom operators in order to respond to these changes.
In Section 3 of this paper, explanations are given for each of the areas (Table 1) and a description of one item with the corresponding equation. Other items with associated equations are defined and described in the Appendix A, Appendix B, Appendix C, Appendix D, Appendix E, Appendix F, Appendix G, Appendix H, Appendix I, Appendix G, Appendix K, Appendix L, Appendix M, Appendix N, Appendix O, Appendix P. Table 2 lists the basic objectives of the analysis of each of the areas, the impact of forward-backward connections between the areas and links to parts of the text and appendices for all areas.
Section 4 describes the use of the model for the comparison of three telecoms in the same country and the method of modular application of the model. In that chapter, the method of reading the results was also shown, and it was shown how to use the model to obtain guidelines for certain strategic business decisions.
Section 5 shows the use of the entire model for the analysis of one telecom, as well as a presentation of the results and how to use them for the purpose of obtaining guidelines for making strategic business decisions. At the end of the paper, a detailed conclusion is given (Section 5) about the model, its advantages, how to use it and the continuation of research to improve the model. The paper includes 16 Appendix A, Appendix B, Appendix C, Appendix D, Appendix E, Appendix F, Appendix G, Appendix H, Appendix I, Appendix G, Appendix K, Appendix L, Appendix M, Appendix N, Appendix O, Appendix P that serve to facilitate the understanding of the use of the model in practice.
2. A Review of the Relevant Literature for the Analysis of Telecom Operators
There is much research circulating around the world dealing with the changes and adaptations of telecoms in the Industry 4.0 era, which will have a significant impact on their business in the coming years and decades. For example, [43] provides empirical evidence for sustainable growth research and useful insights for practitioners to maintain sustainable growth for major telecom opaerators in China. Based on the resource-based view (RBV), this study explores the factors that influence sustainable growth. In [44], systematic research was carried out on collaboration and adaptation attempts between business models and technological innovation. Research shows that the novel mode is beneficial both to telecom users and telecom enterprises. Corporation social responsibility (CSR) is a key topic in the next analyzed article [45]. This paper aims to evaluate and analyze the maturity of CSR practices through an empirical study for telecom companies in KSA. Article [46] analyzes relationships between telecom operators and OTT service providers. The booming OTT business has had a significant impact on traditional telecommunication businesses, such as with voice and short message services, and the sense of crisis among telecommunication operators shows that the channeling trend has become increasingly obvious. Faced with competition on the distribution of interests between channels and content, telecommunication operators and OTT service providers are engaged in fierce competition and cooperation simultaneously.
The study [47] investigates the factors affecting Bharti Airtel’s cross-border postacquisition performance in an African market. This article analyzes and describes the relationships among numerous factors such as technical capability, affiliated firms’ absorptive capacity and organizational learning capabilities. Their relationships determine successful operations of the analyzed acquisition deal. The analysis and study of three telecoms is presented in article [48]. This article gives managers and stakeholders (including customers, capital owners and employees) a means to understand major changes and determinants of value creation and distribution. The main focus here is on explaining the extent to which various stakeholders—employees, customers, capital owners and government—were able to appropriate the value created by the firms.
Article [49] deals with the issue and comparison of three telecoms in Yemen. This survey reveals that a significant link with technology acceptance and use exists between device automaticity, user experience, system efficiency and information quality. According to the study findings, the adoption of the proposed model will play an important part in the successful application of the modern technology in Yemeni companies. The next paper, [50], deals with the examination of knowledge management and market orientation, innovation and organizational performance. This research was conducted on the telecommunication market in Pakistan. The objective of this research was to examine the impact of knowledge management orientation on a firm’s performance with the mediating role of organizational innovation and market orientation. The presented results of the study demonstrate that knowledge management orientation plays an affirmative role in the promotion of organizational performance. Another paper deals with the link between technology, knowledge management and service development in the telecom industry in Indonesia during Industry 4.0 [51]. This further confirms the interest of scientists and experts in research in the field of telecommunications during the Industry 4.0 era. The authenticity of this research lies in the description of how management emerges with a practical oriented framework of how organizations must be formed to be innovative and competitive through the general arrangement of antecedents of service innovation. Research conducted in Poland is presented in the following paper [52]. The aim of the research is to discover new knowledge allowing for the description and design of 4.0 business models using network effects. The results of the study present the possibility of using the network effect in business models 4.0. The paper develops a framework for business model analysis from the perspective of Industry 4.0. The presented research will allow for an indication of the possibility of using a business model from the perspective of Industry 4.0, based on the theory of the network effect in developing the value of network organizations. In recent years, the influence of Industry 4.0 on the telecommunications market has been researched and analyzed extensively. Thus, [53] analyzes a new approach in the creation and development of new advanced telecom services. New approaches are now on the production floor—flexible but ultra-reliable, low latency wireless communications through interoperable systems that share data. The current paper aims to provide an overview of converging telco-grade solutions that can be successfully applied in the wide sense of industrial production. Within the framework of this research, many articles and studies conducted around the world have been investigated; among them, only one more—[54]—will be presented here. The fast development of smart sensors and wearable devices has provided the opportunity to develop intelligent operator workspaces. The primary enabling factor of the resultant Operator 4.0 paradigm is the integration of advanced sensor and actuator technologies and communications solutions. This work provides an extensive overview of these technologies and highlights that the design of future workplaces should be based on the concept of intelligent space.
Research and development of the CTE Model was started in 2015. From then until today, this model has undergone certain changes and additions. Other research the world over has been followed along with in order to confirm the need for such a model. In this overview, and in the previous part of the text, only research from the past few years that has been carried out in many countries around the world (China, Indonesia, Poland, South Africa, Yemen) are listed. The amount of research in this area is growing significantly, for which the thesis that this area requires further elaboration is confirmed. This is precisely why there is a recognized need for a model that can, relatively quickly and without the engagement of many people, and, at the same time accurately and qualitatively assess the potential of telecoms in the output of the Industry 4.0 era, suggest what needs to be changed and/or further improved. One such model is missing in this field because all the others analyzed and presented in the Introduction and Appendix A, Appendix B, Appendix C, Appendix D, Appendix E, Appendix F, Appendix G, Appendix H, Appendix I, Appendix G, Appendix K, Appendix L, Appendix M, Appendix N, Appendix O, Appendix P are too complex and require much time and human potential to use them. This research was started for that reason, and the results will be presented in a subsequent part of the text.
3. Description of Comprehensive Techno-Economic (CTE) Model
3.1. Disadvantages and Shortcomings of Existing Models for the Analysis of Telecom Operators
All previously mentioned models work with a large dose of subjectivism, and yet no model offers a complete picture and overview of the state and potential of telecom operators. This research, which was conducted over the last few years, has defined the need for creating a unique and comprehensive model that could minimize and even eliminate subjectivity in the results.
3.2. Description of Levels, Areas, Segments and Items in the CTE Model
The first and basic division in the model is the division into levels. This model has been defined by three levels:
- Technical Level (TL)
- Business Level (BL)
- Environmental Level (EL)
These three levels will consist of different segments, which are the second division of the model. Individual segments will be grouped into areas because all segments do not have the same importance in terms of the analysis of telecom potential [54,55].
The final number of different defined segments in this model is fourteen. These fourteen segments can describe any telecom operator potential from the top to the bottom. They are as follows:
- Coverage and accessibility to users (TL),
- Technological development (TL)
- IT Development (TL)
- Products Development (BL)
- Services Development (BL)
- Sales (BL)
- Customer Care (BL)
- Human Resources—HR (BL)
- Political Environment (EL)
- Regulatory Environment (EL)
- Law Environment (EL)
- Finance Environment (EL)
- Quality of Brand (EL)
- Presence in public (EL)
The last divisions in this model are items. Each segment/area is defined by specially defined items that essentially describe and give value to the entire area. Each of the items is mathematically described, their sum revealing the total value of the area. The actual version of the CTE model has three levels, eight areas, fourteen segments and various items in each area. The format of the model is “2–4–2”. All items in each area have a maximum worth of 0.1 (10%), and each area has a maximum value equal to 1 (100%). Table 1 shows and explains this distribution.
The results will be presented as follows:
- Total amount of CTE Model for individual telecom operator potential;
- Total Area Value (max. value of each area is 1);
- Each item’s value in each area;
- Tabular and graphical forms for easier comparison of telecoms.
Before a more detailed description of individual areas and items, a tabular representation of the relationship between areas, their mutual influence and connections to individual parts can be found in the article. The table will explain the following:
- Main targets: Assessment and calculation of telecom potential regarding the specific areas;
- Forward links: Showing the influence of the observed area on other areas of the model;
- Backward links: Showing which other areas have an influence on the observed area;
- Chapter in the article: Link to chapter in article;
- Appendix: Link to Appendix in article.
Table 2 gives a brief overview and main goals of the analysis in individual fields, mutual links between fields and links to chapters and appendices in the text. In this way, it is easier to understand the principle and mode of operation of the model and to obtain additional information about individual areas and items within them.
3.3. Technical Level in the CTE Model
The Technical Level consists of three segments, which are as follows:
- Coverage and accessibility to users (TL);
- Technological development (TL);
- IT Development (TL).
According to the characteristics of these segments and what they provide in their outputs to assess potential of the telecom, these segments provide two areas.
3.3.1. “Coverage and Accessibility to Users” Area
The following ten (10) items have been defined in the C&A area:
- Mobile connectivity and availability:
- Quality of mobile data access in urban areas (outdoors);
- Quality of mobile data access in special parts of urban areas—areas of mass gatherings;
- Quality of mobile data access in rural areas;
- Quality of mobile data access on roads: highways and main state roads;
- Quality of mobile data access on roads: regional roads and local roads.
- Fixed connectivity and availability:
- Distribution and number of transmission fiber optics cables (fibers) at the state level among urban settlements;
- Percentage of connections to homes (houses, flats, apartments…) by fiber optic cables—FTTH (fiber to the home);
- Percentage of connections to factories, business facilities, incubators, etc. by fiber optic cables—FTTBus;
- Local loop shortening of the copper network—percentage number of households and companies that are less than 500 m from the last telecom connection point;
- Quality of protection of the primary transmission system.
According to all surveys and research, the future of telecommunications is based on the (mobile) Internet and services based on connection to the (mobile) Internet. Some services will be sensitive and dependent mostly on download speed, some on upload speed, some will be sensitive to latency and others to different combinations of these two or even all three factors. In order to analyze the quality of the mobile signal (first five items), the following items will be measured for a mobile sub-segment in the “C&A area”:
- Download data rate (Mb/s);
- Upload data rate (Mb/s);
- Delay of data signal (ms).
The mathematical equations for calculating of the first five items is given as follows:
where:
QoMD = The Quality of Mobile Data access
AvgADD represents the Average Access to Mobile Data Download, calculated as:
RefADD represents the Referent Download Access Speed (this value changes according to the development of mobile systems),
AvgADU represents the Average Access to Mobile Data Upload, calculated as:
RefADU represents the Referent Upload Access Speed (this value changes according to the development of mobile systems),
RefDEL represents the Referent delay of sampling (this value changes according to the development of mobile systems),
AvgDEL represents the Average delay, calculated as:
FDL represents the Factor that defines download importance,
FUL represents the Factor that defines upload importance,
FDY represents the Factor that defines delay importance,
N represents the Number of samples,
Number 0.1 represents the maximum worth of this item.
It is important to note that:
FDL + FUL + FDY = 1
It is important to define where, when and how many times mobile signal samples will be taken considering the population and surface of an urban area, locations of rural areas, highways, main state roads, regional roads and local roads [56,57,58,59,60,61,62,63]. These questions—and answers to them—make for differences among the five items. Precise descriptions and definitions of the sampling method for all the first five items of this area are an integral part of the model. The sum of these items gives us the total value of the potential of the telecom operator in terms of accessibility to users via mobile networks.
Another five fixed items, which are also mathematically defined and precisely described, will not be explained here due to a lack of space. It is important to state that the calculation of this area gives us the qualitative and quantitative value of a telecom, i.e., its potential in terms of accessibility to users.
3.3.2. “IT and Technological Development” Area
Another area at the Technical Level in the CTE model is the “Technological and IT Development area“. It consists of two segments: “IT Development“ and “Technological Development“. This area has ten items which are related to technological and IT issues. All items in this area are calculated as QoIT&T (Quality of IT&T item). The items may be changed or supplemented over the coming years and decades in accordance with changes and developments in the telecommunications and IT markets, as well as customer needs for various services.
The result of the mathematical equation for one of the items from the area is presented here. The billing system is one of the most important systems for a telecom operator. Billing systems face several important issues, one of which is the implementation of new changes regarding existing tariff models, tariff options, tariff groups and groups of tariffs. This last issue is crucial for assessing the potential of the telecom—the speed of response and action in terms of creating new and/or supplementing existing tariffs, groups, options and more.
The equation describing this item is as follows:
The CTE Model gives definitions for calculating RefT values and factors F values. Factors F values define the importance of all parts from the equations.
3.4. Business Level in the CTE Model
The second level in this model is the Business Level (BL). There are four areas: the “Products Development Area”, the “Services Development Area”, the “Sales and Customer Care Area” and the “Human Resources Area”.
3.4.1. Two Business Level Areas in CTE Model: Products Development and Services Development
The Products Development Area is best described as “creating and developing different types of tariff models, tariff options, groups of tariffs and/or tariff groups for different types of private, business, and/or public service customers”. The Services Development Area is best described as “creating and developing different types of service models for satisfying and meeting different customer needs for communication, entertainment, business or any other purpose”.
Products development items represent the quality of different tariff packages, tariff options, groups of tariffs and tariff groups. The emphasis will be on the access to the mobile Internet and on the offer of various new services. For this reason, these items will have to be analyzed from time to time, continuously monitored and changed according to the development of this market in the future. This article gives us an example of the equation “Pre-paid mobile tariff packages“, which is described by the following equation:
This equation consists of three parts, which explain the main segments for pre-paid customers: voice (minutes), SMSs and data traffic included in tariff model(s). The importance of these segments is defined by different factors F. The CTE model defines all important issues regarding referent values (Ref) and factor F values. This item will give results for pre-paid product potential in the analyzed telecom operator, but also indicates the possibility of, and gives guidelines for, improving the offer [64,65,66].
Another area on this level is the Services Development Area. Almost all items in this area will be based on new technologies, and this is the most important direction for all modern telecom operators. The items in this area will give us assessments of quality and mass of new services, as well as diversity of services in terms of different business areas (industry, medicine, cities, agriculture, etc.) which the telecom operators offer [67,68,69]. Appendix G gives us all the important explanations and equations of these items. In this article, we show one example of the item equation “IoT specialized services”.
The equation for “IoT specialized services” is as follows:
This equation shows that the top five “specialized IoT services” will be analyzed. After a detailed analysis and research, the actual top five specialized services are smart city services, smart home services, smart medicine services, smart agriculture services and smart energy services. These top 5 specialized services might be changed in the following months or years, and will be necessary to analyze and change this ranking. Factors F define the numerical value (percentage) of each of the specialized services. The CTE model defines all necessary information and inputs how to calculate QoIoTSSN and QoIoTRefSSN (N = 1 to 5).
3.4.2. “Sales and Customer Care” Area
This area and related items will analyze existing standard sales and customer care channels, as well as new sales and customer access channels. An example of an item regarding the “Quality of the distribution of outlets in the country” is presented by the following equation:
This equation is divided into five parts. These parts analyze different urban areas (UA1–UA4 and UAA). The CTE model defines all details and definitions related to the measurement and calculation of reference values and factors in this item. The value of this item gives us the value of the total quality of the distribution of points of sale. Also, its parts give us the quality of the distribution of points of sale according to individual urban areas.
3.4.3. “Human Resources (HR)” Area
Human Resources (HR) is a part of all companies in all business sectors. Human Resource Management (HRM) has many definitions [70,71,72]. HRM focuses on managing people at work or employees who make up an organization. Each company must establish goals for HRM. The main goals are as follows [73]: increasing the net assets of owners, enhancing employee development and satisfaction, maximizing customer satisfaction, achieving cooperate growth, increasing market share, fulfilling social responsibility, achieving financial stability and increasing the quality of products and services. According to another source [74], managerial functions of personnel management involve planning, organizing, directing and controlling (Table 3).
The CTE model gives us definitions and equations for all items in this area. This article gives us an example of the item “Quality of managers”. It is defined as:
The equation consists of three parts and defines the assessment of three levels of management: top, medium and low. The equation can have more components, but through the performed analysis, this distribution provides the optimal approach.
3.5. Environmental Level (EL)
The Environmental Level (EL) consists of six segments joined into two areas. The first area has an impact on telecoms, while the second area represents the impact of telecoms on the environment. This level completes the picture of the potential of a telecom with respect to interaction with the environment.
3.5.1. “Political, Financial, Law and Regulatory Issues” Area
The “Political, Financial, Law and Regulatory issues” area consists of four different segments. These segments have very strong relationships and mutual influences. This area defines the impact of these key external factors on the telecom business. The outputs of the area will show the resistance of telecom to the effects of its environment and its potential on the market. The CTE model defines all items in this area. The item equation “The potential of international business visits to the state” is as follows:
This equation analyzes business visitors and their activities in the telecom operator network. It has two separate parts: it analyzes the business visitor for “up to three days” (UTD) and “more than three days” (MTD). After conducting analyses, it was concluded that most business conferences and similar events last up to three days. Visitors to such events are generally larger and better consumers of telecom operators than business users who come to visit for more than three days. Factors F give us a description of the values for both items.
3.5.2. “Quality of Brand and Presence in the Publicity” Area
This area consists of two segments: “Quality of Brand” and “Presence in publicity”. Brand quality is defined as the recognition of the entire company quality (products, services, customer approaches, etc.), which has an influence on consumer purchasing behavior. Public presence is defined as the reach that a telecom has within the public and how publicity recognizes its activities. These two segments are well intertwined and are therefore placed in a common area.
Digital advertising has become crucial for the promotion of products and services, but also for building a telecom operator brand. The social network LinkedIn is the most important business network in the world. It has been set as one of the key items for presenting telecom operators to the public, with an emphasis on the business segment. The item “Quality of digital advertising—usage of LinkedIn” is presented by:
This equation has three different parts. It analyzes the number of followers, activities, positive comments and replies to comments by telecom operator administrators. The importance of these three parts is defined by different factors F.
4. Discussions and Verification of the CTE Model on the Example of the “Coverage and Accessibility to Users” Area
4.1. Discussion of the Model
In this part of the paper, the focus will be on the C&A area (TL), or, more precisely, on the first two items in the area. The goal is to prove the modularity of the model, i.e., to show how it is possible to use individual areas or only individual items independently of the overall model. The first two items in the mobile part of the C&A area are:
- Quality of access to mobile data in urban areas (outdoors)—MDUA;
- Quality of access to mobile data in special parts of urban areas—areas of mass gathering—MDMG.
A city of approximately 105,000 inhabitants will be taken as an example (the inner-city area has about 60,000 inhabitants) in a country with approximately 3.5 million inhabitants. According to this calculation, this city belongs to Urban Area 1. The inner-city area covers about 16 square kilometers. The observed telecoms, whose potential are in focus, operate in combination on 3G/3.75G/4G/4G+ mobile network standards. In the observed city, mostly 4G+ (LTE Advanced) mobile base stations have been installed. This is an important fact [75,76,77,78] for more easily and precisely defining the manner, number and location of mobile signal sampling.
For defining places, the method of taking samples, time of taking samples and the number of samples, it is necessary to consider these important facts: definition of the urban zone, number of inhabitants of the inhabited place, square footage of the inhabited place, generation of the mobile network and special rules defined for taking samples in the open space (outdoor) and in places involving the mass gathering of people [79,80,81,82].
A complete and comprehensive discussion, clarifications, necessary descriptions and critical analysis with a list of some of the literature used is provided in Appendix L.
4.2. Signal Meassurement Results for the Three Independent Mobile Telecom Operators
The results of measurements of download data rate, upload data rate and signal latency for three independent mobile telecom operators will be shown. Measurements will be carried out outdoors in the city center (approximately 1 km2) and within the largest shopping center in the city, which has three underground floors, a ground floor and four above-ground floors. Reference values for the potential evaluation for a first (universal) approach have already been defined in Appendix L. Reference values for a direct comparison (second approach) of three mobile operators will be the highest values of all samples for downloading and uploading, as well as the lowest value of all samples for the delay of signals. Table 4 and Table 5 show these values.
For the purposes of this paper, a short survey has been conducted among users. The question was asked: What do you need more for your business? The answers offered were DL speed and UL speed, both equally in terms of latency. The obtained results are shown in the Table 6 and will be used to define the F factor in the calculations of telecom potential for smart city services and to compare telecoms.
Factors F for the direct comparison of mobile telecoms for customers will be FDL = 20/(20 + 15) = 0.57, FUL = 15/(20 + 15) = 0.43 and FDEL = 0. These factors will be used for calculations of MDUA and MDMG items for telecom potential comparison.
Measured outdoor signal samples (used for calculating the MDUA item) for all three mobile operators show significant instability, i.e., signal, especially in DL and UL items, varying significantly. Signal latency samples for all three mobile operators are stable, and we note that the Second Mobile Operator (SMO) shows the best characteristics and has the lowest average value. Although the First Mobile Operator (FMO) has the best results for DL and UL values, this operator must change approach in coverage due to the huge deviations of signal samples. This statement is especially noted for UL signal patterns. FMO needs to increase the signal gain through a certain redirection of antennas and build several new base station locations for better coverage among high buildings near city centers. Of course, more detailed analyses are needed for more precise guidelines. The SMO and the TMO have to build several new base station locations for gaining a better signal, increasing the access transmission speed towards almost all the base stations and in parallel through a certain redirection of antennas, to increase the signal gain. Appendix M shows all graphs for these statements and better understanding regarding the presented results.
MDMG measured samples show several interesting conclusions. The measured samples were obtained by measuring in the largest sales center. On the underground floors, SMO and TMO had no signal and it was not possible to take samples while the samples for FMO had significantly high values and were stable. It is obvious that FMO has covered this area with several micro/pico base stations. SMO and TMO will have to cover these underground floors, as this represents a significant drawback for them. Average values for these operators were derived without these samples, but this was noted in the final analysis as a significant shortcoming.
The ground floor and four floors above ground are covered by the signal of all three operators. The FMO shows the best results, but it can be noticed that the signal samples of all three operators are quite unstable. It indicates the fact that the coverage is made through external base stations and that there are no micro and pico base stations inside the mall (or, alternatively, there is a negligible number).
Finally, MDUA and MDMG values will be calculated for both approaches. The final values will be shown in Table 7 and Table 8.
The measured and obtained results clearly indicate the fact that none of the observed three mobile operators is ready to provide and support more demanding IoT services. Parallel signal measurement was performed to the server (for FMO) within the city (average delay is 18.28 ms) and the result of MDUA + MDMG increases to 0.069. The maximum amount of each item is 0.1 (the sum of these items is 0.2), and it is clear that the FMO has some potential to provide a certain level of IoT services. The recommendation for all three operators is that it is necessary to significantly improve the quality of the network in the city, especially since the observed city is located in Urban Zone 1.
The measurement results show that the FMO has the best results. It should be noted that the FMO has a significant place for progress and that the coverage of both open and closed space needs to be improved through the addition of new locations in the city, but also through the determination of antenna redirection. TMO showed better results than SMO, but this difference is not significant. Both operators must greatly improve the quality of coverage in the outdoors, but especially indoors, because it is not acceptable that both operators do not have a signal in the underground area of the largest shopping center in the city. The analyses presented in this chapter show how the CTE model can be used modularly (by items and areas) and for the purposes of the comparison of mobile operators. This analysis confirms the robustness and modularity of the CTE model, as well as its effectiveness in order to obtain concrete proposals for the improvement of certain areas of operation of the operator.
5. Discussion and Verification of the Entire CTE Model
In this part of the paper, the use of the CTE model for estimating the potential of one telecom operator will be presented. The First Telecom Operator (FMO) will be taken as an example. Some of the data used in the analysis will be accurate and taken by measurement or otherwise (data from the official website), and yet some will be taken with certain approximations and assumptions because accurate data could not be obtained. However, ultimately, it is important to show how the CTE model works in practice.
5.1. Discussion of the Model
This chapter will show how to use the CTE model. There will be no going into the depth of the method of data collection, as well as a deeper analysis of the results, but a presentation of the obtained values will be given, and the overall result will be commented upon. Each result from the eight areas will be briefly explained (Appendix N) with regard to the observed telecom operator. Finally, the overall result will be presented and its significance will be commented upon. The CTE model serves for a quick qualitative and quantitative assessment of the potential of a particular telecom and as an aid in its making certain business and strategic decisions. The aim is to show and prove the hypotheses presented in this paper and to show how one model can help in making key strategic business decisions. For more details, please see Appendix N.
5.2. Total Value of Telecom Potential Obtained through CTE Model
Table 9 shows the total potential results of the observed telecoms obtained through the CTE model.
The total value that the CTE model can give for a telecom operator is eight (without the influence of feedback, and if they are positive, this amount may be higher). Considering the obtained result shown in Table 8, it is clear that the observed telecom has low potential. In addition to assessing potential, the CTE model also provides guidelines on how and in which direction a particular telecom should be developed. Each of the areas has a maximum value of 1 (noting that, theoretically, the value can be higher if it is an “ideal” telecom where an area has a value of 1, and with the use of feedback links or the implementation of Moderate Intelligence (AI), that area can have a value greater than 1).
Here, the method of reading the value of the area will not be presented in detail, as this would require deeper analysis and clarification, but the classification by category for each of the areas is briefly listed as follows:
- -
- from 0 to (inclusive) 0.25—insufficient quality value
- -
- from 0.25 to (inclusive) 0.5—satisfactory value
- -
- from 0.5 to (inclusive) 0.75—good value
- -
- from 0.75—to (including 0.9—a very good value
- -
- from 0.9 to 1 (or over 1)—an excellent value
According to the results in Table 8 and the previously defined distribution, this observed telecom should definitely develop and monitor new services, increase its impact in the digital environment and improve human resources activities, and we should definitely research ways to be less dependent on external influences on business.
The overall rating shown in Table 8 is approximately 30.85% of the total maximum value (without the effect of feedback and forward links on the result), which gives an overall satisfactory rating for the observed telecom, but, with a little effort, this rating can be much improved, and, with long-term action on certain areas of the rating, can be even further improved, which will definitely bring a positive shift in telecom business, meaning more revenue, gain and greater user satisfaction.
Of course, it is up to management to determine how and at what speed this will be done. In any case, this model provides an existing assessment of the potential, but also guidelines for the development and improvement of the observed telecom.
6. Conclusions
This paper presents a new model—the Comprehensive Techno-Economic (CTE) model—for the analysis of a telecom operator’s potential. The main reason for the development of such a model was primarily the lack of a unique, simple, modular, sufficiently precise model for analysing a telecom operator’s potential.
The lack of existing models for the analysis of telecom operators is clearly explained in the introduction of this paper and in the Appendix A, Appendix B, Appendix C, Appendix D, Appendix E, Appendix F, Appendix G, Appendix H, Appendix I, Appendix G, Appendix K, Appendix L, Appendix M, Appendix N, Appendix O, Appendix P. All analyzed frameworks and models give a partial view of telecom operators. The assessment of the potential is incomplete, the models are quite complex, and, in addition, most of them rely on a significant amount of subjectivism; they also depend much on who performs the analysis.
The CTE model consists of 14 pre-defined segments joined into eight areas. Each area/segment consists of predefined items defined by mathematical equations (or otherwise defined). It is clear that in some cases the area and segment are the same. Items in areas/segments are precisely defined with the remark that items over time and through the development of the ICT business segment need to be redefined, changed and improved.
The CTE model is flexible, robust and modular. Being modular means that it can be applied as a complete model for the analysis of the potential of telecom operators, but also only individual areas or only individual parts from certain areas can be used for analysis. Flexibility and robustness mean that this model can be used to compare two or more telecom operators but also to analyze the potential of a particular telecom operator for certain purposes (e.g., for the availability of smart city services to residents, business people and visitors, etc.).
This new model represents a novel approach for the modeling and assessing of the telecom operator’s potential. This paper presents the model and its application potential. Two use cases have been described. In the first, three telecoms were compared using only two items from one area, and in the second, an analysis of the potential of one telecom was conducted.
The first example compares multiple telecoms using only some parts of the model; two items in one area. The obtained results proved its modularity. It has also been shown that the model can be used for a quick analysis and comparison using certain assumptions and approximations.
Another example is to analyze the potential of a telecom. An analysis has been made according to area and without feedback. The aim was to show how a relatively simple and fast a quality assessment of the potential of a particular telecom operator can be obtained, as well as guidelines for further development.
Both hypotheses presented in the paper are proven in Section 3 and Section 4 in the paper, where it is shown how the model is used to assess telecom potential and how it can be used modularly. A comparison of three telecoms regarding certain items of the model is also shown (therefore, modularity is also shown). According to the results, the shortcomings and advantages of telecoms were determined, as well as what needs to be paid attention to in terms of improvement and maintaining or slightly increasing the quality of telecoms.
The two scientific contributions set out to be proven in the introduction are therefore satisfied:
- A new modular model, which is developed for telecom operators, will enable objective and precise optimization of certain key and strategic technological and business decisions. This is shown throughout the entire article, and the emphasis was in Section 4, where the analysis of the potential of a telecom is presented and concrete conclusions are drawn regarding certain business and technological decisions, with the aim of better positioning in the telecom market.
- By applying the model to individual areas or even items in these areas, it is possible to obtain concrete conclusions regarding development guidelines in certain business segments. In Section 3, it was shown how the model can be used to compare three telecoms, and from that analysis how precise conclusions can be drawn regarding better mobile signal coverage within an urban area.
In any case, the paper proved the need for such a model for the needs of better development of a certain telecom, and it was established that a similar model for a quick and high-quality assessment of telecom operators does not currently exist on the market.
The CTE model is a model that is set in its structure (levels, segments and areas that are composed of segments), but also in its items within areas that are certainly changeable. Their appearance and listing will certainly change as the telecommunications market develops, and not equally in all areas; the fastest changes will be in the areas of “Product Development”, “Service Development” and “Technological and IT Development”, while in some other areas these changes will be slower and less intense (e.g., HR development). The emphasis is on the fact that this model, although it has been completed in terms of analysis, is certainly a concerning matter and requires constant monitoring of the telecom market and industry, as well as its development and improvement.
Finally, the need for such a model has been proven. Also, its potential has been demonstrated, as well as the possibility of upgrading and further research.
Author Contributions
Writing—original draft, I.J. and S.G. All authors have read and agreed to the published version of the manuscript.
Funding
This research received no external funding.
Conflicts of Interest
The authors declare no conflict of interest.
Appendix A
eTOM (Enhanced Telecom Operations Map) Frameworks is a structural business process model that covers all aspects of the activities of service providers in the telecommunications segment. It is a set of documents that serves to create business processes “from end to end” in telecom operators. It serves as an assistance in creating business transformations. eTOM essentially enables the creation of better models for business processes in telecom operators [8,9,10,11,12,13,14,15,16,17].
The Sharing information and data model (SID) defines and explains the Shared Information/Data in the New Generation Operations Software and Systems (NGOSS) knowledge base. TM Forum is part of the NGOSS Program. It defines telecom modelling framework business processes and development of open and automated OSS/BSS systems. [18,19,20]
The Technology Acceptance Model (TAM), together with the Technology-Organization-Environment (TOE) model [10], is used to explore factors of building information modelling (BIM) adoption in the construction industry. This model can also analyze the substantial use of Internet technologies for training and learning purposes and focuses on building a user centric framework for e-learning technologies, incorporating the constructs of security, privacy and trust [21,23].
Another model that will be briefly presented is the Technological-Organizational-Environmental (T-O-E) framework model. The TOE framework proposes three main aspects to explore the factors that influence how an individual organization accepts innovations based on new technologies and their dimensions and characteristics. This model explains adoption and determination of Enterprise Resource Protocol (ERP) within the T-O-E framework [36].
The Training Needs Assessment (TNA) model creates and defines rules for Human Resources (HR) issues in any company [25]. HR issues will have to give answers (among others) to many key questions [26]:
- How to establish the objectives;
- How to review past and current training programs;
- How to analyze the job functions;
- How to categorize the types of training needs;
- How to design and implement the training needs survey;
- How to communicate the results to higher levels of management.
It will be also important to define [38]:
- Proactive Training Needs Analysis;
- Reactive Training Needs Analysis.
The survey [27] gives quality instructions, items and expectations. The most important recommendations and expectations from this survey [27] and another one [28] are:
- Training development;
- Training methods;
- Technical topics;
- Top Management/Leaderships topics;
- Learning Methods.
The IT Infrastructure Library (ITIL) framework is another framework that could be used as a base in this research. Authors of the article [30] research and analyze maturity level and smart city readiness by using the ITIL framework.
Business Analysis models analyze different segments in telecom operators. One of those segments involves price controls and defining margin rules [31]. The contribution of the article [32] provides insights into business model design, platform control and competitive strategy. Business models analyze interaction of the OTT business model and telecom operator [33]. It is interesting to see how competition and sustainable competitiveness in the business ecosystem affect the global telecommunications industry. The business analysis model can also serve that purpose [34]. The article illustrates an exploratory study of identifying business ecosystems. IT investments in telecom operators and their usability in business processes are often one of the key analyses in telecommunications [35].
The Cost Analysis Model is another type of analysis, often used in the telecommunications business segment. This model develops the mechanism of risk-adjusted scheduling and cost budgeting of research and development (R&D) projects in telecommunications [36]. It also analyzes customer satisfaction, switching intentions, perceived switching costs and perceived alternative attractiveness [37]. Paper [38] develops a case study for cost allocation for flex-grid optical networks. Churn prediction in the telecommunication sector is also one of the possible analyses conducted through cost analysis [39].
The Techno-Economic Model (TEM) can serve many different purposes of analysis. For example, TEM can analyze pure 5G network models but also make comparisons of the Cognitive Radio and Software Defined Network (SDN) in 5G mobile networks [41]. Techno-economic models define and develop business modeling of optical networks for Metropolitan Area Networks (MAN). The article [42] provides a techno-economic evaluation of optical disaggregation architectures in the context of metropolitan area networks.
Appendix A of this paper does not specifically analyze and list SWOT, PESTLE, Ansoff Matrix, Porter’s Five Forces and BCG Matrix Models because they have already been analyzed in the papers [2,3,4] prior to this one.
Appendix B
After the analysis of existing models, and especially the analysis of their shortcomings and disadvantages, the main inputs were defined for this new model. This new model has to be unique, comprehensive, robust, modular and as objective and accurate as possible in the calculation of outputs. In order for the model to satisfy these five previously mentioned inputs, it is necessary to divide it into several parts (modularity). The analysis of similar models revealed that the division consists of different levels for analysis, different entities of analysis, and also different items that may or may not be predefined. This often allows for a great deal of freedom in analysis and thus a great deal of subjectivity. Due to all the above facts, this model has chosen a multi-tased approach and segments that merge into predefined areas and pre-defined items within these areas/segments. Levels consist of areas that are predefined. Each area is composed of one or more segments and each segment has its own precisely defined items, which are described mathematically or in some other precise and unique way that removes subjectivity.
The analysis of different organizations of telecom operators and analysis of different models that can be used for analysis of telecom operators point to the fact that the main division of the internal factors of each telecom can be divided into technical and business parts. In addition, each telecom operator has certain interactions with the environment—telecom acts towards the environment, but the environment also acts and has an impact on telecoms. All these facts and conclusions lead to the first and basic division into the Comprehensive Techno-Economic Model (CTE).
Three segments were profiled at the technical level. First, the segment of technical accessibility to users (mobile and fixed access), then the technological level of company development and the IT level of company development. These three independent segments describe the technical level of the CTE model.
The second level in the CTE Model is the Business Level (BL). The Business Level is defined by the two key factors, products development and services development. Differentiation in terms of different products (tariffs, tariff model, tariff groups, tariff options…) and services (based on IoT, IIoT, OTT, etc.) will certainly be the most important analyses in terms of the potential of individual telecoms. In addition, sales and customer care are certainly important segments on this level because these segments are essentially crucial in the coming years. The care of human resources and the evaluation and promotion of staff is certainly a segment that needs to be especially valued.
The third level in the CTE model is the Environment Level (EL). At this level, the environmental impact on telecoms will be analyzed, as well as the telecom impacts to the environment. The detected segments which have influences to telecoms are political influence, financial (economic) influence, legal influence and regulatory influence. On the other hand, the brand quality of an individual telecom and public presence through advertising, sponsorships and other activities have been identified as segments that will have an impact on society and the environment.
Appendix C
It is possible that in the coming period and according to future development of the ICT market, the division of areas in the CTE model will be changed and each segment will be a separate area, or they will be joined on another way(s). However, at this time and the stage of development of the telecommunications market, this division (fourteen segments and eight areas) is detected as optimal for assessing the potential of telecom.
The segment “Coverage and accessibility to uses” is one area. Two segments “Technological Development” and “IT Development” are located in one area—Area of “IT and Technological Development”. The area “Coverage and Availability to users” has two logical parts—accessibility to users by fixed infrastructure and accessibility to users by mobile infrastructure.
Appendix D
It is very important to define what the terms “urban areas”, “rural areas”, “highways and main state roads” and “regional and local roads” mean for the “Coverage and Accessibility to users” area, but also for the whole CTE model. After the analysis of cities, towns and settlements in many countries with different populations [55,56,57,58], four levels have been defined with an additional level and with Urban Areas explanations:
- Urban Area 1 (multiplication sampling factor 4 compared to UA4): cities with more than 2% population of the total population in that country,
- Urban Area 2 (multiplication sampling factor 3 compared to UA4): cities over 1% and up to 2% population of the total population in that country,
- Urban Area 3 (multiplication sampling factor 2 compared to UA4): settlements/municipalities over 0.5% and up to 1% population of the total population in that country,
- Urban Area 4: settlements/municipalities over 0.1% and up to 0.5% population of the total population in that country,
- Urban Area A (multiplication sampling factor 4 compared to UA4): exceptions: economic, religious or touristic centers/settlements/municipalities that do not belong into the 1st or 2nd level of distribution.
The term “rural areas” means uninhabited areas and populated areas with less than 0.1% of the total population of that country. The terms “highways”, “main state roads” as well as “regional roads” and “local roads“ are defined in the states and this distribution is applied in this model as well [63,64,65].
The first item in the fixed part of this area (the sixth item in the area) refers to the fiber connectivity of populated places, that is, the distribution and connectivity of locations within the country. This item indicates the potential of an individual telecom considering the physical connection of collations in one country as a basis for faster and better expansion of telecoms in the territory of the country, i.e., better and better availability of most or all products and services offered by that telecom. This item is described by the following equation:
where is:
- QoFOSt—The quality of connection of urban areas with optical fiber systems (at the state level),
- NoUAx = The number of populated places of the UAx category that are connected to the telecommunications system of the observed telecom operator by optical fiber infrastructure (x = A, 1, 2, 3 and 4),
- MaxUAx = The maximum number of inhabited places from categories UAx in that country (x = A, 1, 2, 3 and 4),
- Fx = factors that indicate the importance of a particular category of populated places in that country (x = A, 1, 2, 3 and 4). The sum of these factors is one (1).
Factors F are calculated according to the size of the settlement (number of inhabitants), their economic importance, tourist potential, which means according to the potential that operator has in that area, considering the previously mentioned factors. So the factors F are calculated according to the following equation:
where is:
- NoInhUAx—The total sum of the population in each UAx (x = 1, 2, 3, 4 and A)
- NoInhState—The total population of that country,
- FInhx—Factor that describes the value of individual UAx for the potential of the telecommunications market ma (x 0 1, 2, 3, 4 and A),
- GDPUAx—The sum of gross domestic product that is collected in UAx areas,
- GDPState—Gross domestic product in the country,
- FBDP—A factor that describes the importance of the income of business users in the telecommunications market of that country,
- NoNTNUAx—Number of nights of foreign guests/tourists in UAx settlements (x = 1, 2, 3, 4 and A),
- NoNTNState—The total number of nights spent by foreign guests/tourists in the country,
- FRoam—The importance of roaming, that is, the income generated by foreign users in the country,
- FInh + FBDP + FRoam = 1.
The factors FInh, FGDP and FRoam are fixed and defined in advance depending on the indicators of their calculation and can be corrected on an annual basis. These factors represent the ratio of the financial value of the inhabitants’ segment, the GDP segment and the guest users’ segment to the total value of the telecommunications market and differ from country to country. According to the analyses carried out in B&H in 2021 (after the COVID-19 pandemic), the total factor values are FInh = 0.69, FGDP = 0.26 and FRoam = 0.05. The total sum of these three factors is one (1). The values of these factors are different in other countries, and if an analysis of the telecommunications market in those countries is carried out, it will be necessary to calculate them based on the available data.
The seventh item in this area (the second item of the fixed subsection) gives the value of the telecom operator’s potential with regard to accessibility to private users via fiber optic lines. In this item, the access speeds provided to users are not counted, but only the optical fiber infrastructure is analyzed. Internet access speeds (download/upload) can be increased simply by changing the terminal (end) equipment, but it is necessary to have a fiber-optic infrastructure that supports high Internet access speeds, and through such an infrastructure telecom can offer all new and advanced services to private users without speed restrictions transmission and signal delay.
Because of these reasons, this item analyzes only the availability provided by telecom to private users through the fiber optic infrastructure. The equation is simple to calculate:
where is:
- QoFTTH—Quality of connection of fiber optic infrastructure to homes (private users),
- NoFTTH—Number of households connected by fiber optic infrastructure (FTTH—Fiber to the Home),
- NoHOMES—The total number of households (estimate if there is no exact number) in the observed area—can be an analysis on the territory of one city, region or the entire country.
It is important to emphasize that when the development of this model started, this item was significantly different because it included the analysis of fiber optic infrastructure to buildings (FTTB) and to cabinets (FTTC—which were a link for several buildings or other facilities). As new services progress significantly (and users were reached by copper pair or coaxial cable, which is already a limitation for some advanced ICT services) and increasing demands are made for access bandwidth, these two items (FTTB and FTTC) were also deleted. From the equation, respectively, the factors F that defined their value have approached and equaled zero, and these parts are no longer taken into account during the calculation of this item. This fact indicates the rapid development of the ICT segment, but also shows how the CTE Model adapts to these changes.
The eighth item in this area (the third item in the part of the area that analyzes access to users with fixed technologies) is “Quality of realization of fiber optic connections to factories, business facilities, incubators, etc.—FTTBus (Fiber to the Business)”. The potential of an individual telecom is analyzed with regard to the fiber optic infrastructure to business entities, i.e., to business users. The appearance of this equation is:
where is:
- QoFTTBus—The quality of fiber-optic infrastructure to business entities, that is, the connection of business users with fiber-optic infrastructure,
- KA/LA—”Key Accounts/Large Accounts“—Label for large and key business users,
- SME—”Small and Medium Enterprises“—Label for medium and small business users,
- BI—”Business Incubator“—Label for business incubators for small users and start-up companies,
- NoFTTBusKA/LA—The number of facilities of business users from the category “large and key business users” whose facilities are connected by fiber optic infrastructure,
- NoBusKA/LA—Total number of facilities of business users from the category “large and key business users”,
- NoFTTBusSME—The number of facilities of business users from the category “medium and small business users” whose facilities are connected by fiber optic infrastructure,
- NoBusSME—Total number of facilities of business users from the category “medium and small business users”,
- NoFTTBusBI—The number of facilities of business incubators for small users and start-up companies whose facilities are connected by fiber optic infrastructure,
- NoBusBI—Total number of business incubators for small companies and start-up companies,
- FKA/LA—The factor that determines the importance of the KA/LA segment,
- FSME—A factor that determines the importance of the SME segment,
- FBI—The factor that determines the importance of the BI segment,
- FKA/LA + FSME + FBI = 1.
By analyzing the category of business users in several telecom operators, a division was obtained into large and key users, medium and small business users, and very small and start-up business users. Clearly, this division could be more complicated, but considering the analyses carried out and the approach to users, this is a basic and quite sufficient division, which is very good for this analysis, and which provides a quick and high-quality assessment of the potential regarding this business segment.
Factors F, whose total sum is one, define the importance of each of the items in the equation. These factors are defined so that their amount is defined according to the financial value of each segment from the equation. The calculation of the factor is simple: data on the financial value and revenues that make up the business segment and revenues by individual items (three defined items) are required. For example, if the total market value of business users is HRK 100,000,000 and the KA/LA segment is HRK 45,000,000, then the FKA/LA factor is 45,000,000/100,000,000, i.e., 0.45. When calculating these factors, the value of the brands of individual companies from individual segments and some other items that define business users (such as social sensitivity in society and the like) could be taken, but this significantly complicates and prolongs the calculation of these factors, but also allows for an increase in subjectivity, which is not the goal; the goal is to have a simple model for quick but high-quality assessment of potential and reduction of subjectivity in the calculation.
The ninth item (fourth in the fixed part of access) is the item “Shortening the local loop—percentage of the number of households (houses, apartments, cottages, small and medium-sized enterprises) that are less than 500 m from the last telecommunications connection point (RSS)—an item that refers to the efficiency of the copper network”. The limit of 500 m of distance is defined because it is the limit that is acceptable for the implementation of SVDSL technology, which enables (theoretical) download speeds of up to 300 Mb/s, which can significantly replace the construction of fiber optic infrastructure, noting that this item will already be implemented in this decade replace with another item related to fiber optic infrastructure.
The equation that describes this item is:
where:
- QoCPN—Copper pair network quality,
- NoCPN0.5—The number of buildings (apartments, houses, cottages, small companies, business premises, etc.) that are connected by a high-quality copper pair whose distance is less than 500 m from the last hub of the telecom operator and whose quality supports data transfer speeds (minimum) 150/50 Mb/s (d/u),
- NoPr/Bus—The total number of buildings (apartments, houses, cottages, business premises, …) that are not connected to fiber optic infrastructure but only to copper coins or do not have any telecommunications connection.
This item currently exists in this model because it shows the usability of the copper infrastructure and the adaptability of telecoms to its use. What is important to emphasize is the fact that (probably) in this decade, with the development of new advanced services, there will be an increase in the need for end-user access to the Internet, and this item will be deleted from the model. As a result, this item will be replaced with another item—which item will be determined by the analysis of new available technologies and services based on them.
The tenth item in this area (the fifth item of the fixed part of the area) is “Quality of protection of the primary transmission system and all transmission systems up to the end points in the event of failures of the entire system or its part”. Each telecom operator should strive for independence in terms of the main transmission routes, i.e., it should have its own optical fiber transmission connections (links) to the final destinations. Each lease of certain links from other users leads to a certain dependence, which therefore reduces the potential of the observed telecom because it cannot fully influence (guarantee quality) the quality of services to end users. Therefore, it would be necessary to have all the main transmission connections owned by a particular telecom, so that one’s own services could be offered to end users while guaranteeing maximum quality. This is defined and analyzed through the sixth paragraph of this area. But in addition, it is necessary to have a reserve, i.e., a reserve connection or “transmission path protection”.
When looking at the operations of one telecom, the only acceptable protections for the main transmission routes are “one plus one” and “one to one”. In addition, in the event of a failure on the primary transmission path, the system reaction, i.e., switching traffic from the primary to the protective transmission path, must be less than 50 ms. These two transmission path protections are acceptable for modern telecom operators, and the main difference between them will be given in the rest of the text.
“One plus one” protection implies such an approach that the same traffic is sent via the primary and secondary (protection) path, and a higher quality, i.e., a better sample of the traffic signal is taken at the output. This practically means that parallel traffic takes place and that in case of failure of one of the transmission paths, the traffic proceeds smoothly via the other transmission path. So, the “50 ms” condition is met.
One-to-one protection of the primary transmission path implies that the protection path has the same capacity as the primary transmission path, and in the event of a failure of the primary transmission path, the backup transmission path (connection) takes over all traffic. Here it is necessary to monitor whether the “50 ms” condition is met. While the primary transmission path is in operation, other lower priority traffic can be sent over the protective transmission path (traffic that sends data that is not sensitive to transmission delay), so that the transmission path is not unused and in case of failure of the primary path, this traffic is suspended and all traffic from the primary transmission route is taken over.
This item is described by the following equation:
where:
- NoUAx = The number of populated places of the UAx category that are connected by fiber-optic infrastructure to the telecommunications system of the observed telecom operator (x = A, 1, 2, 3 and 4) and according to them there is protection of the primary path “1 + 1” or “1 to 1” and with the system reaction condition of a maximum of 50 ms,
- MaxUAx = Total number of inhabited places from categories UAx in that country (x = A, 1, 2, 3 and 4),
- Fx = Factors that indicate the importance of a particular category of populated places in that country (x = A, 1, 2, 3 and 4). The sum of these factors is one (1).
Factors F are calculated in the same way as in item six. So, they are calculated according to the size of the settlement (number of inhabitants), their economic importance, tourist potential, which means according to the potential that operator has in that area, considering the previously mentioned factors. Factors F are calculated according to the following equation:
where:
- NoInhUAx—The total sum of the population in each UAx (x = 1, 2, 3, 4 and A)
- NoInhState—The total population of the country,
- FInhx—Factor that describes the value of individual UAx for the potential of the telecommunications market (x 0 1, 2, 3, 4 and A),
- GDPUAx—The sum of gross social product that is made in UAx environments,
- GDPState—Gross domestic product in the country,
- FGDP—A factor that describes the importance (income) of business users in the telecommunications market of that country,
- NoNTNUAx—Number of nights of foreign guests/tourists in UAx settlements (x = 1, 2, 3, 4 and A),
- NoNTNState—The total number of nights spent by foreign guests/tourists in the country,
- FRoam—The importance of roaming, that is, the income generated by foreign users in the country,
- FInh + FBDP + FRoam = 1.
The items that have been described and defined by mathematical equations in a unique way give the value of the quality and potential that the observed telecom operator has and shows the current situation, but also provides guidelines for the development of the telecom and thus for increasing its business potential.
The maximum value of this field is one. It should be noted that over time certain items will be changed or supplemented, and some will disappear, and others will take their place. All this depends on the development of the telecommunications market. For example, if such a model had existed at the end of the last century, there probably would not have been any items for the mobile part of accessibility to users in this area, or possibly that part would have been described with one or two items, while everything else would have belonged to the fixed (non-mobile) part of telecom services. Also, in ten years, it is not impossible that out of all the analyzed items, one or two will remain from the fixed part, while all the others will be from the part of mobile communications and accessibility to users. This means that with the development of telecommunications, the items that describe access to users are also changing. The telecommunications segment is undergoing significant changes, so in this model, all items would change or be significantly adapted to changes for a period of some 35-40 years [83,84,85,86,87,88,89].
This appendix shows how the CTE model will describe all the essential details for its implementation and application. In the following appendices, the equations and the items for those equations will be given without a detailed description of the entire areas of the model as this would take up too much space. However, it is important to emphasize that the final version of the CTE model provides all equations, descriptions of parts of the equation, as well as a description of the application and collection of input data in order to assess the potential of telecom operators.
Appendix E
Quality of the switching system, QoSS,
where:
- QoSSS—The quality of the switching system,
- SuccCallsPeak—Successfully established and maintained calls (until the end of the duration) during peak load times,
- AllInCallsPeak—All initiated calls during peak load times,
- FCalls—A factor that describes the importance of calls in the operator’s overall business,
- SuccRTVidPeak—Successfully established and maintained (to completion) video calls and live video streaming during peak load times,
- AllRTVidePeak—All video calls and live video streaming of events at peak times,
- FVideo—A factor that describes the importance of direct video calls and direct video transmission for the telecom operator’s business.
Quality of the billing system, QoBS,
where:
- QoSBS—The Quality of the billing system,
- RefTTM—Reference (optimal) time for commercialization of new tariff models—from obtaining details from Product Development to commercialization for end users,
- MaxTTM—The maximum time it took to create a specific tariff model on the billing system of the analyzed telecom operator,
- FTM—A factor that defines the importance of the time of creation and commercialization of tariff models on the billing system,
- RefTGTM—Reference (optimal) time for commercialization of new groups of tariff models and tariff groups—from obtaining details from Product Development to commercialization for end users,
- MaxTGTM—The maximum time it took to create a specific group of tariff models or tariff groups on the billing system of the analyzed telecom operator,
- FTM—A factor that defines the importance of the time of creation and commercialization of a group of tariff models and tariff groups on the billing system,
- RefTET—Reference (optimal) time for redefining (supplementing or changing) existing tariff models, groups of tariff models or tariff groups—from obtaining details from Product Development to the end of the process and commercialization,
- MaxTEM—Maximum time for redefining (supplementing or changing) existing tariff models, groups of tariff models or tariff groups—from obtaining details from Product Development to the end of the process and commercialization,
- FEM—A factor that defines the importance of time for redefining (supplementing or changing) existing tariff models, groups of tariff models or tariff groups.
Quality of obtaining reports from databases, QoDWh,
where:
- QoDWh—Quality of obtaining reports from databases,
- PDR—Pre-Defined Reports,
- AHR—Ad Hoc Reports,
- RefTPDR—Reference set time for execution of predefined reports,
- MaxTPDR—Maximum time for running predefined reports,
- FPDR—A factor that indicates the importance of predefined reports for the regular business of the company,
- RefTAHR—Reference set time for execution of ad hoc reports,
- MaxTPDR—Maximum time for running ad hoc reports,
- FPDR—A factor that indicates the importance of pad hoc reports for the regular business of the company,
- FPDR + FAHR = 1.
Quality of Self-care portal(s) for users, QoSSCP
where:
- QoSSCP—The Quality of Self-care portal(s) for users,
- NC—New Contracts,
- EC—Existing Contracts,
- Rep—Reports,
- TehInf—Tehnical Information,
- Adv—Advertising,
- RefTx—Reference estimated time to obtain feedback,
- MaxTx—Maximum time to obtain feedback from telecom’s self-care portal(s),
- Fx—A factor that defines the importance of obtaining certain information for user,
- Sumx(Fx) = 1.
Quality of transmission system technologies, QoSTS,
where:
- QoSTS—Quality of transmission system technologies,
- SuccCallsPeak—Successfully established and maintained calls (until the end of the duration) during peak load times,
- AllInCallsPeak—All initiated calls during peak load times,
- FCalls—A factor that describes the importance of calls in the operator’s overall business,
- SuccRTVidPeak—Successfully established and maintained (to completion) video calls and live video streaming during peak load times,
- AllRTVidePeak—All video calls and live video streaming of events at peak times,
- FVideo—A factor that describes the importance of direct video calls and direct video transmission for the telecom operator’s business.
- The difference between QoSSS and QoSTS is in defining the list of calls and RT video transmissions… in QoSTS, calls and RT Video from external servers and calls outside the switching hub must be defined.
Quality of mass IoT service offerings, QoSPIoTMass
where:
- QoSPIoTMass—The quality of mass IoT service offerings,
- CPlat—Platform capacity considering the total number of telecom users,
- RefCPlat—Referent value of Platform capacity considering the total number of telecom users,
- PES—Platform Expansion Speed—Platform expansion speed (timescale),
- TPES—Time of Platform capacity expansion speed for telecom operator,
- RefTPES—Referent value of Time of Platform capacity expansion speed for telecom operator,
- SP—Service Provider
Quality of B2C IoT service offerings, QoSPIoTB2C
where:
- QoSPIoTB2C—The quality of B2C IoT service offerings
- CPlat—Platform capacity considering the total number of telecom users,
- RefCPlat—Referent value of Platform capacity considering the total number of telecom users,
- PES—Platform Expansion Speed—Platform expansion speed (timescale),
- TPES—Time of Platform capacity expansion speed for telecom operator,
- RefTPES—Referent value of Time of Platform capacity expansion speed for telecom operator,
- SP—Service Provider.
Quality of IIoT service offerings
where:
- QoSPIIoT—The quality of IIoT service offerings
- CPlat—Platform capacity considering the total number of telecom users,
- RefCPlat—Referent value of Platform capacity considering the total number of telecom users,
- PES—Platform Expansion Speed—Platform expansion speed (timescale),
- TPES—Time of Platform capacity expansion speed for telecom operator,
- RefTPES—Referent value of Time of Platform capacity expansion speed for telecom operator,
- SP—Service Provider.
OTT service provider
where:
- QoSP—The quality of OTT service offerings
- CPlat—Platform capacity considering the total number of telecom users,
- RefCPlat—Referent value of Platform capacity considering the total number of telecom users,
- PES—Platform Expansion Speed—Platform expansion speed (timescale),
- TPES—Time of Platform capacity expansion speed for telecom operator,
- RefTPES—Referent value of Time of Platform capacity expansion speed for telecom operator,
- SP—Service Provider.
Quality of Cloud Service Center
where:
- QoSCCS—The Quality of Cloud Service Center,
- TSP—Ttime of response,
- RefTSP—Reference response time,
- FSP—A factor that defines the response time of the server,
- TEoC—Reaction time to the request to expand or reduce the scope of the service (Easy of Collaboration),
- RefTEoC—Reference reaction time to the request to expand or reduce the scope of the service (Easy of Collaboration),
- FEoC—A factor that shows the importance of the response time item with regard to expanding or reducing the scope of services,
Appendix F
Quality of Post-Paid mobile tariff packages for private users,
where:
- QoTMPoPPrivate—Quality of Post-Paid mobile tariff packages for private users,
- QoDMO—Quality of data offer within tariff models,
- QoDRef—Reference Quality of data offer within tariff models,
- FData—The factor that defines the importance of the data offer in PoP tariffs for private users,
- QoVMO—Quality of voice offer within tariff models,
- QoVRef—Reference Quality of voice offer within tariff models,
- FVoice—The factor that defines the importance of the voice offer in PoP tariffs for private users,
- QoSMO—Quality of SMS offer within tariff models,
- QoSRef—Reference Quality of SMS offer within tariff models,
- FSMS—The factor that defines the importance of the SMS offer in PoP tariffs for private users,
- FData + FVoice + FSMS = 1.
Quality of Post-Paid mobile tariff packages for business users,
where:
- QoTMPoPPrivate—Quality of Post-Paid mobile tariff packages for business users,
- QoDMO—Quality of data offer within tariff models,
- QoDRef—Reference Quality of data offer within tariff models,
- FData—The factor that defines the importance of the data offer in PoP tariffs for business users,
- QoVMO—Quality of voice offer within tariff models,
- QoVRef—Reference Quality of voice offer within tariff models,
- FVoice—The factor that defines the importance of the voice offer in PoP tariffs for business users,
- QoSMO—Quality of SMS offer within tariff models,
- QoSRef—Reference Quality of SMS offer within tariff models,
- FSMS—The factor that defines the importance of the SMS offer in PoP tariffs for business users,
- FData + FVoice + FSMS = 1.
Pre-Paid mobilni tarifni paketi,
where:
- QoTMPrePaid—Quality of Pre-Paid mobile tariff packages,
- QoDMO—Quality of data offer within tariff models,
- QoDRef—Reference Quality of data offer within tariff models,
- FData—The factor that defines the importance of the data offer in PoP tariffs for business users,
- QoVMO—Quality of voice offer within tariff models,
- QoVRef—Reference Quality of voice offer within tariff models,
- FVoice—The factor that defines the importance of the voice offer in PrP tariffs,
- QoSMO—Quality of SMS offer within tariff models,
- QoSRef—Reference Quality of SMS offer within tariff models,
- FSMS—The factor that defines the importance of the SMS offer in PrP tariffs,
- FData + FVoice + FSMS = 1.
Quality of Post-Paid mobile tariff group packages for private users, QoTMPoPPrivGr
where:
- QoTMPoPPrivaGr—Quality of Post-Paid mobile tariff group packages for private users,
- QoDMO—Quality of data offer within tariff models,
- QoDRef—Reference Quality of data offer within tariff models,
- FData—The factor that defines the importance of the data offer in PoP tariffs for private users,
- QoVMO—Quality of voice offer within tariff models,
- QoVRef—Reference Quality of voice offer within tariff models,
- FVoice—The factor that defines the importance of the voice offer in PoP tariffs for private users,
- QoSMO—Quality of SMS offer within tariff models,
- QoSRef—Reference Quality of SMS offer within tariff models,
- FSMS—The factor that defines the importance of the SMS offer in PoP tariffs for private users,
- FData + FVoice + FSMS = 1.
Quality of Post-Paid mobile tariff group packages for business users, QoTMPoPBusGr
where:
- QoTMPoPBusGr—Quality of Post-Paid mobile tariff group packages for business users,
- QoDMO—Quality of data offer within tariff models,
- QoDRef—Reference Quality of data offer within tariff models,
- FData—The factor that defines the importance of the data offer in PoP tariffs for business users,
- QoVMO—Quality of voice offer within tariff models,
- QoVRef—Reference Quality of voice offer within tariff models,
- FVoice—The factor that defines the importance of the voice offer in PoP tariffs for business users,
- QoSMO—Quality of SMS offer within tariff models,
- QoSRef—Reference Quality of SMS offer within tariff models,
- FSMS—The factor that defines the importance of the SMS offer in PoP tariffs for business users,
- FData + FVoice + FSMS = 1.
Quality of Tariff models for fixed Internet access and TV service for private users
where:
- QoTMPrivINT&TV—Quality of Tariff models for fixed Internet access and TV service for private users,
- QoxDSLTO—Quality of xDSL offer within tariff models,
- QoxDSLRef—Reference Quality of xDSL offer within tariff models,
- FxDSL—The factor that defines the importance of the xDSL offer for private users,
- QoFTTHTO—Quality of FTTH offer within tariff models,
- QoFTTHRef—Reference Quality of FTTH offer within tariff models,
- FFTTH—The factor that defines the importance of the FTTH offer in tariffs for private users,
- QoTVTO—Quality of TV tariff offer within tariff models,
- QoTVRef—Reference Quality of TV tariff offer within tariff models,
- FTV—The factor that defines the importance of the TV tariff offer in tariffs for private users,
- FaDSL + FFTTH + FTV = 1.
Quality of Tariff models for fixed Internet access and TV service for business users
where:
- QoTMBusINT&TV—Quality of Tariff models for fixed Internet access and TV service for business users,
- QoxDSLTO—Quality of xDSL offer within tariff models,
- QoxDSLRef—Reference Quality of xDSL offer within tariff models,
- FxDSL—The factor that defines the importance of the xDSL offer for business users,
- QoFTTBusTO—Quality of FTTBus offer within tariff models,
- QoFTTBusRef—Reference Quality of FTTBus offer within tariff models,
- FFTTBus—The factor that defines the importance of the FTTBus offer in tariffs,
- QoTVTO—Quality of TV tariff offer within tariff models,
- QoTVRef—Reference Quality of TV tariff offer within tariff models,
- FTV—The factor that defines the importance of the TV tariff offer in tariffs for business users,
- FaDSL + FFTTBus + FTV = 1.
Quality of Tariffs and options for IoT/IIoT services
where:
- QoTMIoT/IIoT—Quality of IoT/IIoT Tariff models and options,
- QoIoTTOMass—Quality of IoT offer for massive services within tariff models,
- QoIoTMassRef—Reference Quality of IoT offer for massive services within tariff models,
- FIoTMass—The factor that defines the importance of the IoT offer for massive usage,
- QoIoTTOB2C—Quality of IoT offer within tariff models for private users,
- QoIoTRefB2C—Reference Quality of FTTBus offer within tariff models,
- FFTTBus—The factor that defines the importance of the FTTBus offer in tariffs,
- QoTVTO—Quality of TV tariff offer within tariff models,
- QoTVRef—Reference Quality of TV tariff offer within tariff models,
- FTV—The factor that defines the importance of the TV tariff offer in tariffs for business users,
- FaDSL + FFTTBus + FTV =
Quality of Tariffs and options for OTT services
where:
- QoTMOTT—Quality of OTT Tariff models and options,
- QoOTTVoice—Quality of OTT offer for voice services within tariff models,
- QoOTTVVoiceRef—Quality of OTT reference offer for voice services within tariff models,
- FVoice—The factor that defines the importance of the OTT Voice offer,
- QoOTTTV—Quality of OTT offer for TV services within tariff models,
- QoOTTTVRef—Quality of OTT reference offer for TV services within tariff models,
- FTV—The factor that defines the importance of the TV offer in tariffs,
- QoOTTVideo—Quality of OTT offer for video services within tariff models,
- QoOTTVVideoRef—Quality of OTT reference offer for video services within tariff models,
- FVideo—The factor that defines the importance of the video tariff offer in tariffs,
- FVoice + FTV + FVideo = 1.
Quality of tariffs for IaaS, PaaS, SaaS services.
where:
- QoTMXaaS—Quality of XaaS Tariff models and options,
- QoIaaSMO—Quality of IaaS offer within tariff models,
- QoIaaSRef—Quality of IaaS reference offer within tariff models,
- FIaaS—The factor that defines the importance of the IaaS offer,
- QoPaaSMO—Quality of PaaS offer within tariff models,
- QoPaaSRef—Quality of PaaS reference offer within tariff models,
- FPaaS—The factor that defines the importance of the IaaS offer,
- QoSaaSMO—Quality of SaaS offer within tariff models,
- QoSaaSRef—Quality of SaaS reference offer within tariff models,
- FSaaS—The factor that defines the importance of the IaaS offer,
- FIaaS + FPaaS + FSaaS = 1.
Appendix G
Internet of Things (IoT) Mass Market Services,
where:
- QoSIoTMass—Internet of Things (IoT) Mass Market, Services,
- NoS—Number of Services,
- NoSSC—Number of services from the “Smart City” segment offered by telecom,
- NoSSCRef—Defined reference services from the “Smart City” segment,
- FSC—A factor that describes the importance of services from the “Smart City” segment,
- NoSST—Number of services from the “Smart Traffic” segment offered by telecom,
- NoSSTRef—Defined reference services from the “Smart Traffic” segment,
- FST—A factor that describes the importance of services from the “Smart Traffic” segment,
- NoSSSM—Number of services from the “Smart Shopping Mall” segment offered by telecom,
- NoSSSMRef—Defined reference services from the “Smart Shopping Mall” segment,
- FSSM—A factor that describes the importance of services from the “Smart Shopping Mall” segment,
- NoSSIS—Number of services from the “Smart Information Services” segment offered by telecom,
- NoSSISRef—Defined reference services from the “Smart Information Services” segment,
- FSIS—A factor that describes the importance of services from the “Smart Information Services” segment,
- NoSSTS—Number of services from the “Smart Tourism Services” segment offered by telecom,
- NoSSTSRef—Defined reference services from the “Smart Tourism Services” segment,
- FSTS—A factor that describes the importance of services from the “Smart Tourism Services” segment,
- SC—Smart City
- ST—Smart Traffic
- SSM—Smart Shopping Malls
- SIS—Smart Information Services
- STS—Smart Tourism Services
Specialized IoT services for private users (B2C)
where:
- QoSIoTB2C—Specialized IoT services for private users (B2C),
- NoS—Number of Services,
- NoSSH—Number of services from the “Smart Home (and Building)” segment offered by telecom,
- NoSSHRef—Defined reference services from the “Smart Home (and Building)” segment,
- FSH—A factor that describes the importance of services from the “Smart Home (and Building)” segment,
- NoSSHC—Number of services from the “Smart HealthCare/and Fitness)” segment offered by telecom,
- NoSSHCRef—Defined reference services from the “Smart HealthCare (and Fitness)” segment,
- FSHC—A factor that describes the importance of services from the “Smart HealthCare (and Fitness)” segment,
- NoSSEd—Number of services from the “Smart Education” segment offered by telecom,
- NoSSEdRef—Defined reference services from the “Smart Education” segment,
- FSEd—A factor that describes the importance of services from the “Smart Education” segment,
- SH—Smart Homes (and Buildings)
- SHC—Smart HealthCare (and Fitness)
- SEd—Smart Education
Business Internet of Things (B2B; BIoT) services,
where:
- QoSBIoT—Business Internet of Things (B2B; BIoT) services,
- BIoT—Business Internet of Things
- NoS—Number of Services
- NoSSA—Number of services from the “Smart Agriculture” segment offered by telecom,
- NoSSARef—Defined reference services from the “Smart Agriculture” segment,
- FSA—A factor that describes the importance of services from the “Smart Agriculture” segment,
- NoSSV—Number of services from the “Smart Vehicle” segment offered by telecom,
- NoSSVRef—Defined reference services from the “Smart Vehicle” segment,
- FSV—A factor that describes the importance of services from the “Smart Vehicle” segment,
- NoSSF—Number of services from the “Smart Factory” segment offered by telecom,
- NoSSFRef—Defined reference services from the “Smart Factory” segment,
- FSF—A factor that describes the importance of services from the “Smart Factory” segment,
- NoSSE—Number of services from the “Smart Energy” segment offered by telecom,
- NoSSERef—Defined reference services from the “Smart Energy” segment,
- FSE—A factor that describes the importance of services from the “Smart Energy” segment,
- NoSSEM—Number of services from the “Smart Environmental Monitoring” segment offered by telecom,
- NoSSEMRef—Defined reference services from the “Smart Environmental Monitoring” segment,
- FSEM—A factor that describes the importance of services from the “Smart Environmental Monitoring” segment,
- SA—Smart Agriculture
- SV—Smart (Connected) Vehicles
- SF—Smart Factories
- SE—Smart Energy (Smart Grids)
- SEM—Smart Environmental Monitoring
Quality of OTT video service,
where:
- QoSOTTVideo—Quality of OTT video service,
- QoSTVtg—Quality of “TV to go” service,
- QoSTVtgRef—Reference value of Quality of “TV to go” service,
- QoSVoD—Quality of “Video on demand” service,
- QoSVoDRef—Reference value of Quality of “Video on Demand” service
- QoSMVL—Quality of “Movie Video Library” service,
- QoSMVLRef—Reference value of Quality of “Movie Video Library” service
- QoSMuVL—Quality of “Music Video Library” service,
- QoSMuVLRef—Reference value of Quality of “Music Video Library” service
- TVtg—TV to go
- VoD—Video on Demand
- MVL—Movie Video Library
- MuVL—Music Video Library
Quality of OTT service for calls and messages,
where:
- QoSOTTVV&M—Quality of OTT service for calls and messages,
- QoSVC—Quality of “Video Call” service,
- QoSVCRef—Reference value of Quality of “Video Call” service
- QoSVoi—Quality of “Voice Call” service,
- QoSVoiRef—Reference value of Quality of “Voice Call” service
- QoSMess—Quality of “Message” service,
- QoSMessRef—Reference value of Quality of “Message” service
- VC—Video Call
- Voi—Voice
- Mess—Messages
Software as a Service (SaaS),
where:
- QoSSaaS—Quality of Software as a Service (SaaS) offer,
- NoSSaaS—Number of “SaaS” offer,
- NoSSaaSRef– Reference list and number of “SaaS” offer.
Platform as a Service (PaaS)
where:
- QoSPaaS—Quality of Platform as a Service (PaaS) offer,
- NoSPaaS—Number of “PaaS” offer,
- NoSPaaSRef– Reference list and number of “PaaS” offer.
Infrastructure as a Service (IaaS),
where:
- QoSIaaS—Quality of Infrastructure as a Service (PaaS) offer,
- NoSIaaS—Number of “IaaS” offer,
- NoSIaaSRef– Reference list and number of “IaaS” offer.
Anything as a Service (XaaS)
where:
- QoSXaaS—Quality of Anything as a Service (XaaS) offer,
- NoSXaaS—Number of “XaaS” offer,
- NoSXaaSRef– Reference list and number of “XaaS” offer.
Combined advanced services,
For all the items analyzed in this supplement, it is possible to increase the amount obtained if AI applications are applied to improve and increase the value of the user experience.
Appendix H
The quality of distribution of sales centers in the country
where:
- QoSP—The quality of distribution of sales centers in the country
- QoSPUAx—Quality of Sales Points distribution for UAx level of settlements,
- QoSPUAxRef—Reference Quality of Sales Points distribution for UAx level of settlements,
- FUAx—Factor that describes importance of UAx level.
The quality of distribution of sales representatives and partners in the country
where:
- QoSRP—The quality of distribution of sales representatives and partners in the country
- QoSRPUAx—Quality of Sales Representatives and Partners distribution for UAx level of settlements,
- QoSPUAxRef—Reference Quality of Sales Partners and Representatives distribution for UAx level of settlements,
- FUAx—Factor that describes importance of UAx level.
Quality of sales and customer care staff,
where:
- RSCC/I—Ratio between Sales and Customer Care Stuff and Population in the county—the ratio of staff to the number of users and/or residents in the country—valid for the case R < RRef. For the case R > RRef, it is assumed that R = RRef, but a negative feedback loop is sent to the HR area due to the excessive number of employees.
- QoSCCHS—High School—Staff qualifications—highly educated staff in relation to the number of employees in SCC area,
- QoESCC—Quality of education of SCC staff—Number of certified courses completed by staff in relation to the number of SCC staff in the last year—level of courses with exam passing and relevant “school” or “training center”
- QoSCCFL—Number of staff fluent in at least one world language compared to the number employed in SCC,
- RefR and RefQ—They indicate the reference values for the components of the transition item,
- F—a factor that indicates the value of an individual component of this item.
Quality of B2C on-line sales,
where:
- QoB2COLS—The quality of B2C on-line sales,
- QoNC—Quality of New Contract realization,
- RefQoNC—Reference Quality of New Contract Realization,
- FNC—Factor that defines importance of New Contract realization,
- QoEEC—The quality of Extension of Existing Contract realization,
- RefQoEEC—Reference Quality of Extension of Existing Contract realization,
- FEEC—Factor that defines importance of Extension of Existing Contract Realization,
- NC—New Contract
- EEC—Extension of Existing Contract
- Possibility and quality of contract extension (delivery to the address)
- Possibility and quality of signing a new contract (delivery to the address)
- The time of realization and delivery of the potential device (HW) to the user’s business address is analyzed—that is, the time from the conclusion of the NC or EEC to the end of the realization.
Quality of B2C on-line customer care and customer support,
where:
- PoCI—Percentage of Correct Information—Percentage of obtaining accurate and specific information in a short (defined) time,
- PoTPS—Percentage of Technical Problem Solutions—Percentage of solving technical problems on-line,
- PoOPS—Percentage of Other Problem Solutions—The percentage of solving other problems (complaints/appeals and similar),
- RefPoXY—Reference values for these parts of item,
- FXY—Factor that defines importance of PoXY.
Quality of B2B on-line sales,
where:
- QoB2BOLS—The quality of B2B on-line sales,
- QoNC—Quality of New Contract realization,
- RefQoNC—Reference Quality of New Contract Realization,
- FNC—Factor that defines importance of New Contract realization,
- QoEEC—The quality of Extension of Existing Contract realization,
- RefQoEEC—Reference Quality of Extension of Existing Contract realization,
- FEEC—Factor that defines importance of Extension of Existing Contract Realization,
- NC—New Contract
- EEC—Extension of Existing Contract
- Possibility and quality of contract extension (delivery to the address)
- Possibility and quality of signing a new contract (delivery to the address)
- The time of realization and delivery of the potential device (HW) to the user’s business address is analyzed—that is, the time from the conclusion of the NC or EEC to the end of the realization.
Quality of B2B on-line customer care,
where:
- PoCI—Percentage of Correct Information—Percentage of obtaining accurate and specific information in a short (defined) time,
- PoTPS—Percentage of Technical Problem Solutions—Percentage of solving technical problems on-line,
- PoOPS—Percentage of Other Problem Solutions—The percentage of solving other problems (complaints/appeals and similar),
- RefPoXY—Reference values for these parts of item,
- FXY—Factor that defines importance of PoXY.
Quality of pre-sales analysis,
where:
- QoDWhPre-Sales—Quality of Pre-Sales analysis,
- QoDWhPPC—Quality of DWh base of private customers,
- QoDWhPBC—Quality of DWH of business customers
- RefDWhPPC/B—Reference of DWhPPC/B.
- FPPC/B—Factor that defines importance of DWhPPC/B
- PPC—Potential Private Customers—Database of potential private users with details about them.
- PBC—Potential Business Customers—Database of potential business users with details about them.
Quality of post-sales analysis,
where:
- QoDWhPost-Sales—The quality of Post-Sales analysis,
- QoDWhEPC—Quality of DWh of existing private customers,
- QoDWhEBC—Quality of DWh of existing business customers,
- QoDWhEPPC—Quality of DWh of existing pre-paid customers,
- RefXYC—Referent values for DWh for all categories,
- FXYC—Factor that defines importance of individual parts of the item.
- EPC—Existing Private Customers—Detailed overview in the database of private users for all services,
- EBC—Existing Business Customers—Detailed overview in the database of business users for all services,
- EPPC—Existing Pre-paid Customers—Detailed overview in the database of pre-paid users
Quality of call center
where:
- QoCC—Quality of Call Center,
- PoIC—Percentage of Incoming Calls,
- PoSCP—Percentage of Solved Customer Problems,
- PoSSEP –Percentage of Successfully Solved Escalated Problems,
- Ref—defines referent values for all parts of the item,
- F—Factors that define importance of individual parts of the item.
Appendix I
Quality of managers
where:
- QoM—The quality of managers
- QoMTL—Quality of managers—the top level
- QoMRefTL—Quality of managers—the top level (referent values)
- FTL—a factor that defines importance of top-level management
- QoMML—Quality of managers—the middle level
- QoMRefML—Quality of managers—the middle level (referent values)
- FML—a factor that defines importance of middle level management
- QoMLL—Quality of managers—the low level
- QoMRefLL—Quality of managers—the low level (referent values)
- FLL—a factor that defines importance of low-level management
The equation consists of three parts and defines the assessment of three levels of management: top, medium and low. Of course, considering the organization of telecom operators, the equation can have more components, but through the performed analysis, this distribution provides the optimal approach. The CTE model analyzes three levels of management, i.e., their value and quality for the observed telecom operator.
Quality of employees
where is:
- QoE—The quality of employees
- PoETXYZ—Percentage of employees who graduated from one of the top XYZ Universities in the world (percentage of the total number of employees)
- RefPoETXYZ—Percentage of employees who graduated from one of the top XYZ Universities in the world (percentage of the total number of employees)—the referent value
- FT100 = 0.5; FT500 = 0.25; FT1000 = 0.15; FT2000 = 0.1
Quality of independent recruitment
where:
- QoIR—The quality of Independent Recruitment
- QoHH—Quality of Head Hunting—The quality of engaged independent assessment agencies at the time of employment
- RefQoHH—Quality of Head Hunting—The quality of engaged independent assessment agencies at the time of employment—the referent value
- FHH—Importance of Head Hunting companies in the recruitment process
- QoCT—Quality of Company Testing—The quality of company approach for recruitment
- RefQoCT—Quality of Company Testing—The quality of company approach for recruitment—the referent value
- FCT—Importance of Company Testing in the recruitment process
- FHH + FCT = 1
Quality of investment in education
where:
- QoIE—The quality of Investment in Education—Quality of investment in education—training of existing human resources
- QoIPK—Quality of investment in professional knowledge—Professional studies and training
- RefQoIPK—Quality of investment in professional knowledge—Professional studies and training—referent values
- FIPK—factor that defines importance of investment in professional studies and trainings
- QoISS—Quality of investment in scientific studies—Scientific studies and doctorates
- RefQoISS—Quality of investment in scientific studies—Scientific studies and doctorates—referent values
- FISS—factor that defines importance of investment in scientific studies and doctorates
- FISS + FIPK = 1
Quality of investment in specialized courses and trainings
where:
- QoISCT—The Quality of investment in specialized courses and trainings
- UT3D—Up to 3 days
- UT1W—Up to 1 week
- UT2W—Up to 2 weeks
- UT1M—Up to 1 month
- Ref—defines referent values for all parts of the item
- FUTXYZ—factors that define importance of individual parts of the item
- The sum of all F = 1.
Quality of compensations—salaries, bonuses, etc.
where:
- QoC—Quality of Compensation—Quality of compensation for employees
- QoSR—Quality of Salaries Ratio—The ratio of the salary amount compared to the average salary in the country for each of the categories
- QoB—Quality of Bonuses—Precisely defined rules for determining bonuses and incentives
- QoAfP—Awards for Projects—Precisely defined rules for rewarding projects completed (regardless of daily work)
- Ref –defines referent values for all parts of the item
- F—factors that define importance of all separate parts of the item
- The sum of all F = 1.
Quality of the working environment
where:
- QoWE—The Quality of Working Environment
- QoME—Quality of meals offers at the employer sites (restaurants, coffee shop, etc.)
- QoRE—Qality of recreation at the employer sites—The possibility of recreation and rest in the working environment
- QoNKE—Quality of nurseries and kindergartens at the employer sites
- Ref—defines Referent values for all parts of the item
- F—defines different factors of importance for all parts of the item
- The sum of all F = 1.
Quality and expertise of HR staff
where:
- QoEHR—Quality of Expertize of HR stuff
- PoXY—Percentage of employees in HR department
- PoPh—Percentage of certified psychologists
- PoA—Percentage of certified expert analysts
- PoL—Percentage of certified jurists
- PoST—Percentage of certified specialized trainers
- The percentage is compared to the number of employees in the HR segment, which is compared to the total number of employees in telecom
- Ref—defines Referent values for all parts of the item
- F—defines different factors of importance for all parts of the item
- The sum of all F = 1.
Quality of information systems to provide support to company employees
where:
- QoDWhHR—The Quality of information systems to provide support to company employees
- QoDWh10Y—The quality of activities and achievements of employees over the past ten years.
- QoDWhprojects—Quality of employee participation in different projects.
- QoDWhedu—Type of school, level of education and quality of the university/school (information about employees).
- QoDWhFL—Quality knowledge of foreign languages and continuous verification of knowledge of employees.
- Ref—defines Referent values for all parts of the item
- F—defines different factors of importance for all parts of the item
- The sum of all F = 1.
Quality of positioning the company as an employer in the observed environment
where:
- QoCiE—Company in Environment—The quality of the company in the environment
- PoTOICT—Positioning of Telekom Operator (TO) in the ICT business segment
- PoTOABS—ALL Business Segments—Positioning of Telecom Operators (TO) in the country, taking into account all business segments
- Ref—defines Referent values for all parts of the item
- F—defines different factors of importance for all parts of the item
- The sum of all F = 1.
- Analysis of the environment and positioning of the company as a desirable employer in the environment—ready-made analyzes carried out by chambers of commerce or independent agencies can also be used.
Appendix J
Resistance to Political situation in the state
where:
- RtPS—Resistance to Political Situation in the state
- RtCaE—Resistance to Changes after Elections—Business resistance to changes after elections (ordinary and/or extraordinary)
- PoBwS—Potential of Business with State—The potential of doing business with different levels of ministries and agencies (municipalities—cities—counties—state)
- Ref—defines Referent values for all parts of the item
- F—defines different factors of importance for all parts of the item
- The sum of all F = 1.
Resistance to Political situation in the region
where:
- RtPS—Resistance to to Political Situation in the region
- RtCaE Business resistance to changes after elections in neighboring countries or other countries that have an impact on the country of the observed telecom operator
- PoBwOS—Potential of Business with Other States—Business resistance to changes after elections in neighboring countries or other countries that have an impact on the country of the observed telecom operator
- Ref—defines Referent values for all parts of the item
- F—defines different factors of importance for all parts of the item
- The sum of all F = 1.
Potential of Average purchasing power of the individuals
where:
- PoAPPI—Potential of Average purchasing power of Individuals
- UE—Unemployed
- EP—Employed Persons
- TO—Telecom Operator
- STU—Students
- RP—Retired Persons
- Ref—defines Referent values for all parts of the item
- F—defines different factors of importance for all parts of the item
- The sum of all F = 1
- Average ARPU compared to the estimation of user spending potential on a monthly basis—by category-categories: unemployed, students, employed persons and pensioners.
Potential of Average purchasing power of the family
where:
- PoAPPF—Potential of Average Purchuasing Power of Families
- PoAPPF1—Potential of Average Potential Power of Families (Cat 1)
- PoAPPF2—Potential of Average Potential Power of Families (Cat 2)
- PoAPPF3—Potential of Average Potential Power of Families (Cat 3)
- PoAPPF4—Potential of Average Potential Power of Families (Cat 4)
- Ref—defines Referent values for all parts of the item
- F—defines different factors of importance for all parts of the item
- The sum of all F = 1.
- Average ARPU of shared services in the household compared to the assessment of the family’s consumption potential at the monthly level—by category—categories: number of employed family members—up to 25% (F1)—up to 50% (F2)—up to 75% (F3)—all employed in the family (F4).
Quality of customers who are employees in the manufacturing and all services industries
where:
- QoCMI—Quality of Customers in Manufacturing and All Services Industries (The item also excludes users at any level of local, county or state government)
- NoBCMI—Number of Telecom Business Customers from manufacturing industries
- NoBCSI—Number of Telecom Business Customers from Service Industries
- Max—defines Maximum values for all parts of the item
- F—defines different factors of importance for all parts of the item
- The sum of all F = 1.
Potential of international private and family tourism
where:
- PoPV—Potential of international private and family tourists
- U—Users
- N—The entire amount of visitors
- U1D—Up to 1 day
- U3D—up to three days
- U1W—up to 1 week
- U1M—up to 1 month
- F—defines different factors of importance for all parts of the item
- The sum of all F = 1.
Potential of international business visitors to the state
where:
- PoBV—Potential of Business Visitors
- UTD—Up to three days
- MTD—More than three days
- F—defines different factors of importance for all parts of the item
- The sum of all F = 1
- This equation analyzes business visitors and their activities on the network of telecom operators. It has two separate parts: it analyzes business visitors “up to three days” (UTD) and “more than three days” (MTD). After conducting analyses, it was concluded that most business conferences and similar events last up to three days. Visitors to such events are generally larger and better consumers of telecom operators than business users who come to visit for more than three days. Factors F give a description of the values for both items and their sum is one (1). CTE model gives precise description and explanation how to get required values in the given equation.
Quality and speed of resolving legal cases in courts
where:
- QSoRLC—Quality and Speed of Resolving Legal Cases
- SoC—The success of the collection of customer invoices
- SSoPLR—Successful solution of property—legal relations –
- UC—User complaints against telecom operators that have been successfully resolved
- Ref—defines Referent values for all parts of the item
- F—defines different factors of importance for all parts of the item
- The sum of all F = 1.
Regulatory stability in telecom sector
where:
- QoRS—Quality of Regulatory Stability
- PPL—Pre-planned activities—Pre-planned regulatory activity and telecom influence on activity
- PPLTO—Pre-planned activities that Telekom had an influence on and collaborated on
- UA—Unplanned activities—Unplanned activities of the regulator and the influence of telecoms on reducing potential damage
- UATO—Unplanned activities that were successfully resolved by Telekom and did not cause any kind of “damage”.
- F—defines different factors of importance for all parts of the item
- The sum of all F = 1.
Percentage of energy usage from renewable energy sources
where:
- PoRES—Percentage of energy usage from Renewable Energy Sources
- RESown—Own RES—Own sources—Total amount of energy use from own renewable energy sources
- RESOM—RES of Other Manufacturers—The total remaining amount of energy use from renewable energy sources by other producers
- TAE—Total Amount of Energy
- AEC—Amount of Energy Consumption
- F—defines different factors of importance for all parts of the item
- The sum of all F = 1.
Appendix K
Quality of brand in the state
where:
- QoBpriv—Recognition of brand quality among the population
- QoBbus + Recognition of brand quality among the business segments
- All brands positioned in the country are taken into consideration.
- Ref—defines Referent values for all parts of the item
- F—defines different factors of importance for all parts of the item
- The sum of all F = 1.
Quality of sub-brands in the state
where:
- QoSubBpriv—Recognition of sub-brand quality among the population
- QoSubBbus + Recognition of sub-brand quality among the business segments
- All sub-brands that are positioned in that segment are taken into account (e.g., sub-brand pre-paid services, sub-brand IPTV services, etc.)
- Ref—defines Referent values for all parts of the item
- F—defines different factors of importance for all parts of the item
- The sum of all F = 1.
Quality of brand and sub-brands recognized by visitors
where:
- QoB&SB—Quality of brands and sub-brands recognized by visitors
- QoB—Recognition of brand quality among the visitors
- QoSB + Recognition of sub-brand quality among the visitors
- Ref—defines Referent values for all parts of the item
- F—defines different factors of importance for all parts of the item
- The sum of all F = 1.
- The identification of the brands and sub-brands in the field of telecommunications is analyzed, so only direct competition without analyzing all brands on the market.
Relative amount of funds invested in campaigns considering spending on state-level marketing in all business sectors
where:
- QoAF—Quality of Amount of Funds
- QoAdv—Quality of Advertising—Quality and distribution of money invested in advertising in the media
- QoCtv—Quality of Creativity—Quality of money invested in creative solutions
- Ref—defines Referent values for all parts of the item
- F—defines different factors of importance for all parts of the item
- The sum of all F = 1.
Quality of digital advertising—own web page quality
where:
- QoWP—Kvaliteta web stranice
- NoVis—Number of website visits in one day—Page traffic compared to the most visited website of a company in that country
- DoVis—Duration of the Visit—The average retention on the page—the ease of getting information—is compared to the website of the company that is the best in that country
- Ref—defines Referent values for all parts of the item
- F—defines different factors of importance for all parts of the item
- The sum of all F = 1.
Quality of digital advertising–web advertising
where:
- QoWAdv—Quality of digital advertising –Web Advertising
- NoWatch—Number of Watches—Number of ad views
- NoC—NoClicks—Number of “clicks” on the ad—Number of clicks on the ad that leads to the website
- The comparison is made with the ads of the best ranked company from that country from any business segment.
- Ref—defines Referent values for all parts of the item
- F—defines different factors of importance for all parts of the item
- The sum of all F = 1
Quality of digital advertising–usage of LinkedIn
This equation has three different parts to analyze. It analyzes the number of followers, activities and positive comments and replies to comments by telecom operator administrators. Importance of these three parts is defined by different factors F and activities are defined by a multiplication of posts on the social network and a review of those posts. CTE Model gives all important definitions and explanations for this item and for all other items in this area.
Quality of digital advertising–Facebook advertising
This equation has three different parts to analyze. It analyzes the number of followers, activities and positive comments and replies to comments by telecom operator administrators. Importance of these three parts is defined by different factors F and activities are defined by a multiplication of posts on the social network and a review of those posts. CTE Model gives all important definitions and explanations for this item and for all other items in this area.
Quality of digital advertising–Instagram advertising
This equation has three different parts to analyze. It analyzes the number of followers, activities and positive comments and replies to comments by telecom operator administrators. Importance of these three parts is defined by different factors F and activities are defined by a multiplication of posts on the social network and a review of those posts. CTE Model gives all important definitions and explanations for this item and for all other items in this area.
Quality of digital advertising–e-mail advertising
where:
- QoE-mAdv—Quality of E-mail Advertising
- PoRea—Percentage of Reactions—Percentage of reactions from the total number of e-mail ads
- The comparison is made with the ads of the best-ranked company from that country from any business segment, or if this indicator is not known, a reference value is defined in accordance with experiences and international research and indicators.
Appendix L
By analyzing the literature, items which are cited in this paper [55,56,57,58,59,60,61,62,69,77,78,79,80] and many other items and conducting tests within this research based on the LTE Advanced (4G+) mobile network, Refs. [81,82] sampling rules have been created.
At the beginning, it is necessary to define the values of RefADD, RefADU and RefDEL from equation which is used to calculate both MDUA and MDMG items. When the CTE Model is used to analyze the potential and compare two or more telecoms from one or more countries, the highest (DL/UL) or lowest (DEL) measured value of all samples can be taken for these values, and thus using standardized values, calculate the potential estimate and make a comparison between telecoms. It is also possible to use maximum or minimum theoretical values (Ref) for a certain generation of mobile networks for this use of the CTE model.
When using the CTE model to assess the potential of a telecom for particular types of services, then the minimum and maximum theoretical values must be used to accurately assess the potential of telecom for specific types of services.
According to the analyzed literature that was available, the values that will be used in this paper for the LTE Advanced mobile network of the analyzed telecom were found. These referent values are:
- RefADD = 300 Mbps
- RefADU = 150 Mbps
- RefDEL = 10 ms.
Prior to the final sampling needed to assess the potential of telecoms to offer services in a smart city environment, another analysis was made to obtain more precise instructions for locations, times, and sampling methods. During a few days, samples have been taken according to a certain schedule in the city:
- on the main roads (so-called avenues and/or boulevards) signal samples were taken every 10–15 m,
- in residential areas with a large number of tall buildings (6 floors and more), samples were taken in front of, behind and between the buildings,
- on the main and other squares with a distance of 10–15 m distance for taking individual signal samples,
- In front of and around large shopping malls, samples were taken with a spacing of up to 10–15 m.
These results are not used for calculating the potential of telecoms for providing services in a smart city, but for defining specific locations and times of mobile signal sampling. The conclusions after the procedure are:
- deviations in measurements on the main roads in the city were very small and the signal in all its characteristics was stable,
- mobile signal patterns around and between tall residential buildings differed significantly in all essential characteristics (DL/UL/Del)
- the samples of the mobile signal in each square, viewed separately, did not differ significantly in their main characteristics, and these differences were in a few percentages.
- mobile signal patterns around large shopping malls showed some significant deviations and these patterns differed.
This specifically means that not too many samples should be taken on the main roads. It is enough to take samples at the main intersections and possibly one sample between the intersections (depending on the distance between the intersections). Sampling in residential areas and around major shopping centers should be more frequent and samples should be taken at a shorter distance.
Analyzing different settlements (the basis was Urban Area 4), it was concluded that the minimum number of samples was 10 per square kilometer. As this city is in the “Urban Zone 1”, its multiplication sampling factor is 4, so 40 samples should be taken. Samples should be taken during the peak network load, i.e., in the morning (7–10 h), then in the afternoon (12–14 h) and in the evening when pre-paid users are most active, ie in the period from 21–24 h. This means that in this case 120 different samples (40 + 40 + 40) per square kilometer should be taken. This also means that 1920 sampling should be done for quality analysis of services availability in an urban area of 16 km2, which is a lot.
One of the main goals is to create a robust and modular CTE model for fast but reliable and quality analysis of the potential of telecom operators. It is necessary that theoretical settings enable certain approximations in order to facilitate the daily use of the model for the analysis of telecom operator potentials. It is necessary to analyze the network load for each observed telecom operator, i.e., whether the load is greatest in the morning, around noon (for example between 11 a.m. and 2 p.m.) or in the evening. In almost all analyzed cases, the maximum load in the network is between 11 a.m. and 2/3 pm and therefore the first approximation can be defined in this direction. In addition, it is necessary to analyze the configuration of the city and see if it is possible to reduce sampling due to wide roads or some other factors that may reduce the number of samples taken.
For example, in this research, an analysis was performed on appx. 1 km2 in the inner-city area, which is bordered by two main roads and includes high-rise residential buildings, but also the largest business shopping center in the city. In parallel with these measurements described above, sampling can be performed with certain simplifications:
- instead of sampling in the morning, afternoon and evening, sampling will be done only in the period between 11 a.m. and 2 p.m.—maximum number of 40 samples,
- the number of samplings in residential areas but also on major roads will be reduced (less than 40 samples),
- for the narrower part of the city of 16 km2, it is necessary to take 640 samples (or less with certain additional approximations) and it is acceptable because 3–4 persons can perform the required sampling in one day.
The aim of this simplification is to test the robustness of the CTE model. Namely, if the deviations in the first metering method and in the second with many simplifications do not have large deviations, then this second mechanism can be used to get results of telecom potential and with lower costs and activities that could make this model even easier to use. In this way, 20–40 samples would be taken per 1 km2 instead of 120 samples, which would make this model much more acceptable for practical application. This is very important because these simplifications could significantly increase the use of the model in the case of 5G mobile network implementation.
As for to the first item, an analysis was made for the second item—MDMG item. Test sampling should be done at places of mass gatherings of people such as shopping malls, main bus stations, railway stations, playgrounds, university campuses, etc. The MDMG item is specific because parts of it refers to indoor sampling (e.g., shopping malls) and parts to open spaces (e.g., university campuses).
From this trial sampling, it can be seen that the obtained data are quite different from location to location and at only one location (e.g., within a shopping center). The deviations in the measurements are not very large, but they are still noticeable, and it is necessary to know this fact. When the CTE model is fully used, it is necessary to define all areas of mass gatherings in the city and make the necessary samplings. The aim of this paper is to show how the CTE model can help assess the potential of a telecom for some types of services and the test samples will be made within the largest and most visited shopping center with three floors underground and 5 floors above ground, so a total of 8 floors.
In accordance with the previously analyzed literature cited in this paper and in accordance with test sampling, it is ideal to take samples to the sales center on each of the floors by taking at least one sample in each of the stores of the sales center. Depending on the size of the store, a larger number of samples can be taken. In the common area on each floor, in front of elevators, inside and in front of cafes and inside and in front of restaurants. This would mean taking about 20 samples on the floors above ground and a dozen samples on the floors below ground. In addition, in order for the model to give accurate sampling results, it is necessary to work in the morning, afternoon and evening. So in this case (7 × 20 × 3) + (3 × 10 × 3) = 340 samples should be taken.
As in the case of the MDUA item, a simplified sampling model will be defined in such a way that sampling is done only around noon (11 a.m.–2 p.m.) and that the number of samples per floor is reduced by taking samples. in the common areas on the floors, in restaurants and cafes, and on the floors below the ground, i.e., the garage. Bellow the ground several (number of locations depends on underground floor area) locations will be defined where samples will be taken. It means in this case taking up to 50 unique samples. As with the first item, the results (with and without approximations or simplifications) will be compared to see the robustness of the CTE Model. If the final results are not different by more than 10%, this model can be used for this item for quick assessments of the telecom operator potentials.
Appendix M
Figure A1.
Comparison of DL speeds: MDUA.

Figure A2.
Comparison of UL speeds: MDUA.

Figure A3.
Comparison of DEL: MDUA.

Figure A4.
Comparison of delay patterns: server in the city vs. server located abroad.

Figure A5.
Comparison of download speeds (MDMG).

Figure A6.
Comparison of upload speeds (MDMG).

Figure A7.
Comparison of delay of signals (MDMG).

Appendix N
Appendix N.1. Coverage and Accessibility to User Area
The previous chapter shows in detail how the signal sampling is done for the first two items in this area—sampling in urban areas. Therefore, it will not be explained in detail here how samples are taken in urban but also in rural areas and on roads. It will also not explain in depth how the items from the part of fixed access to users are calculated, but will show the results by items, the total result of the area (excluding backlinks) and give comments and guidelines to improve the quality of accessibility to users for observed telecom.
The analysis was performed according to the instructions from the model for this area. All data for the mobile part were obtained by measuring (sampling) signals, while for the fixed part of accessibility to the user, available data were used with certain assumptions. The obtained results are shown in Table A1.

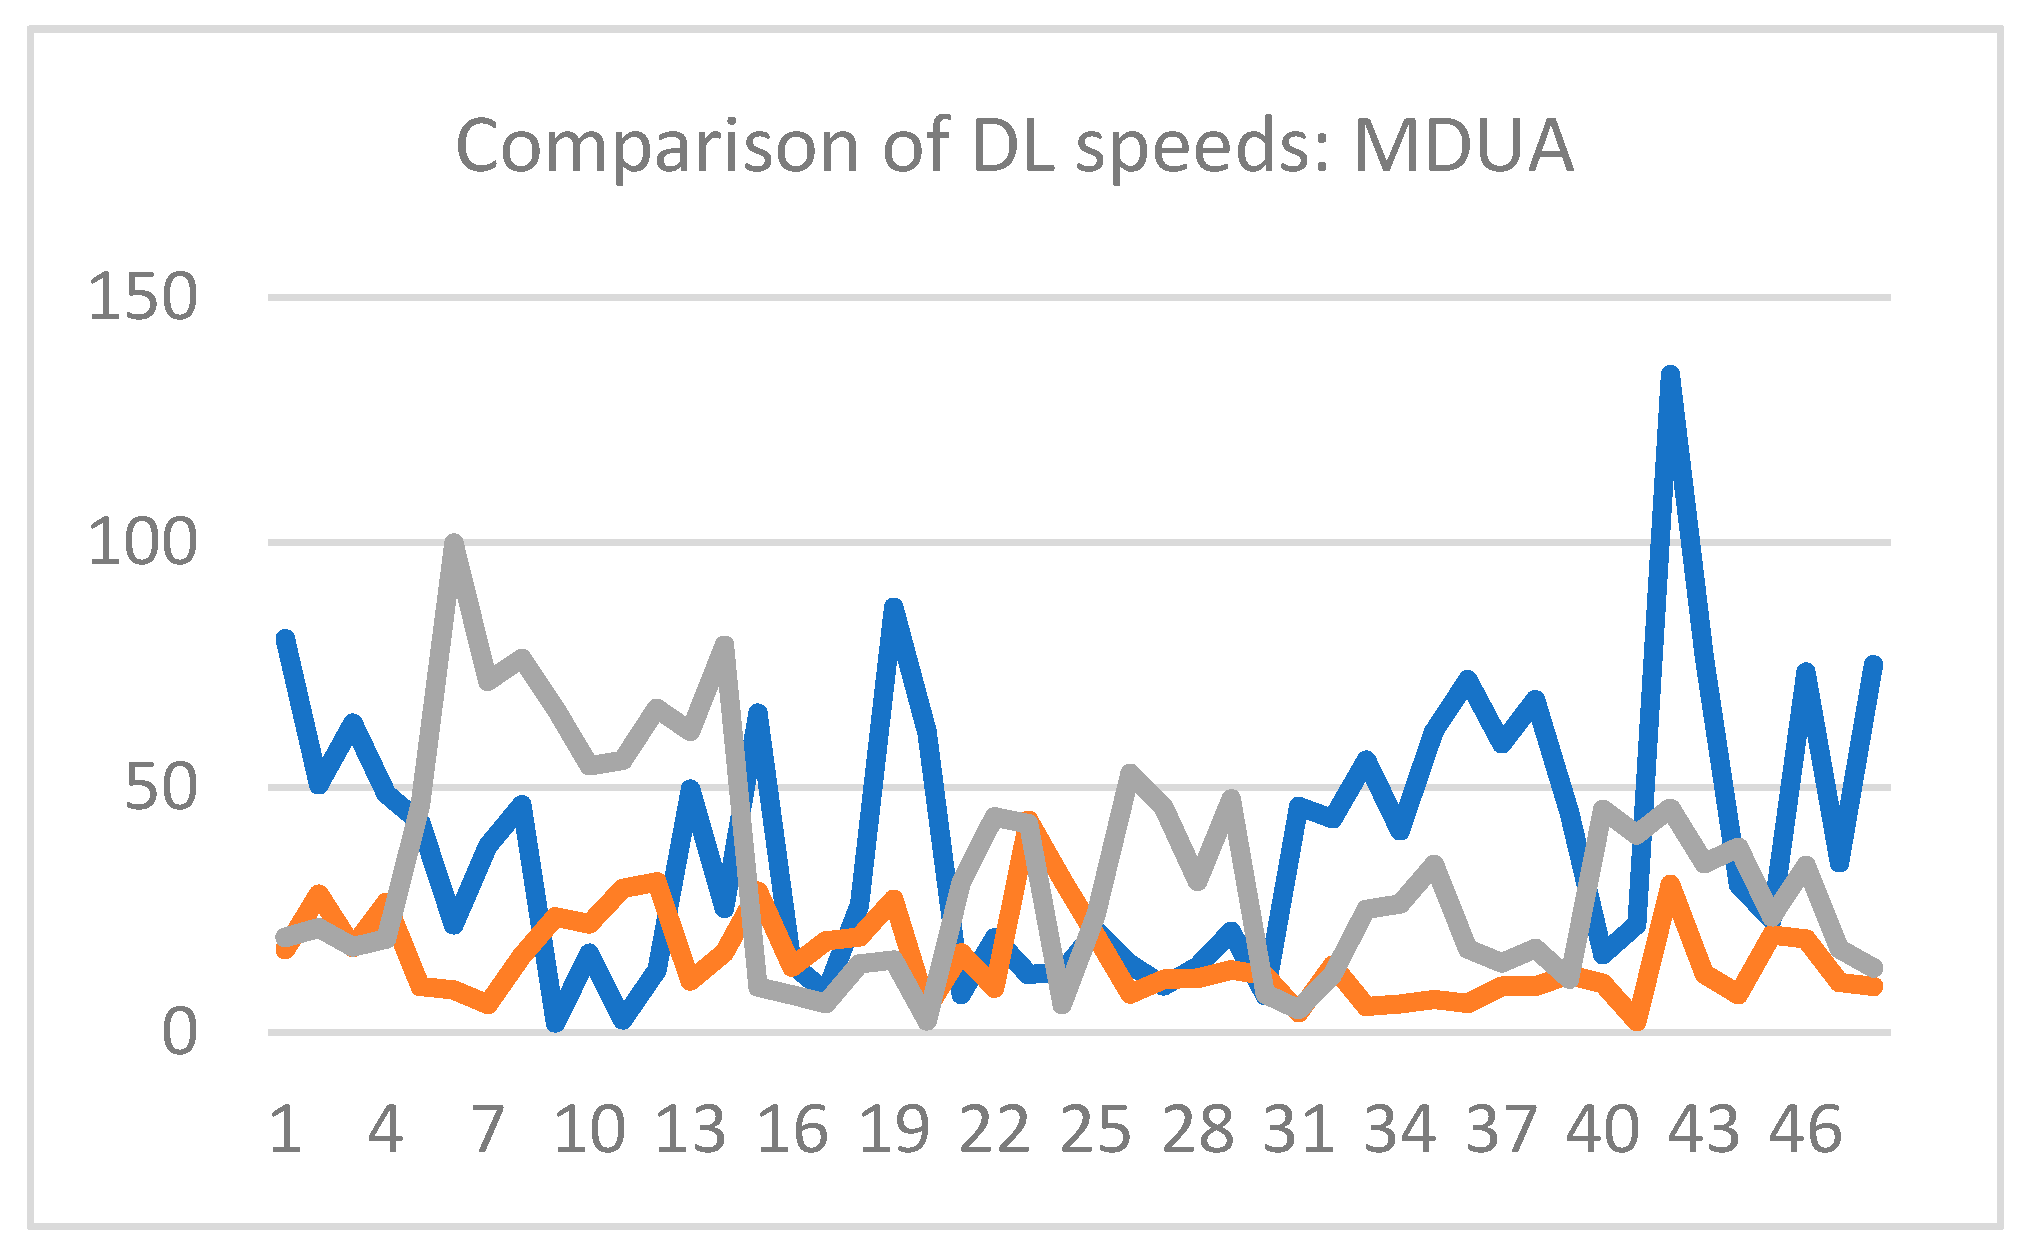
Table A1.
Results by items (first area).
| I | II | III | IV | V | VI | VII | VIII | IX | X | In Total |
|---|---|---|---|---|---|---|---|---|---|---|
| 0.04711 | 0.05686 | 0.0324 | 0.0547 | 0.03874 | 0.092 | 0.0127 | 0.0552 | 0.0285 | 0.0824 | 0.50061 |
The overall result shows that the assessment of the quality of accessibility to users is barely half of the maximum amount of this area (excluding backlinks). This points to the fact that the level of quality of accessibility to users is not at the best level. The analysis of individual items points even more precisely to the shortcomings in this area.
Appendix N.2. IT and Technological Development Area
This area provides an assessment of the quality and potential of IT and technological development of the observed telecom. It consists of ten special items, and some are related to items from other areas. In Section 3.3.2, this area is described, its main characteristics are given, and all items are listed. Therefore, this will not be repeated in this part of the paper. In this part of the paper, the obtained results will be presented based on the input data for the observed telecom operator and their inclusion in the mathematical equations of all items in the area. These results as well as the result of the total value of this area are shown in Table A2.
Table A2.
Results by items (second area).
| I | II | III | IV | V | VI | VII | VIII | IX | X | In Total |
|---|---|---|---|---|---|---|---|---|---|---|
| 0.082 | 0.0125 | 0.0413 | 0.015 | 0.09 | 0 | 0.01 | 0.01 | 0.004 | 0 | 0.2048 |
The overall result of this area clearly indicates the weak IT and technological development and the weak potential of telecoms in these items. The maximum value of this area is 1 (no potential increase due to the impact of feedback) and the calculation shows that the IT and technological potential of this operator is very low. What is particularly worrying is the fact that the calculation of two items is zero (0) and amounts three items are very low. This means that with such low IT and technological development, some other areas, for example Product Development and Service Development, will not have high amounts—due to this fact, they will have a significantly lower assessment of potential.
By analyzing this area and assessing the potential, it can be clearly concluded that the observed telecom operator must significantly improve the quality of IT and technological development. Of course, for precise guidelines, it is necessary to take into account the analysis of all areas and the impact of feedback in order to get a more precise answer to the extent of these investments. But it can certainly be concluded from this area that the observed telecom lags significantly behind in technological and IT development.
Appendix N.3. Products Development Area
The Product Development Area is area at the Business Level (BL). This area has its links with other areas and has particularly emphasized links with the previously described area of IT and technological development and with the Area of Service Development. This area is one of the areas that provides answers about the potential of the offer that telecom has on the market. As the product offer is related to the possibility of providing services and technological development and accessibility to users, this area is often connected with both areas from the technical level, with the area of service development but also with other areas dealing with customer or advertising issues. Table A3 shows the calculation of items in this area.
Table A3.
Results by items (Product Development Area).
| I | II | III | IV | V | VI | VII | VIII | IX | X | In Total |
|---|---|---|---|---|---|---|---|---|---|---|
| 0.0532 | 0.0607 | 0.0601 | 0.0327 | 0.0627 | 0 | 0.0134 | 0 | 0.0519 | 0.0433 | 0.4986 |
The maximum value of this area is one (1). The obtained result (0.4986) clearly shows that this telecom has significant potential to improve supply, especially in some of the items. This area gives a clear picture of the current potential but also provides the opportunity to improve the offer by correcting certain values in the products. Thus, reading the results of this area gives a picture of the potential and quality of supply, but also guidelines for improving supply. In addition, it is necessary to consider the impact of other areas on this area, but also the reverse—the impact of this area on other areas. All this ultimately provides clearer guidelines for making certain business and strategic business decisions.
Appendix N.4. Services Development Area
The Service Development area is closely related to the previous area but also to some other areas of the model. This primarily refers to the area of IT and technological development. The importance of this area for the functioning of telecoms is huge because it indicates the use of existing IT and technological infrastructure, but also the fact that through feedback clearly indicates what to invest in (hence indicates market trends) in terms of IT and technological development. After collecting the input data for this area and including them in the corresponding equations, the results were obtained by items, which are shown in Table A4.
Table A4.
Results by items (Service Development Area).
| I | II | III | IV | V | VI | VII | VIII | IX | X | In Total |
|---|---|---|---|---|---|---|---|---|---|---|
| 0 | 0 | 0 | 0.025 | 0 | 0.014 | 0.01 | 0 | 0 | 0 | 0.049 |
The results (both individual by items and total result) in this area clearly indicate that the observed telecom operator has a significant shortcoming in the development of new and advanced services. All of this is due to IT and technological shortcomings. Such a poor result is reflected in the area of Product Development and the result in this area is significantly lower because there is no basis for creating new and modern telecommunications products. What can be recommended is to urgently invest in infrastructure for new services in order to design and create new advanced services and new products based on them. It is necessary to make a market analysis and determine which of the services would be the most cost-effective to begin with and start investing in new technologies that will support such sustainable development. This should certainly be a priority in the development of this telecom’s business.
Appendix N.5. Sales and Customer Care Area
This area analyzes the quality of access and care for different types of users through its items. Already, access and customer care is one of the key segments of quality business and this will be even more pronounced in the coming years and decades. Therefore, the analysis of results in this area is extremely important and it is necessary to consider and conclude how this segment can be improved. The necessary data were collected and inserted into the equations and the results were obtained by the items shown in Table A5.
Table A5.
Results by items (Sales and Customer Care Area).
| I | II | III | IV | V | VI | VII | VIII | IX | X | In Total |
|---|---|---|---|---|---|---|---|---|---|---|
| 0.0723 | 0.0614 | 0.024 | 0.017 | 0.0341 | 0.01 | 0.01 | 0.0891 | 0.0734 | 0.0241 | 0.4181 |
The results show that sales and customer care can be significantly improved and enhanced. The results for individual items are quite low and this is especially true for the online segment of sales and customer care. In this segment, with a small investment, this type of access to users can be significantly improved and improved and their satisfaction can be increased. In any case, it is necessary to take urgent steps in repairing the access to the user (especially online access) and to repair the pre-sale and after-sales analysis.
Appendix N.6. Human Resources (HR) Area
The importance and significance of this area is clear to every company in every business segment. Therefore, this area will not be described too much here, but the results will be presented in Table A6 and briefly commented on.
Table A6.
Results by items (HR Area).
| I | II | III | IV | V | VI | VII | VIII | IX | X | In Total |
|---|---|---|---|---|---|---|---|---|---|---|
| 0.0427 | 0.0431 | 0.012 | 0.014 | 0.007 | 0.0771 | 0.004 | 0.017 | 0.033 | 0.0421 | 0.292 |
Unfortunately, it is evident that Human Resources Management is at a very low level, but it is possible to draw conclusions from the results of how and in which direction work should be done to significantly improve this. Significant investment is certainly needed in advancement and specialized courses, informatization of HR departments, but also training of staff working on these jobs. In this way, the business results of this operator would ultimately be significantly improved.
Appendix N.7. Political, Financial, Law and Regulatory Issues Area
This area provides answers to questions about the potential of telecom in the environment in which it operates and what is the potential of telecom to withstand changes in the market and environment. Although we read about four different segments, given their interaction and action on telecom, they are located in the same area with defined items that as such have the most significant impact on the business of telecoms. Of course, these items as well as items in other areas are subject to change over time and for this purpose, it is necessary to constantly analyze the changes and how they affect the business of telecoms. This area and its main characteristics have already been explained, so only the results of what will be presented are here (Table A7).
Table A7.
Results by items (PFL&R Area).
| I | II | III | IV | V | VI | VII | VIII | IX | X | In Total |
|---|---|---|---|---|---|---|---|---|---|---|
| 0.012 | 0.0247 | 0.0173 | 0.0142 | 0.011 | 0.0427 | 0.0177 | 0.0087 | 0.0492 | 0.0023 | 0.1998 |
The maximum value of this area is one (without the influence of feedback), so it is evident how little the observed telecom is resistant to its environment and how little it uses the potentials from the environment. Here we will not delve into a deeper analysis of shortcomings but only make recommendations for better use of the potential of existing resources and opportunities from the environment that can be affected by telecom (of course it cannot affect all items in the environment).
Appendix N.8. Quality of Brand and Presence in the Public Area
This area defines the presence of telecom in the environment and its effect on the environment. This area has already been described and its main characteristics and features have been given, so only the results by items will be presented here (Table A8) and basic recommendations for the observed telecom will be given.
Table A8.
Results by items (B&PP Area).
| I | II | III | IV | V | VI | VII | VIII | IX | X | In Total |
|---|---|---|---|---|---|---|---|---|---|---|
| 0.0582 | 0.0534 | 0.0628 | 0.03147 | 0.03014 | 0.0234 | 0.02117 | 0.0101 | 0.0112 | 0.0041 | 0.30598 |
The final result shows that there is a significant opportunity to raise the level of value of this area. This primarily refers to greater activity in the digital environment and this would not require greater financial investment. Increasing these activities would also increase the value of previous items, as this would increase the quality of the brand and sub-brands. Thus, it is possible to significantly raise the value of this area, and this affects the impression that customers and potential customers have about telecom. In this way, sales activities are facilitated because it affects the better sales of products and services of this telecom.
Appendix O
The application of Artificial Intelligence (AI) in the CTE model is reflected in the gradual increase in the number of items. AI does not have its own special segment or items, but the application of AI is reflected through the impact on individual areas and their items. There is a possibility that with this approach, with the development of technology in the coming years and decades, the CTE model will also contain individual items for AI assessment in addition to the existing approach of increasing the percentage of individual items in the model.
Appendix P
The CTE model has a significant number of back-and-forth links between individual items in the same or different areas, which increases the quality and precision of the assessment of the potential of an individual telecom. These links will not be shown in this paper, because there are a significant number of them, and it would be quite complex to explain them all. They are not necessary for understanding the application of the CTE model and for understanding its practical application.
References
- Jurčić, I. EKF Analysis for Positive Business Case: Telecom 4.0 and Modern Smart City. In Proceedings of the 2019 International Workshop on Fiber Optics in Access Networks (FOAN), Sarajevo, Bosnia and Herzegovina, 2–4 September 2019. [Google Scholar]
- Papakonditidis, L.A.; Jurčić, I. Eight Key Field analysis (EKF) and 3-pole (win-win-win) challenges for mobile telecommunications. In Proceedings of the CIET 2018, Split, Croatia, 14–15 June 2018. [Google Scholar]
- Jurčić, I.; Gotovac, S. Ne appraoch in mobile telecom operators analysis—Analysis of Eight Key Fields. In Proceedings of the SoftCOM 2016, Split, Croatia, 22–24 September 2016. [Google Scholar]
- Gotovac, S.; Jurčić, I.; Radoš, I. Services in tourism based on Vision 2020—A chance for telecom operators. In Proceedings of the Splitech 2016, Split, Croatia, 13–15 July 2016. [Google Scholar]
- Jurčić, I.; Umachandran, K.; della Corte, V.; del Gaudio, G.; Aravind, V.R.; Ferdinand-James, D. Industry 4.0: Unleashing Its Future Smart Services. In Proceedings of the CIET 2018, Split, Croatia, 14–15 June 2018. [Google Scholar]
- Jurčić, I.; Jurčić, D. Potencijali za razvoj novih proizvoda i usluga u turizmu baziranih na novim ICT tehnologijama. In Proceedings of the CIET 2016, Split, Croatia, 16–18 June 2016. [Google Scholar]
- Verbrugge, S.; Casier, K.; van Ooteghem, J.; Lannoo, B. Practical steps in techno-economic evaluation of network deployment planning part 1: Methodology overview. In Proceedings of the Networks 2008—The 13th International Telecommunications Network Strategy and Planning Symposium, Budapest, Hungary, 28 September–2 October 2008; pp. 1–101. [Google Scholar]
- Czarnecki, C.; Winkelmann, A.; Spiliopoulou, M. Refernce Process Flows for Telecommunication Companies An Extension of the eTOM Model. Bus. Inf. Syst. Eng. (BISE) 2013, 5, 83–96. [Google Scholar] [CrossRef]
- Teukanova, O.; Torosyan, E.; Morozova, M.; Shekovtsova, E. Standardization of eTOM model for solving problems of the Russian telecommunications market. E3S Web Conf. 2019, 110, 02077. [Google Scholar] [CrossRef]
- Mireskandari, F.; Nasiri, R.; Latif Shabgahi, G. Leveraging Engaged Parties in SIP Domains of eTOM Framework by using TSM Reference Model. J. Adv. Comput. Eng. Technol. (JACET) 2016, 2, 49–55. [Google Scholar]
- Suzuki, A.; Kashibuchi, K.; Nakamura, T. Activities toward TM Forum Frameworx 17.0 and TM Forum Live! 2017 Report. Global Standardization Activities. NTT Tech. Rev. 2017, 16. [Google Scholar]
- Seraoui, Y.; Raouyane, B.; Belmekki, M.; Bellafkih, M. eTOM to NFV mapping for flexible mobile service chaining in 5G networks: IMS Use Case. Heliyon 2020, 6, e04307. [Google Scholar] [CrossRef] [PubMed]
- Introduction to eTOM, White Paper, Cisco Systems. 2009. Available online: https://www.cisco.com/en/US/technologies/tk869/tk769/technologies_white_paper0900aecd806c3eee.html (accessed on 15 May 2022).
- Benhima, M.; Reilly, J.P.; Naamane, Z.; Kharbat, M.; Kabbaj, M.I.; Esqalli, O. Design and implementation of the Customer Experience Data Mart in the Telecommunication Industry: Application Order-To-Payment end to end process. arXiv 2013, arXiv:1401.0534. [Google Scholar]
- Mochalov, V.; Bratchenko, N.; Linets, G.; Yakovlev, S. Distributed Management Systems for Infocommunication Networks: A Model Based on TM Forum Frameworx. Computers 2019, 8, 45. [Google Scholar] [CrossRef] [Green Version]
- TM FORUM. Business Process Framework (eTOM), Poster, Release 14.5; TM FORUM: London, UK, 2014. [Google Scholar]
- Telecommunications Operators in the New Digital Era. Management Solutions. 2016. Available online: https://www.managementsolutions.com/sites/default/files/publicaciones/eng/telecommunications-digital-era.pdf (accessed on 3 June 2022).
- Guang-jun, H.; Zheng-qiu, L. Research on SLA Information Model based on SID. In Proceedings of the 10th International Conference on Computer Science & Education (ICCSE 2015), Cambridge, UK, 22–24 July 2015. [Google Scholar]
- Reilly, J.P. Implementing the TM Forum Information Framework (SID): A Practitioner’s Guide, Version 1.0; TM FORUM: London, UK, 2011. [Google Scholar]
- TMF NGOSS Program. FER, University of Zagreb, Republic of Croatia. Available online: www.fer.unizg.hr (accessed on 18 May 2020).
- Kamal, S.A.; Shafiq, M.; Kakria, P. Investigating acceptance of telemedicine services through an extended technology acceptance model (TAM). Technol. Soc. 2020, 60, 101212. [Google Scholar] [CrossRef]
- Qin, X.; Shi, Y.; Lyu, K.; Mo, Y. Using a TAM-TOE Model to Explore Factors of Building Information Modelling (BIM) Adoption in the Construction Industry. J. Civ. Eng. Manag. 2020, 26, 259–277. [Google Scholar] [CrossRef]
- Baby, A.; Kannammal, A. Network Path Analysis for developing an enhanced TAM model: A usercentric e-learning perspective. Comput. Hum. Behav. 2019, 107, 106081. [Google Scholar] [CrossRef]
- Awa, H.O.; Ojiabo, O.U. A model of adoption determinants of ERP within T-O-E framework. Inf. Technol. People 2016, 29, 901–930. [Google Scholar] [CrossRef]
- Dhaveji, C.D.; Rainar, R.; Mathur, M.P.; Kaur, G. Conducting Training Needs Assessment (TNA) and Preparation of Strategic Training Plan; Government of India: New Delhi, India; World Bank: Washington, DC, USA, 2014; Volume 1. [Google Scholar]
- Ahmed, K.U.; Zafar, S.S. Training Needs Analysis (TNA) in the Organization; Department of Master of Business Administrator, North South University: Dhaka, Bangladesh, 2016. [Google Scholar]
- Association of Public Health Laboratories (APHL). 2018 Training Needs Assessment Survey Report; APHL: Silver Spring, MD, USA, 2019. [Google Scholar]
- Mercados–Energy Markets International and North Delhi Power Limited (NDPL). India: Capacity Development of the Assam Power Sector Utilities, Technical Assistance Consultatnt’s Report; NDPL: New Delhi, India, 2012. [Google Scholar]
- Gervala, M.; Preniqi, N.; Kopacek, P. IT Infrastructure Library (ITIL) framework approach to IT Governance. Sci. Direct 2018, 53, 181–185. [Google Scholar] [CrossRef]
- Nur, M.; Batmetan, J.R.; Mangoppa, H.K. Smart City Maturity Level Analysis Using ITIL Framework. In Proceedings of the 5th UPI International conference on Technical and Vocational Education and Training (ICTVET 2018), Bandung, Indonesia, 11 September 2018. [Google Scholar]
- Baecker, P.N.; Grass, G.; Hommel, U. Business value and risk in the presence of price controls: An option-based analysis of margin squeeze rules in the telecommunications industry. Ann. Oper. Res 2010, 176, 311–332. [Google Scholar] [CrossRef]
- Kuebel, H.; Limbach, F.; Zarnekov, R. Business Models of Developer Platforms in the Telecommunications Industry—An Explorative Case Study Analysis. In Proceedings of the 2014 47th Hawaii International Conference on System Science, Washington, DC, USA, 6–9 January 2014. [Google Scholar]
- Kwizera, E.; Mico, D.; Nayebare, M.; Garba, A.A.; Saint, M.; Deen, L.G. The Impact of over the Top Service Providers in the Rwandan Telecommunications Market: An Analysis of Business Models. In Innovations and Interdisciplinary Solutions for Underserved Areas; Springer: Berlin/Heidelberg, Germany, 2018. [Google Scholar]
- Lavasani, K.M. Coopetition and sustainable competitiveness in business ecosystem: A networks analysis of the global telecommunications industry. Transnatl. Corp. Rev. 2017, 9, 281–308. [Google Scholar]
- Saputra, D.A.; Nugroho, W.S.; Ranti, B. Benefits Analysis of IT Investment in Business Support System (BSS) Projects Using Ranti’s Generic IS/IT Business Values: Case Studies of the Indonesian Telecommunication Company. In Proceedings of the 2019 International Conference on Advanced Computer Science and information Systems (ICACSIS), Bali, Indonesia, 12–13 October 2019. [Google Scholar]
- Grishunin, S.; Suloeva, S.; Nekrasova, T. Development of the Mechanism of Risk-Adjusted Scheduling and Cost Budgeting of R&D Projects in Telecommunications. In Proceedings of the Internetional Conference on Next Generation Wired/Wireless Networking, St. Petersburg, Russia, 26–28 August 2018. [Google Scholar]
- Mannan, M.; Mohiuddin, M.F.; Chowdhury, N.; Sarker, P. Customer satisfaction, switching intentions, perceived switching costs, and perceived alternative attractiveness in Bangladesh mobile telecommunications market. South Asian J. Bus. Stud. 2017, 6, 142–146. [Google Scholar] [CrossRef]
- Reyes1, R.R.; Bauschert, T. Bottom-up framework for cost allocation to services in telecommunication networks—Case study: Cost allocation for flex-grid optical networks. Netnomics 2017, 18, 81–105. [Google Scholar] [CrossRef]
- Özmen, M.; Aydogan, E.K.; Delice, Y.; Toksar, M.D. Churn prediction in Turkey’s telecommunications sector: A proposed multiobjective–cost-sensitive ant colony optimization. WIREs Data Min. Knowl. Discov. 2020, 10, e1338. [Google Scholar] [CrossRef]
- Bouras, C.; Kokkalis, S.; Kollia, A.; Papazois, A. Techno-economic comparison of MIMO and DAS cost models in 5G Networks. Wirel. Netw. 2020, 26, 1–15. [Google Scholar] [CrossRef]
- Bouras, C.; Kollia, A.; Maligianni, E. Techno-economic Comparison of Cognitive Radio and Software Defined Network (SDN) Cost Models in 5G Networks. Wirel. Pers Commun. 2020, 114, 1403–1430. [Google Scholar] [CrossRef]
- Hernandez, J.A.; Quagliotti, M.; Riccardi, E.; Lopez, V.; de Dios, O.G.; Casellas, R. A Techno-Economic Study of Optical Network Disaggregation Employing Open Source Software Business Models for Metropolitan Area Networks, optical communications and etworks. IEEE Commun. Mag. 2020, 58, 40–46. [Google Scholar] [CrossRef]
- Chen, H.; Li, L.; Chen, Y. Sustainable growth research—A study on the telecom operators in China. J. Manag. Anal. 2022, 9, 17–31. [Google Scholar] [CrossRef]
- Wang, X.Y.; Wu, H.; Lu, L. A Novel Service Provision Mode for Sustainable Development of the Telecom Industry. Sustainability 2021, 13, 5164. [Google Scholar] [CrossRef]
- Laghouag, A.A.; Farhi, F.; Bin Zafrah, F. Assessing the Maturity of Corporate Social Responsibility Practices: An Applied Study on Telecom Companies in KSA. TEM J.-Technol. Educ. Manag. Inform. 2021, 10, 226–237. [Google Scholar]
- Wang, H.T. Discussion of the Competitive Strategies of Telecom Operators and Over-the-Top Service Providers from the Perspective of Evolutionary Game Theory. Decis. Anal. 2020, 17, 260–275. [Google Scholar] [CrossRef]
- Dhir, S.; Rajan, R.; Ongsakul, V.; Owusu, R.A.; Ahmed, Z.U. Critical success factors determining performance of cross-border acquisition: Evidence from the African telecom market. Thunderbird Int. Bus. 2021, 63, 43–61. [Google Scholar] [CrossRef]
- Kern, P.; Gospel, H. The effects of strategy and institutions on value creation and appropriation in firms: A longitudinal study of three telecom companies. Strateg. Manag. J. 2020. [Google Scholar] [CrossRef]
- Abdulrab, M. Factors affecting acceptance and the use of technology in yemeni telecom companies. Int. Trans. J. Eng. Manag. Appl. Sci. Technol. 2020, 11, 11A06O. [Google Scholar]
- Ullah, I.; Mirza, B.; Kashif, A.R.; Abbas, F. Examination of knowledge management and market orientation, innovation and organizational performance: Insights from telecom sector of Pakistan. Int. J. Knowl. Manag. E-Learn. 2019, 11, 522–551. [Google Scholar]
- Librita Arifiani, S.K.; Dyah Budiastuti, M.M.; Wibowo Kosasih, E. The Effect of Disruption Technology, and the Future Knowledge Management toward Service Innovation for Telecommunication Industry 4.0 in Indonesia. Int. J. Eng. Adv. Technol. 2019, 8, 247–257. [Google Scholar]
- Niemczyk, J.; Trzaska, R.; Wilczyński, M.; Borowski, K. Business Models 4.0 Using Network Effects: Case Study of the Cyfrowy Polsat Group. Sustainability 2021, 13, 11570. [Google Scholar] [CrossRef]
- Varga, P.; Bácsi, S.; Sharma, R.; Fayad, A.; Mandeel, A.R.; Soos, G.; Franko, A.; Fegyo, T.; Ficzere, D. Converging Telco-Grade Solutions 5G and beyond to Support Production in Industry 4.0. Appl. Sci. 2022, 12, 7600. [Google Scholar] [CrossRef]
- Ruppert, T.; Jaskó, S.; Holczinger, T.; Abonyi, J. Enabling Technologies for Operator 4.0: A Survey. Appl. Sci. 2018, 8, 1650. [Google Scholar] [CrossRef] [Green Version]
- Andersson, P.; Movin, S.; Mahring, M.; Taigland, R.; Wennberg, K. (Eds.) Managing Digital Transformation; Stockholm School of Economics Institute for Research (SIR): Stockholm, Sweden, 2018. [Google Scholar]
- Forsythe, L. Digital Transformation of Human Services Delivery; KPMG: Amstelveen, The Netherlands, 2017. [Google Scholar]
- Yaqoob, I.; Abaker, I.; Hashem, T.; Mehmood, Y.; Gani, A.; Mokhtar, S.; Guizani, S. Enabling Communication Technologies for Smart Cities. IEEE Commun. Mag. 2017, 55, 112–120. [Google Scholar] [CrossRef]
- Hamaguchi, K.; Ma, Y.; Takada, M.; Nishijima, T.; Shimura, T. Telecommunication Systems in Smart Cities. Hitachi Rev. 2012, 61, 152–158. [Google Scholar]
- Telecommunication Providers as Enablers for Smart Cities; Arthur D Little: Brussels, Belgium, 2015.
- Ghanbari, A.; Alvarez, O.; Markendahl, J. MTC Value Network for Smart City Ecosystem. In Proceedings of the 2016 IEEE Wireless Communications and Networking Conference, Doha, Qatar, 3–6 April 2016. [Google Scholar]
- Nick, G.A.; Pongracz, F. Hungarian Smart Cities Strategies towards Indsutry 4.0. Sci. Proc. Int. Sci. Conf. Ind. 4.0. 2016, 1, 122–127. [Google Scholar]
- Lom, M.; Pribyl, O.; Svitek, M. Industry 4.0 as a Part of Smart Cities. In Proceedings of the Smart Cities Symposium Prague, Prague, Czech Republic, 26–27 May 2016. [Google Scholar]
- Nick, G.; Pongracz, F.; Radacs, E. Interpretation of disruptive innovation in the era of smart cities of the fourth industrial revolution. DETUROPE–Cent. Eur. J. Reg. Dev. Tour. 2018, 10, 53–70. [Google Scholar]
- Santos, B.P.; Charrua-Santos, F.; Lima, T.M. Industry 4.0: An overview. In Proceedings of the World Congress on Engineering; IAEN: London, UK, 2018. [Google Scholar]
- Aldag, M.C.; Eker, B. What is Quality 4.0 in the era of Industry 4.0? In Proceedings of the 3rd International Conference on Quality of Life, Center for Quality, Faculty of Engineering, University of Kragujevac, Kragujevac, Serbia, 28–30 November 2018. [Google Scholar]
- Khan, A.; Turowski, K. A Perspective on Industry 4.0: From Challenges to Opportunities in Production Systems. In International Conference on Internet of Things and Big Data; SCITEPRESS: Setúbal, Portugal, 2016. [Google Scholar]
- Nagy, J.; Olah, J.; Erdei, E.; Mate, D.; Popp, J. The Role and Imapct of Industry 4.0 and the Internet of Things on the Business Strategy of the Vale Chain–The Case of Hungary. Sustainability 2018, 10, 3491. [Google Scholar] [CrossRef] [Green Version]
- Rao, S.K.; Prasad, R. Telecom Operator’s Business Model Innovation in a 5G World. J. Multi Bus. Model Innov. Technol. 2018, 4, 149–178. [Google Scholar] [CrossRef] [Green Version]
- Rahimi, H.; Zibaaenejad, A.; Safavi, A.A. A Novel IoT Architecture based on 5G–IoT and Next Generation Technologies. In Proceedings of the 2018 IEEE 9th Annual Information Technology, Electronics and Mobile Communication Conference (IEMCON), Vancouver, BC, Canada, 1–3 November 2018. [Google Scholar]
- Opatha, H. Human Resource Management; Tata McGraw-Hill: New York, NY, USA, 2019. [Google Scholar]
- Rao, P.S. Personnel and Human Resource Management, 5th Revised ed; Himalaya Publishing House: Mumbai, India, 2014. [Google Scholar]
- Elkata, E. Introduction to Human Resource Management and the Environment; Oxford University Press: Oxford, UK, 2017. [Google Scholar]
- The Open University of Hong Kong. Human Resource Management; The Open University of Hong Kong: Hong Kong, China, 2018. [Google Scholar]
- Anthonia, A.A.; Omotayo, O.A. Human Resource Management: Theory and Practice; Covenant University: Ota, Nigeria, 2012. [Google Scholar]
- Blackman, C.; Forge, S. 5G Deployment—Stateof Play in Europe, USA and Asia; European Parliament’s Committee on Industry, Research and Energy: Luxembourg, 2019. [Google Scholar]
- Alsharif, M.H.; Kelechi, A.H.; Albreem, M.A.; Chaudhry, S.A.; Zia, M.S.; Kim, S. Sixth Generation (6G)Wireless Networks: Vision, Research Activities, Challenges and Potential Solutions. Symetry 2020, 12, 676. [Google Scholar] [CrossRef]
- Sun, S.; Rappaport, T.S.; Rangan, S.; Thomas, T.A.; Istyan, A.G.; Kovacs, Z.; Rodriguez, I.; Koymen, O.; Partyka, A.; Jarvelainen, J. Propagation Path Loss Models for 5G Urban Microand Macro-Cellular Scenarios. In Proceedings of the 2016 IEEE 83rd Vehicular Technology Conference (VTC2016-Spring), Nanjing, China, 15–18 May 2016. [Google Scholar]
- Sun, S.; Rappaport, T.S.; Thomas, T.A.; Ghosh, A.; Nguyen, H.C.; Kovacs, I.Z.; Rodriguez, I.; Koymen, O.; Partyka, A. Investigation of Prediction Accuracy, Sensitivity, and Parameter Stability of Large-Scale Propagation Path Loss Models for 5G Wireless Communications. IEEE Trans. Veh. Technol. 2016, 65, 2843–2860. [Google Scholar] [CrossRef]
- Al-Samman, A.M.; Azmi, M.H.; Al-Gumaei, Y.A.; Al-Hadhrami, T.; Abd Rahman, T.; Fazea, Y.; Al-Mqdashi, A. MillimeterWave Propagation Measurements and Characteristics for 5G System. Appl. Sci. 2020, 10, 335. [Google Scholar] [CrossRef]
- Casillas-Perez, D.; Camacho-Gómez, C.; Jiménez-Fernandez, S.; Portilla-Figueras, J.A.; Salcedo-Sanz, S. Weighted ABG: A General Framework for Optimal Combination of ABG Path-Loss Propagation Models. IEEE Access 2020, 8, 101758–101769. [Google Scholar] [CrossRef]
- Mesbahi, N.; Dahmouni, H. Delay and jitter analysis in LTE networks. In Proceedings of the 2016 International Conference on Wireless Networks and Mobile Communications (WINCOM), Fez, Morocco, 26–29 October 2016; pp. 122–126. [Google Scholar]
- Madi, N.K.; Hanapi, Z.M.; Othman, M.; Subramaniam, S.K. Delay-based and QoS-aware packet Scheduling for RT and NRT multimedia services in LTE downlink systems. EURASIP J. Onwireless Commun. Netw. 2018, 1, 1–21. [Google Scholar] [CrossRef]
- Novotný, R.; Kuchta, R.; Kadlec, J. Smart City Concept, Applications and Services. J. Telecommun. Syst. Manag. 2014, 3, 1–5. [Google Scholar]
- NOKIA. Smart, Safe and Sustainable Services for Smart Cities. Use Case; NOKIA: Espoo, Finland, 2017. [Google Scholar]
- Oktaria, D.; Kurniawan, N.B. Smart City Services: A Systematic Literature Review. In Proceedings of the International Conference on Information Technology Systemsand Innovation (ICITSI), Bandung, Indonesia, 23–24 October 2017; 2017. [Google Scholar]
- Lytras, M.D.; Visvizi, A. Who uses Smart City Services and What to make with it: Toward Interdisciplinary Smart City Research. Sustainability 2018, 10, 1998. [Google Scholar] [CrossRef]
- Ministry of Urban Development Of Government of India. Smart City—Mission Statement and Guidelines; Ministry of Urban Development Of Government of India: New Delhi, India, 2015. [Google Scholar]
- THALES. Introducing 5G Networks—Characteristics and Usages. Mobile Connectivity Solutions; THALES: Paris, France, 2020. [Google Scholar]
- GSMA Association Team: 5G Task Force Team of GSM Association. The 5G Guide—A Referemce for Operators; GSMA Associatiom, 2019; Available online: https://www.gsma.com/ (accessed on 29 August 2022).
Table 1.
The distribution of fields in the CTE model.
| CTE Model | ||||
|---|---|---|---|---|
| Technical Level | Coverage and Accessibility to Users | Technological Dev. and IT Development | ||
| Business Level | Products Development | Services Development | Sales and Customer care | Human Resources (HR) |
| Environmental Level | Political, Financial, Regulatory and Law environment | Quality of Brand and Presence in public | ||
Table 2.
CTE model—brief explanations and connections to the text in the article.
| CTE Model Chapter: Section 3; Appendix B | ||||
| TL Section 3.3. Appendix C | Coverage and Accessibility to Users
| Technological Dev. and IT Development
| ||
| BLSection 3.4. | Products Development
| Services Dev.
| Sales and Customer care
| Human Resources (HR)
|
| ELSection 3.5. | Political, Fin., Regulatory and Law environment
| Quality of Brand and Presence in public
| ||
Table 3.
The functions of HRM.
| Managerial Functions | Operative Functions |
|---|---|
| Planning | Employment |
| Organizing | HR Development |
| Directing | Compensation |
| Controlling | Human Relations |
| Industrial Relations | |
| Recent Trends in HRM |
Table 4.
Reference values for the MDUA item (Ref).
| Comparison of Mobile Telecom Operators—I | Comparison of Mobile Telecom Operators—II | |
|---|---|---|
| RefADD | 300 Mb/s | 134,22 Mb/s |
| RefADU | 150 Mb/s | 42.41 Mb/s |
| RefDEL | 10 ms | 40 ms |
Table 5.
Reference values for the MDMG item (Ref).
| Comparison of Mobile Telecom Operators—I | Comparison of Mobile Telecom Operators—II | |
|---|---|---|
| RefADD | 300 Mb/s | 68.59 Mb/s |
| RefADU | 150 Mb/s | 42.45 Mb/s |
| RefDEL | 10 ms | 49 ms |
Table 6.
Results of the surveys.
| Items | Results of Survey |
|---|---|
| DL speed | 20% |
| UL speed | 15% |
| Both equal | 65% |
| Latency | 0% |
Table 7.
Calculated items for the first approach.
| FMO | SMO | TMO | |
|---|---|---|---|
| MDUA | 0.0164 | 0.01323 | 0.01376 |
| MDMG | 0.017 | 0.00973 | 0.00761 |
| Total | 0.0334 | 0.02296 | 0.01986 |
Table 8.
Calculated items for the second approach.
| FMO | SMO | TMO | |
|---|---|---|---|
| MDUA | 0.04711 | 0.02064 | 0.02398 |
| MDMG | 0.05686 | 0.01245 | 0.01646 |
| Total | 0.104 | 0.03309 | 0.04044 |
Table 9.
The total potential of the observed telecom (according to the CTE model).
| I | II | III | IV | V | VI | VII | VIII | In Total |
|---|---|---|---|---|---|---|---|---|
| 0.50061 | 0.2048 | 0.4986 | 0.049 | 0.4181 | 0.292 | 0.1998 | 0.30498 | 2.46789 |
Publisher’s Note: MDPI stays neutral with regard to jurisdictional claims in published maps and institutional affiliations. |
© 2022 by the authors. Licensee MDPI, Basel, Switzerland. This article is an open access article distributed under the terms and conditions of the Creative Commons Attribution (CC BY) license (https://creativecommons.org/licenses/by/4.0/).
Share and Cite
MDPI and ACS Style
Jurčić, I.; Gotovac, S. A Comprehensive Techno-Economic Model for Fast and Reliable Analysis of the Telecom Operator Potentials. Appl. Sci. 2022, 12, 10658. https://doi.org/10.3390/app122010658
AMA Style
Jurčić I, Gotovac S. A Comprehensive Techno-Economic Model for Fast and Reliable Analysis of the Telecom Operator Potentials. Applied Sciences. 2022; 12(20):10658. https://doi.org/10.3390/app122010658
Chicago/Turabian StyleJurčić, Igor, and Sven Gotovac. 2022. "A Comprehensive Techno-Economic Model for Fast and Reliable Analysis of the Telecom Operator Potentials" Applied Sciences 12, no. 20: 10658. https://doi.org/10.3390/app122010658
Note that from the first issue of 2016, this journal uses article numbers instead of page numbers. See further details here.