The Effect of Heat Sink Properties on Solar Cell Cooling Systems
by
 , , and
Zainal Arifin
* ,
,
Suyitno Suyitno
 ,
,
Dominicus Danardono Dwi Prija Tjahjana
,
Wibawa Endra Juwana
,
Mufti Reza Aulia Putra
 and
and
Aditya Rio Prabowo

Department of Mechanical Engineering, Universitas Sebelas Maret, Jl. Ir., Sutami 36A, Central Java, Surakarta 57126, Indonesia
*
Author to whom correspondence should be addressed.
Appl. Sci. 2020, 10(21), 7919; https://doi.org/10.3390/app10217919
Submission received: 23 September 2020
/
Revised: 5 November 2020
/
Accepted: 5 November 2020
/
Published: 8 November 2020
Abstract
:High energy demand is leading to the replacement of fossil energy with renewable sources such as solar energy. Solar cells are devices used to generate solar energy. However, when exposed to sunlight with high intensity, a solar cell can suffer a decrease in performance due to overheating. This issue can be addressing by adding a cooling system. This study used a passive cooling system by adding a heat sink with fins to the body panel of the solar cell. The advantage of the passive cooling system is that it does not require additional energy. The number of fins and types of material were varied to obtain the best passive cooling system. The number of fins used was 5, 10, and 15, and the materials used were aluminum and copper. The wind speed vector and the temperature distribution were investigated through simulation. The results showed an increase in the number of fins provided better cooling capacity and increased the photovoltaic performance. The best cooling capability and performance were obtained using 15 fins with a copper base and fin heat sink materials. The decrease in temperature and the increase in efficiency were 10.2 °C and 2.74%, respectively. Therefore, the use of passive cooling system based on heat sinks with fins could provide a potential solution to increase performance and prevent overheating of photovoltaic (PV) panel systems.
1. Introduction
Energy demand continues to increase in line with the rise in human activity. Most energy is dependent on fossil energy in the form of coal, oil, and natural gas, which will eventually be depleted if continuously used [1]. Renewable energy is an alternative solution to overcome this problem. Renewable energy is produced from natural and sustainable sources of energy; sources include geothermal, water, wind, biomass, and solar energy. One form of renewable energy with development potential is solar energy, which is used as the form of energy generation in photovoltaic cells.
Three generations of solar cells exist. The first generation is silicon (Si) solar cells, which consist of monocrystals and polycrystals. The second generation is thin-film solar cells (thin film) and the third generation is dye-sensitized solar cells [2,3]. The first generation is the most widely used solar cell and has the highest efficiency. The efficiency of silicon solar cells is around 14–20% [4,5]. Parida conducted a comprehensive study of the types of solar cells and approaches to maintain their performance [4]. The performance of solar cells is affected by solar radiation and operating temperature. The operating temperature of solar cells can reach 88 °C at a solar intensity of 1000 W/m2. Excessive working temperatures of solar cells can cause a decrease in their performance. Each 1 °C increase above the working temperature of the solar cell causes a 0.4% decrease in efficiency [6].
This decrease in the efficiency of solar cells that results from increasing temperature can affect the performance of solar cells [7,8]. Cooling systems can increase the efficiency of solar cells [9]. Two types of solar cell cooling methods exist, namely, active and passive cooling. The reduction in the working temperature of solar cells using active cooling is 7.5 °C greater than that using passive cooling [10]. However, active cooling is less effective because it requires external input power, which reduces the overall efficiency of the solar cell system. Some of the passive cooling methods commonly used include adding heat sinks, adding a phase change material (PCM), and cooling solar cells with a floating system on water [10]. The addition of a heat sink to solar cells has the advantages of ease of manufacture and installation, and flexibility in the placement of solar cells. The addition of a heat sink can reduce the working temperature by up to 4.2% and increase the output power by up to 5.5% [11].
A better testing process can be implemented using a simulation method which is then verified by experiment or vice versa [12,13,14]. Research with a simulation method using ANSYS was undertaken by Popovici (2016) using an aluminum heat sink with perforated fins [15,16,17,18]. The holes in the fins aim to increase the natural convection wind release [14]. Heat sinks are usually made of copper or aluminum due to their good thermal conductivity values [16]. Thermal conductivity refers to the ability of a material to conduct heat. The thermal conductivity of copper is higher than that of aluminum [19]. This implies that the heat transfer of copper is faster than that of aluminum. To hasten heat transfer, heat sinks are equipped with perforated fins. This allows the wind to pass through so that it can release the heat into the environment [20].
Passive cooling system methods are an interesting research solution to the problem of overheating. The use of a passive cooling system requires adjustment of its parameters. Previous studies have not determined the effect of adding perforated fins and the use of alloy materials on heat sinks in passive cooling systems. Thus, the current research was conducted to obtain parameters for the addition of perforated fins and the use of several types of heat sink materials to achieve optimal performance for passive cooling systems. The increase in the number of perforated fins and the use of several types of materials in the heat sink are expected to increase the cooling system capability and to increase the performance of photovoltaic cells as a result of the improved heat transfer rate.
2. Literature Review
Solar cells are devices used to convert the energy produced by the sun into electricity. Solar cells were first developed in the early 19th century and have undergone development to date, resulting in three generations. The first generation used either mono-crystalline or poly-crystalline silicon (Si) semiconductors. First-generation solar cells have the highest efficiency compared to later generations. The second generation used thin-film solar cells (thin-film) which have the characteristics of light weight and flexibility due to their very low thickness. Second-generation solar cells are made of several semi-conductors such as Cadmium Telluride (CdTe) and Copper Indium Gallium Selenide (CIGS). The third generation is dye-sensitized solar cells, which are made using environmentally friendly raw materials and at a low cost. Third-generation solar cells have the lowest efficiency compared to other generations [21,22]. Of the various types of solar cells in circulation, first generation solar cells are the most widely used because they are cheaper and have the highest efficiency.
2.1. Active Cooling System
Active cooling in solar cells requires additional power assistance to provide power to the pumps, fans, and fluid flow. Active cooling uses the help of specific input power and can reduce the working temperature of solar cells by 7.5 °C. However, the use of this method has the disadvantage of requiring additional cooling components that require a power source. One approach is to use a fan. Fans are used to perform forced cooling of solar cell components. The cooling is caused by the air flow in the solar cell, however the fan requires a power source. Thus, the electricity required by the fan will consume the electricity generated by the solar cells. Passive cooling has a good cooling performance but is less efficient.
2.2. Passive Cooling System
Passive solar panel cooling has the advantage of not requiring additional power. Several researchers have conducted experiments with passive cooling, including the addition of a phase change material (PCM), passive cooling with a floating system on water, and using a heat sink on the panel. A heat sink will help prevent rising temperatures. To decrease the working temperature of the solar cell, copper heat sinks are generally given aluminum fins. The aluminum fins allow air to flow under the solar panels so that the heat generated is released into the environment. Research conducted by Ahmad (2017) reduced the working temperature by 6.1 °C and increased electrical efficiency by 1.77% by adding a flat aluminum plate behind the solar panel as a passive cooling device [23]. Research by H. Chen (2014) showed that the efficiency of solar cells can be increased due to a decrease in working temperature using the addition of cooling fins below the surface of the solar panel. The average efficiency of a solar panel using fins was 1.8% higher than that of a heat sink without fins [16]. The addition of fins on the solar panel increased the output power by about 5 W compared to a solar panel without fins [16].
Heat sinks are used as a tool in the cooling process of a system passively or without the help of other energy. In general, heat sinks are designed using materials that have the ability to absorb and dissipate heat well. Copper and aluminum are often used in the manufacture of heat sinks because they have good thermal conductivity values and, therefore, good thermal conductivity. Conversely, materials with lower thermal conductivity are more suitable as insulators [24,25]. Copper has a higher conductivity value than aluminum, thus, copper is better able to transfer heat [9,10]. This is evidenced by research conducted by Helen (2019) who compared the rate of heat transfer in glass, stainless steel, copper, plastic, and aluminum cups using heated water The natural convection heat transfer rate obtained the highest value, namely, copper glass of 55.15 watts, followed by aluminum, 29.44 watts; stainless steel, 2.28 watts; glass, 0.17 watts; and plastic, 0.016 watts [24].
The forced convection heat transfer rate is influenced by the magnitude of the thermal conductivity of the material and the forced fluid velocity. The more quickly the fluid is forced, the faster the heat transfer rate, thus, the time needed is shorter [24]. Increasing the number of fins increases the rate of heat dissipation.
As heat-conducting materials, copper and aluminum can be used in heat sinks. Fahendri (2014) compared heat sinks made of copper and aluminum on a microprocessor using MATLAB 7.0 software. Nodes were made of the heat sink to find the heat distribution equation using the finite difference method. The heat distribution is unstable at the heat sink using a time interval of 0.8 s with an iteration time step of the time observation of 1s, 2s, 5s, 10s, 25s, and equilibrium at 35 s. The variation in the color of the contour gradually decreases until thermal equilibrium is reached when iteration dt = 0.8 s at 35 s, where copper produces an average temperature of 59.91 °C and aluminum produces an average temperature of 59.84 °C. This proves that copper has better heat conductivity than aluminum, so is highly suitable for use as a material for making heat sinks. The use of copper can increase the heat dissipation capability of solar cells.
3. Brief Algorithm
Solar cells are commonly made of crystalline silicon, which can absorb photons from sunlight and release them as electrons. The flow of electric current is produced because a photoconductive cell receives sunlight. The characteristics of solar cells are known from the relationship between the current and the voltage generated on the I–V curve. Retrieval of I–V data uses a variable resistor. The I–V curve is obtained from the intensity of solar radiation which affects the current (I). Changes in solar cell temperature affect the voltage (V). Solar cells generate direct current (DC) electricity. The I–V curve is measured to obtain Open-Circuit Photovoltage (VOC), short-circuit photocurrent (Isc), fill factor (FF), and efficiency (η). Open circuit voltage (VOC) is the maximum voltage capacity when there is no current in the circuit. The maximum electric current when there is no resistance is called the short circuit current (ISC). The maximum power point (PMPP) is the point on the I–V curve. The comparison between the maximum power (PMPP) with VOC and ISC will produce an important parameter of solar cell performance, namely, the fill factor (FF) as shown in Equation (1).
A heat sink is a commonly used cooling device. Heat sinks generally have fins of varying sizes and shapes to release heat. The shape and size of the fins affect the efficiency of the heat sink which can be estimated by the ratio between the actual heat transfer rate and the ideal heat transfer rate. The ideal heat transfer rate condition is obtained when the entire surface of the fin has a constant initial temperature. The magnitude of the efficiency of the fin can be calculated using the approach shown in Equations (2) and (3) from Gardner [26]:
The effectiveness value (εfin) of a fin affects the heat sink heat dissipation ability. A heat sink is effective when heat transfer has effectiveness (εfin) > 1. This is calculated by Equation (4). Solar panel efficiency (η) is the ratio between the maximum powers (PMPP) to the power from solar radiation received by the solar panel (Plight). Solar radiation power (Plight) is the product of sunlight intensity (Irad) and the active area of the solar panel (A). Solar panels have good efficiency, so the power generated will be maximized. The panel efficiency can be calculated by Equation (5).
Modeling is a way of simplifying research. This can be achieved by the use of Computational Fluid Dynamics (CFD), a program that allows numerical analysis or simulation of an event or fluid behavior. CFD settlement is performed computationally by a computer program [27]. Fluid flow modeling is based on the laws of conservation of energy and mass as following discussions.
3.1. Steady Flow
Steady flow indicates fluid flow does not change with time.
3.2. Incompressible Flow
The flow is said to be incompressible if the density ( of the fluid is constant, which means that there is no change in the density value with the flow. Air fluid is considered incompressible if its flow velocity is below 100 m/s [28]. The three-dimensional incompressible fluid flow is stated in Equation (6).
3.3. The Continuity Equation
The law of mass conservation states that mass cannot be created or destroyed, that, at steady flow, the amount of mass in the control volume is constant and can be expressed as in Equation (7), where the speed vector in the x direction is u and the vector speed in the y direction is v.
3.4. Navier–Stokes Equation
This equation is the momentum equation for viscous, incompressible, and constant velocity flow, where density is
This study used the ANSYS Fluent program. This program can model cases of natural convection heat transfer using the finite volume method in a closed system, which means that mass is constant. Steady-state modeling was used to study free convection flow in the heat sink model. This program can also simulate solar radiation acting on solar panels using the Solar Ray Tracing tool [29]. The existing equation shows that increasing the efficiency of solar cells can be achieved by adding a cooling system. High efficiency can provide a good cooling system. Increasing cooling capability can be achieved by adding a heat sink. The heat sink geometry also affects cooling capability. The material and number of fins used in the heat sink need to be considered. The solar cell working temperature will affect performance and efficiency [15,16,17,18]. Increasing temperature can be caused by a reverse saturation current. The increase in temperature can be countered by the heat transfer system [30,31,32,33]. The material used will affect the cooling performance [15,16,17,18]. Increasing the number of fins and holes will have a considerable effect on cooling capability [34,35].
4. Methods
4.1. Solar Cell
4.2. Cooling System
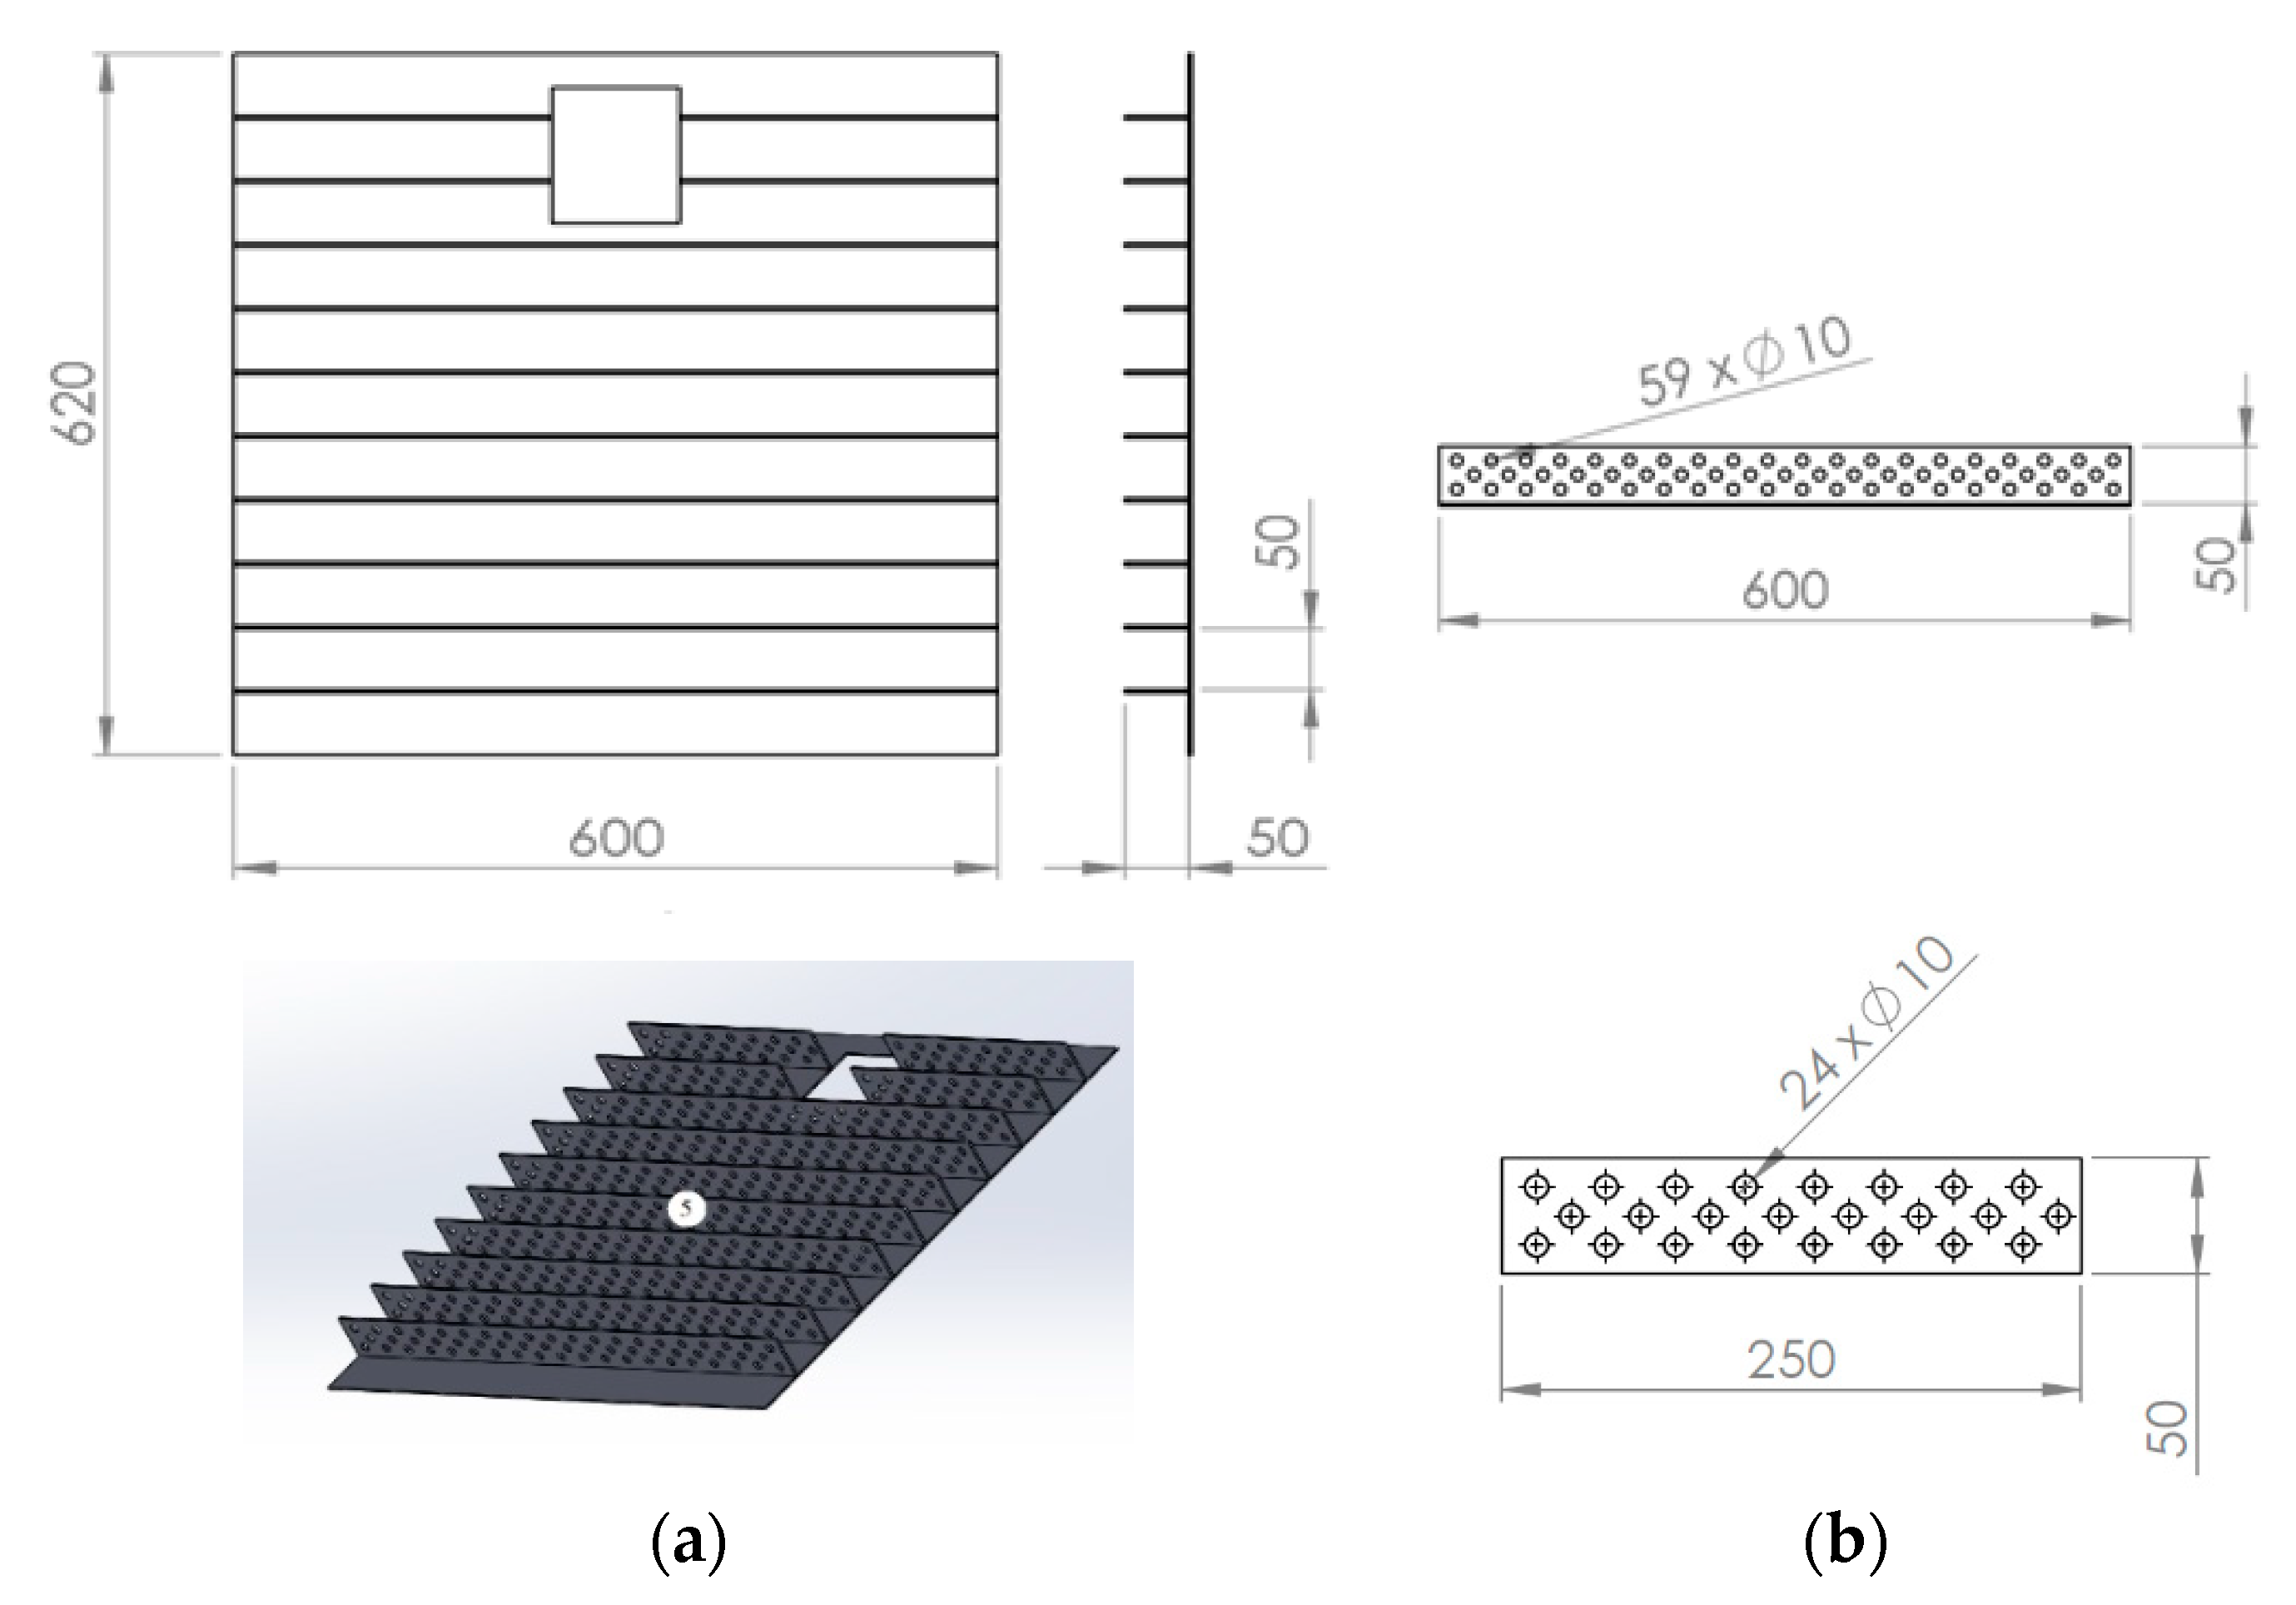
Heat absorption can be performed by a heat sink. The heat sink used is 2 mm thick at the base and the fins are 3 mm thick. The heat sink has the dimensions according to Figure 1a. This study used the perforated fins shown in Figure 1b. In addition to making changes to the material used, the number of fins used was also studied. The number of fins used was 5, 10, and 15.
4.3. Experimental Setup
Measurements of currents and voltages were conducted using a Multimeter Heles UX838-TR. The variable resistor is used for data collection at each intensity. The purpose of using a variable resistor is to produce current and voltage at each intensity. The current and voltage will form an I–V graph. The amount of resistance is determined based on the specification graph on the Len 50 Wp solar panel. The value is 0; 2.5; 3.5; 4.7; 5.4; 5.8; 6; 6.4; 6.6; 6.9; 7.4; 8.5; 13.8; 19.6; 42.5; 111 and 330 Ω. The data will be processed to produce Voc, Isc, maximum power, efficiency, and fill factor values. The intensity of solar radiation was measured using a Lutron SPM-1116SD Solar Power Meter. The wind flow was set perpendicular to the fins on the heat sink. Wind speed was set constant at 1.5 m/s. The temperature was measured using a K-type thermocouple as shown in Figure 2 and the experimental process is shown in Figure 3. The measurements start at 07.30 AM where the intensity is 400 W/m2. Under 400 W/m2 intensity appears in the early morning and the use of solar cells is effective in the morning until afternoon.
5. Tendency of Heat Sink Properties
The heat sink material affects the performance of solar cells. Furthermore, the high working temperature of solar panels affects their performance [27]. Heat resulting from solar radiation is released into the environment using a heat sink [11]. Heat dissipation by the heat sink is influenced by the value of its thermal conductivity. Furthermore, the contact area affects the amount of heat generated. Increasing the number of fins increases the contact area with the air. Figure 4 shows the lower working temperature as the number of fins increased using Cu-Al materials. Each variation of the experiment results in a different level of efficiency. Increasing the working temperature resulted in a decrease in solar panel efficiency. The use of 15 fins resulted in the lowest working temperature of 55.4 °C. The highest working temperature was 64.6 °C which result from the use of 15 fins. Using 10 fins resulted in a temperature that was 2.1 °C lower than that achieved with 5 fins. Fifteen fins achieved a working temperature that was 1.2 °C lower than that achieved with 10 fins. The addition of 5 fins provided a higher impact than the changes made to the material used. The results of the experimental method and the simulation of the temperature decrease trend are similar. Figure 5 shows the comparison between the modeling trend and the experimental trend.
Increasing the cooling capacity increased the efficiency of solar panels. The efficiency of solar panels with fins can be seen in Figure 6. The greater the number of fins used, the better the cooling performance obtained. As a result, good cooling increased the efficiency. A change in efficiency occurred when 5 and 10 fins increased efficiency by 0.61%. The use of 15 fins was only able to increase efficiency by 0.21%. This difference in increase can be caused by differences in the Isc and Voc values in the temperature range of 55–61 °C. The addition of the number of fins may cause turbulence of the airflow that occurs in the heat sink. This turbulence increases the volume of air flowing on the surface of the heat sink. Contact between the fins and air causes heat dissipation. Figure 7 shows that the greater the number of fins, the more heat dissipation occurs. Heat dissipation is affected by the cross-sectional area of the heat-releasing component. The area in contact with air increases with the rise in the number of fins. The constant increase is due to the smaller air contact gap that occurs. As a result, the effect of the addition of fins is similar to that of increasing the thickness of the base, which leads to poor heat dissipation.
Increasing from 5 to 10 fins has a better effect than increasing from 10 to 15 fins. This is because increasing the number of fins increases the contact area with air. However, when the gap between the fins is narrow, air passes too quickly over the surface of the fins. The shorter the contact, the less effective the heat dissipation. In addition to the number of fins, the material used also affects cooling performance. Research on the use of materials was conducted using 10 fins, where the improvement from 5 to 10 fins was greater than that of the increase from 10 fins to 15 fins. Figure 8 shows the heat sink with Cu-Cu material has the lowest temperature of 53.7 °C. The highest temperature was obtained in Al-Al material with a temperature of 59.0 °C. The conductivity value of copper is higher than that of aluminum. In general, the higher the conductivity value, the higher the ability to transfer heat. The resulting temperature difference for each material combination was not too large. The temperature drop that occurs between the highest and lowest conditions was 5.3 °C. Changes in conductivity values will be effective in extreme heat conditions.
The cooling capacity is affected by the conductivity value of the materials. The cooling capability affects the value of the short circuit current (Isc) and open-circuit voltage (Voc). Isc and Voc values affect the efficiency of the solar cell. Moreover, the copper-copper material has the lowest temperature, which affects the resulting Voc and Isc values. The lower the temperature value, the higher the Voc and Isc values. Figure 9 and Figure 10 show the effect of cooling on the Isc value. Changes in the Isc and Voc values affect the power generated by the solar cell. The increase in power changes the efficiency of the solar cell.
The increase in power is influenced by changes in the Isc and Voc values. The current generated by solar cells is influenced by the intensity of light. Figure 11 shows that low temperatures produced the highest Isc and Voc. The copper-copper material produces the highest Isc and Voc.
Heat sinks in solar panels can increase the rate of heat transfer from solar panels to the surrounding air. The use of a heat sink with Al-Al can reduce the temperature by up to 5.4 °C compared to a solar panel without cooling. The temperature drop for the use of Al-Cu, Cu-Al, and Cu-Cu heat sinks is 6.9, 9.0, and 10.9 °C, respectively. The decrease that occurs between materials is not too significant. Figure 12 shows the best efficiency found for copper-copper materials. Copper-copper heat sinks had the best efficiency at all test intensities. This is influenced by the higher thermal conductivity value of copper than aluminum.
The trend of decreasing temperature due to the addition of a heat sink is shown by the modeling results. The simulation results show that the copper material provided better cooling than aluminum. The temperature change from the simulation results is shown in Figure 13. The material changes made can reduce the working temperature of the solar cell. However, material changes did not result in significant differences in results. Another means of increasing the cooling capacity is by expanding the contact area. The expansion of this heat transfer area will increase the rate of transfer by conduction and convection from the solar panels to the surrounding environment.
The application of a passive cooling system can reduce the working temperature. The temperature greatly affects the efficiency of a solar cell. The receipt of excessive light intensity by the solar cell results in more energy being converted into heat which affects the solar cell’s ability. The use of the right parameters provides good cooling performance. The material of the heat sink affects its cooling ability during operation. However, the influence of the material is not significant. The effect of the material is highly influenced by the material’s conductivity. When the material indicates an increase in temperature, the material’s conductivity properties decrease. In the case of a less extreme temperature increase, the change in conductivity was smaller. The number of fins used has a greater impact on heat dissipation performance. The use of a large number of fins expands the contact area with air. This improved the existing cooling performance. The use of a copper-copper heat sink with 15 fins was the best heat sink combination in this study.
Table 2 shows that the addition of fins affects the performance of solar panels. The increase in efficiency from 5 to 10 fins was 0.61%, whereas the increase in efficiency from 10 to 15 fins was 0.21%. The increase in efficiency from 5 to 10 fins was better than that from 10 to 15 fins. This difference existed because 10 fins have better air circulation than 15 fins. A narrow fin gap can reduce the air circulation of the heat sink, as shown by the simulation results of the airflow rate that occurs in the heat sink. The intensity of 1100 W/m2 produces the highest temperature. With this intensity, the use of a cooling system is clearly needed.
Table 3 shows efficiency changes at each intensity. The intensity will affect the temperature of the solar cell. The use of a cooling system is to maintain the efficiency change caused by temperature. After the 800 W/m2 intensity, the cooling capacity is lower than the heat generated.
Table 4 shows that the effect of the combination of materials affected the amount of heat transfer. The thermal conductivity, surface area, and thickness of the material affect the conduction heat transfer. Cu-Cu heat sinks have the highest heat transfer rate. At an intensity of 1100 W/m2, the heat sink with the Cu-Cu material has the lowest temperature, of 53.70 °C. High thermal conductivity materials can accelerate the rate of heat transfer by conduction, thus reducing the temperature of the solar panels. For comparison, the use of each intensity value causes a change in solar cell performance. This change in performance occurs due to the heat generated. As shown in Table 4, the highest temperature occurs at intensity of 1100 W/m2.
Table 5 shows a change in efficiency changes at each intensity. The higher the intensity received, the higher the working temperature of the solar cell. The use of a cooling system will result in not much difference in efficiency values. The decrease in efficiency only occurred after the intensity of 1000 W/m2. At an intensity of 1000 W/m2, this means that the additional cooling capacity that has been given has been exceeded.
6. Conclusions
Solar cell performance is influenced by the working temperature. The ideal working temperature can be maintained by adding a cooling system to the solar cell panel. The addition of a heat sink with perforated fins improves the cooling process. The type of base material and fins used on the heat sink also affect the cooling capability. The results of the modelling and experiment show that the use of a heat sink with perforated fins can significantly reduce temperature and increase performance. Furthermore, the use of a combination of heat sink materials from aluminum and copper did not significantly affect temperature reduction and increased performance. The use of heat sinks with 5, 10, and 15 fins provided excellent cooling. The increase in the number of fins provided better cooling capacity and increased the photovoltaic performance. The best cooling capability and performance were obtained by using 15 fins with a copper base and fin heat sink materials. The achieved decrease in temperature and increase in efficiency were 10.2 °C and 2.74%, respectively.
Author Contributions
Conceptualization, Z.A., S.S., and D.D.D.P.T.; methodology, W.E.J. and Z.A.; software, D.D.D.P.T. and A.R.P.; validation, S.S.; formal analysis, Z.A., S.S. and D.D.D.P.T.; investigation, W.E.J. and Z.A.; resources, Z.A., S.S. and D.D.D.P.T.; data curation, Z.A., S.S. and D.D.D.P.T.; writing—Original draft preparation, M.R.A.P., Z.A. and A.R.P.; writing—Review and editing, M.R.A.P., A.R.P. and Z.A.; visualization, M.R.A.P.; supervision, Z.A.; project administration, Z.A.; funding acquisition, Z.A., S.S. and D.D.D.P.T. All authors have read and agreed to the published version of the manuscript.
Funding
This research received research grant of Hibah Mandatory-PNBP No. 452/UN27.11/PN/2020 and Hibah Penelitian Dasar Unggulan Perguruan Tinggi (PDUPT) 2020, contract number: 112/UN.27.21/HK/2020.
Acknowledgments
The authors thank the Rector of Universitas Sebelas Maret (UNS) and DRPM Kemenristek/BRIN for financial support.
Conflicts of Interest
The authors declare no conflict of interest.
Nomenclature
| Voc | Open circuit voltage (V) | Greek symbols | |
| Isc | Short circuit current (A) | εfin | Fin effectiveness (%) |
| V | Voltage (V) | η | Efficiency (%) |
| I | Current (A) | Density (Kg/m3) | |
| PMPP | Maximum power point (Wp) | ||
| w | Wide (m) | ||
| L | Length (m) | ||
| t | Thick (m) | ||
| Plight | Solar radiation power (W) | ||
| Irad | Sunlight intensity (W/m2) | ||
| Q | Calorie (Cal) | ||
| T | Temperature (°C) | ||
| FF | Fill factor |
References
- Kholiq, I. Pemanfaatan energi alternatif sebagai energi terbarukan untuk mendukung subtitusi bbm. J. IPTEK 2015, 19, 75–91. [Google Scholar]
- Kibria, M.T.; Ahammed, A.; Sony, S.M.; Hossain, F. A Review: Comparative studies on different generation solar cells technology. In Proceedings of the 5th International Conference on Environmental Aspects of Bangladesh, Dhaka, Bangladesh, 5–6 September 2014; pp. 51–53. [Google Scholar]
- Wang, X.; Barnett, A. The Evolving Value of Photovoltaic Module Efficiency. Appl. Sci. 2019, 9, 1227. [Google Scholar] [CrossRef] [Green Version]
- Parida, B.; Iniyan, S.; Goic, R. A review of solar photovoltaic technologies. Renew. Sustain. Energy Rev. 2011, 15, 1625–1636. [Google Scholar] [CrossRef]
- Teo, H.; Lee, P.; Hawlader, M. An active cooling system for photovoltaic modules. Appl. Energy 2012, 90, 309–315. [Google Scholar] [CrossRef]
- Houssamo, I.; Locment, F.; Sechilariu, M. Maximum power tracking for photovoltaic power system: Development and experimental comparison of two algorithms. Renew. Energy 2010, 35, 2381–2387. [Google Scholar] [CrossRef]
- Sara, I.D.; Sari, L.H. Pengaruh Heatsink Terhadap Kinerja Modul Surya. Jurnal Nasional Komputasi dan Teknologi Informasi 2019, 2, 13–18. [Google Scholar] [CrossRef]
- Zsiborács, H.; Baranyai, N.H.; Vincze, A.; Háber, I.; Weihs, P.; Oswald, S.; Gützer, C.; Pintér, G. Changes of Photovoltaic Performance as a Function of Positioning Relative to the Focus Points of a Concentrator PV Module: Case Study. Appl. Sci. 2019, 9, 3392. [Google Scholar] [CrossRef] [Green Version]
- Reddy, S.R.; Ebadian, M.A.; Lin, C.-X. A review of PV–T systems: Thermal management and efficiency with single phase cooling. Int. J. Heat Mass Transf. 2015, 91, 861–871. [Google Scholar] [CrossRef]
- Hasanuzzaman, M.; Malek, A.; Islam, M.; Pandey, A.; Rahim, N. Global advancement of cooling technologies for PV systems: A review. Sol. Energy 2016, 137, 25–45. [Google Scholar] [CrossRef]
- Gotmare, J.A.; Borkar, D.S.; Hatwar, P.R. Experimental Investigation of Pv Panel with Fin Cooling under Natural Convection. Int. J. Adv. Technol. Eng. Sci. 2015, 3, 447–454. [Google Scholar]
- Harsanto, A.B. Simulasi CFD Perpindahan Panas Pada Heatsink Mikroprosesor. Agritek 2011, 12, 1–5. [Google Scholar]
- Mulyanto, A. Perbandingan Konduktivitastembaga, Baja Dan Aluminium. Dinamika Teknik Mesin 2011, 1, 2–4. [Google Scholar] [CrossRef] [Green Version]
- Jassem, R.R. Effect the Form of Perforation on the Heat Transfer in the Perforated Fins. Acad. Res. Int. 2013, 4, 198–207. [Google Scholar]
- Bergman, T.L.; Lavine, A.S.; Incropera, F.P.; Dewitt, D.P. Fundamentals of Heat and Mass Transfer; John Wiley & Sons: New York, NY, USA, 2011. [Google Scholar]
- Cengel, Y.A. Heat Transfer: A Practical Approach, 2nd ed; Mc Graw Hill: Boston, MA, USA, 2003. [Google Scholar]
- Singh, P.; Ravindra, N. Temperature dependence of solar cell performance—An analysis. Sol. Energy Mater. Sol. Cells 2012, 101, 36–45. [Google Scholar] [CrossRef]
- Karki, I.B. Effect of Temperature on the I-V Characteristics of a Polycrystalline Solar Cell. J. Nepal Phys. Soc. 2016, 3, 35–40. [Google Scholar] [CrossRef] [Green Version]
- Chen, H.; Chen, X.; Li, S.; Ding, H. Comparative study on the performance improvement of photovoltaic panel with passive cooling under natural ventilation. Int. J. Smart Grid Clean Energy 2014, 374–379. [Google Scholar] [CrossRef] [Green Version]
- Riupassa, H.; Girik, W. Analisis Konveksi Alami Dan Paksa Dengan Variasi Material. Jurnal Teknik Mesin 2019, 8, 39–48. [Google Scholar]
- Arifin, Z.; Suyitno, S.; Hadi, S.; Sutanto, B. Improved Performance of Dye-Sensitized Solar Cells with TiO2 Nanoparticles/Zn-Doped TiO2 Hollow Fiber Photoanodes. Energies 2018, 11, 2922. [Google Scholar] [CrossRef] [Green Version]
- Kung, C.-Y.; Yang, C.-H.; Huang, C.-W.; Lien, S.-Y.; Zhu, W.-Z.; Lin, H.-J.; Zhang, X. Performance Improvement of High Efficiency Mono-Crystalline Silicon Solar Cells by Modifying Rear-Side Morphology. Appl. Sci. 2017, 7, 410. [Google Scholar] [CrossRef] [Green Version]
- Fahendri, F. Analisa Numerik Distribusi Panas Tak Tuntas Pada Heatsink Menggunakan Metoda Finite Different. Pillar Phys. 2014, 2, 81–88. [Google Scholar]
- Yusuf, A. Aerodynamic Analysis and Smart Ev Third Generation Car Optimization Using Three Dimensional CFD Modeling; Universitas Sebelas Maret: Surakarta, Indonesia, 2017. [Google Scholar]
- Appelbaum, J.; Maor, T. Dependence of PV Module Temperature on Incident Time-Dependent Solar Spectrum. Appl. Sci. 2020, 10, 914. [Google Scholar] [CrossRef] [Green Version]
- Sutanto, B. Computational fluid dynamic (CFD) modelling of floating photovoltaic cooling system with loop thermosiphon. AIP Conf. Proc. 2019, 2062, 020011. [Google Scholar] [CrossRef]
- Wu, S.; Xiong, C. Passive cooling technology for photovoltaic panels for domestic houses. Int. J. Low Carbon Technol. 2014, 9, 118–126. [Google Scholar] [CrossRef] [Green Version]
- Kim, J.-H.; Park, S.-H.; Kim, J.-T. Experimental Performance of a Photovoltaic-thermal Air Collector. Energy Procedia 2014, 48, 888–894. [Google Scholar] [CrossRef] [Green Version]
- El Mays, A.; Ammar, R.; Hawa, M.; Akroush, M.A.; Hachem, F.; Khaled, M.; Ramadan, M. Improving Photovoltaic Panel Using Finned Plate of Aluminum. Energy Procedia 2017, 119, 812–817. [Google Scholar] [CrossRef]
- Guardian, I.; Sutanto, B.; Rachmanto, R.A.; Hadi, S.; Arifin, Z. Improving the Performance of Photovoltaic Panels by Using Aluminum Heat Sink. In Proceedings of the 6th International Conference and Exhibition on Sustainable Energy and Advanced Materials, Surakarta, Indonesia, 16–17 October 2020; pp. 437–448. [Google Scholar] [CrossRef]
- Rahman, M.; Hasanuzzaman, M.; Rahim, N. Effects of various parameters on PV-module power and efficiency. Energy Convers. Manag. 2015, 103, 348–358. [Google Scholar] [CrossRef]
- Nadda, R.; Kumar, A.; Maithani, R. Efficiency improvement of solar photovoltaic/solar air collectors by using impingement jets: A review. Renew. Sustain. Energy Rev. 2018, 93, 331–353. [Google Scholar] [CrossRef]
- Klugmann-Radziemska, E. Thermal performance of Si and GaAs based solar cells and modules: A review. Prog. Energy Combust. Sci. 2003, 29, 407–424. [Google Scholar] [CrossRef]
- Jiang, J.-A.; Wang, J.-C.; Kuo, K.-C.; Su, Y.-L.; Shieh, J.-C.; Chou, J.-J. Analysis of the junction temperature and thermal characteristics of photovoltaic modules under various operation conditions. Energy 2012, 44, 292–301. [Google Scholar] [CrossRef]
- Tobnaghi, D.M.; Madatov, R.; Farhadi, P. Investigation of light intensity and temperature dependency of solar cells electric parameters. Electr. Power Eng. Control Syst. 2013, 21–23. Available online: http://ena.lp.edu.ua:8080/handle/ntb/26855 (accessed on 22 September 2020).
Figure 1.
Dimension of (a) heat sink, (b) fin.

Figure 2.
Experimental setup.

Figure 3.
Experimental process: (a) Laptop, (b) Adam data logger, (c) solar power meter, (d) amperemeter and voltmeter, (e) variable resistor, (f) photovoltaic (PV) with heat sinks, (g) PV without heat sinks, (h) anemometer, and (i) fan blower.
Figure 3.
Experimental process: (a) Laptop, (b) Adam data logger, (c) solar power meter, (d) amperemeter and voltmeter, (e) variable resistor, (f) photovoltaic (PV) with heat sinks, (g) PV without heat sinks, (h) anemometer, and (i) fan blower.

Figure 4.
Relationship of solar radiation intensity to working temperature.

Figure 5.
Experimental vs. modeling.

Figure 6.
Graph of the relationship between working temperature and efficiency.

Figure 7.
Wind speed vector (a) without cooling (b) no fins, (c) 5 fins, (d) 10 fins, and (e) 15 fins.
Figure 7.
Wind speed vector (a) without cooling (b) no fins, (c) 5 fins, (d) 10 fins, and (e) 15 fins.

Figure 8.
The relationship between solar intensity and temperature of photovoltaic solar panels.

Figure 9.
Isc from the material change.

Figure 10.
VOC from the material change.

Figure 11.
The effect of changing the power (Isc vs. Voc) on any change in material.

Figure 12.
Efficiency vs. temperature change.

Figure 13.
Modelling vs. experiment.


Table 1.
Len 50 Wp solar module specifications.
| Specifications | Value |
|---|---|
| Solar panels | Poly-crystalline 62.4 × 156 mm |
| Open-circuit voltage (VOC) | 21.2 V |
| Short-circuit current (ISC) | 3.35 A |
| Maximum power (PMPP) | 50 Wp |
| Efficiency | 14% |
| Operating module temperature | −40 to 85 °C |
| Dimensions | 655 × 670 × 25 mm |
| Temperature coefficient of power | −0.44%/°C |
Table 2.
Temperature and efficiency of the solar cell.
| Variation | Intensity (W/m2) | Temperature (°C) | Voc (V) | Isc (A) | Fill Factor (-) | Efficiency (%) | Error (%) |
|---|---|---|---|---|---|---|---|
| Without cooling | 1100 | 64.6 | 19.2 | 2.81 | 2.81 | 9.5 | 9.95 |
| No fin heat sink | 1100 | 61.6 | 19.4 | 2.86 | 2.86 | 10.55 | 7.62 |
| 5 fin heat sink | 1100 | 57.7 | 19.5 | 3 | 3 | 11.42 | 5.07 |
| 10 fin heat sink | 1100 | 55.6 | 19.6 | 3.12 | 3.12 | 12.03 | 1.72 |
| 15 fin heat sink | 1100 | 54.4 | 19.7 | 3.18 | 3.18 | 12.24 | 1.75 |
Table 3.
Temperature and efficiency of the solar cell with a Cu-Al heat sink with 10 fins.
| Intensity (W/m2) | Temperature (°C) | Voc (V) | Isc (A) | Fill Factor (-) | Efficiency (%) | Error (%) |
|---|---|---|---|---|---|---|
| 400 | 32.3 | 20.7 | 1.25 | 0.69 | 12.86 | 2.38 |
| 500 | 37.2 | 20.4 | 1.41 | 0.76 | 12.56 | 0.39 |
| 600 | 40 | 20.4 | 1.7 | 0.71 | 12.61 | 6.17 |
| 700 | 45 | 20.2 | 2.18 | 0.74 | 13.44 | 1.17 |
| 800 | 48.7 | 20.1 | 2.54 | 0.75 | 13.6 | 1.19 |
| 900 | 50.9 | 19.9 | 2.81 | 0.76 | 13.44 | 5.24 |
| 1000 | 53.5 | 19.7 | 2.95 | 0.77 | 12.77 | 6.15 |
| 1100 | 55.6 | 19.6 | 3.12 | 0.76 | 12.03 | 5.79 |
Table 4.
Temperature and efficiency of the solar cell with a 10-fin heat sink.
| Variation | Intensity (W/m2) | Temperature (°C) | Voc (V) | Isc (A) | Fill Factor (-) | Efficiency (%) | Error (%) |
|---|---|---|---|---|---|---|---|
| Cu-Cu | 1100 | 53.7 | 19.8 | 3.15 | 0.78 | 12.92 | 1.01 |
| Cu-Al | 1100 | 55.6 | 19.7 | 3.12 | 0.76 | 12.79 | 5.70 |
| Al-Cu | 1100 | 57.6 | 19.6 | 3.11 | 0.75 | 12.1 | 1.85 |
| Al-Al | 1100 | 59.1 | 19.6 | 3.1 | 0.75 | 11.88 | 1.81 |
Table 5.
Temperature and efficiency of the solar cell with a 10-fin Cu-Cu heat sink.
| Intensity (W/m2) | Temperature (°C) | Voc (V) | Isc (A) | Fill Factor (-) | Efficiency (%) | Error (%) |
|---|---|---|---|---|---|---|
| 400 | 31 | 20.7 | 1.38 | 0.66 | 13.54 | 0.67 |
| 500 | 35.5 | 20.5 | 1.58 | 0.72 | 13.45 | 0.52 |
| 600 | 37.9 | 20.5 | 1.93 | 0.7 | 13.38 | 0.90 |
| 700 | 42.4 | 20.3 | 2.24 | 0.72 | 13.26 | 0.75 |
| 800 | 44.6 | 20.1 | 2.55 | 0.72 | 13.36 | 2.12 |
| 900 | 48.9 | 19.9 | 2.88 | 0.75 | 13.65 | 6.72 |
| 1000 | 52.4 | 19.8 | 2.99 | 0.76 | 12.79 | 1.01 |
| 1100 | 53.7 | 19.8 | 3.15 | 0.78 | 12.92 | 1.02 |
Publisher’s Note: MDPI stays neutral with regard to jurisdictional claims in published maps and institutional affiliations. |
© 2020 by the authors. Licensee MDPI, Basel, Switzerland. This article is an open access article distributed under the terms and conditions of the Creative Commons Attribution (CC BY) license (http://creativecommons.org/licenses/by/4.0/).
Share and Cite
MDPI and ACS Style
Arifin, Z.; Suyitno, S.; Tjahjana, D.D.D.P.; Juwana, W.E.; Putra, M.R.A.; Prabowo, A.R. The Effect of Heat Sink Properties on Solar Cell Cooling Systems. Appl. Sci. 2020, 10, 7919. https://doi.org/10.3390/app10217919
AMA Style
Arifin Z, Suyitno S, Tjahjana DDDP, Juwana WE, Putra MRA, Prabowo AR. The Effect of Heat Sink Properties on Solar Cell Cooling Systems. Applied Sciences. 2020; 10(21):7919. https://doi.org/10.3390/app10217919
Chicago/Turabian StyleArifin, Zainal, Suyitno Suyitno, Dominicus Danardono Dwi Prija Tjahjana, Wibawa Endra Juwana, Mufti Reza Aulia Putra, and Aditya Rio Prabowo. 2020. "The Effect of Heat Sink Properties on Solar Cell Cooling Systems" Applied Sciences 10, no. 21: 7919. https://doi.org/10.3390/app10217919
Note that from the first issue of 2016, this journal uses article numbers instead of page numbers. See further details here.