Failure Diagnosis of Demagnetization in Interior Permanent Magnet Synchronous Motors Using Vibration Characteristics

Division of Electronics and Informatics, Gunma University, Kiryu, Gunma 376-8515, Japan
*
Author to whom correspondence should be addressed.
Appl. Sci. 2019, 9(15), 3111; https://doi.org/10.3390/app9153111
Submission received: 30 June 2019
/
Revised: 28 July 2019
/
Accepted: 29 July 2019
/
Published: 1 August 2019
(This article belongs to the Special Issue Fault Diagnosis of Rotating Machine)
Abstract
:The detection of a precursor to the demagnetization of permanent magnets is very important because a high degree of reliability is necessary in permanent magnet synchronous motors (PMSMs). This paper investigated the diagnosis of very slight PM demagnetization. A part of the permanent magnet was altered to non-magnetic material so as to mimic the effect of demagnetization. The vibration characteristics were clarified for low demagnetization in PMSMs driven under vector control by experiments and 3D finite element (FE) analysis. We found that the amplitude of some components of the vibration was approximately proportional to the demagnetization level of the PM and the load torque. Therefore, the measurement of vibration and torque is very useful for the estimation of the magnetization level of PMSMs under vector control except for under very light load.
1. Introduction
Permanent magnet synchronous motors (PMSMs) have been used in many industrial fields, such as manufacturing systems, air conditioners, robots, hybrid vehicles, electric vehicles, and so on, and a high degree of reliability is necessary to them. However, since PMSMs work under various stresses affected by the power supply and load conditions, several faults can occur in the motors during long-term, continuous operation. If they cannot be diagnosed, they may cause serious damage. Therefore, it is very important to study fault detection and diagnosis technology for PMSMs. A review of faults and diagnosis methods of PMSMs was previously presented [1]. In the reference, faults in PMSMs were classified into electrical faults, mechanical faults, and magnetic faults [2]. Electrical faults are the incorrect connection of the motor windings, grounding errors, short circuits in the stator phase windings, and open circuits in the whole phase. Mechanical faults are damage to the magnet, bending of the shaft, loosening of the bolts, bearing faults, and air gap eccentricity. Magnetic faults are demagnetization faults and are unique in PMSMs. This paper addresses demagnetization faults. Permanent magnets in PMSMs can become demagnetized due to high levels of temperature, large stator currents, large short-circuit currents produced by inverter or stator faults, and aging of the magnet itself. Moreover, since PM material is often magnetized after it is inserted into the rotor assembly, there is a possibility that the PM is not in a state of complete magnetization.
There have been several studies on failure diagnosis in electric motors. For example, diagnosis of bearing faults has been reported [3,4,5,6]; diagnosis of unbalanced rotors or broken rotor bars in induction motors has been reported [7,8,9,10,11,12,13]; and diagnosis for DC commutator motors has been reported [14,15]. For PM motors, Rotor Position Error, Winding Short-Circuit Fault, and Rotor Eccentricity, among others, have been reported [16,17,18,19,20]. Moreover, for the situation of PMs, there have been several research studies on detecting demagnetization in PMs and estimating PM temperature. In [21], the authors reviewed demagnetization faults using index-extracting techniques in PMSMs. Rajagopalan et al. [22] created a magnet defect by chipping off a part of the magnet and then measured the stator current. The authors of [23] estimated PM magnetization using the stator current, zero-sequence voltage, and back electromotive force. Torregrossa et al. [24] investigated the impact of partial demagnetization and static eccentricity on the force distribution, vibration, and acoustic behavior of a PMSM. In [25], the authors estimated the magnetization using the back electromotive force, while the authors of [26] studied the vibration acceleration to detect partial demagnetization and inter-turn short circuits. Alameh et al. [27] simulated a vibration-based fault detection and diagnosis technique for PMSMs. The faults included rotor eccentricity, rotor PM demagnetization, and stator inter-turn short circuits, where demagnetization fault was defined as a decrease in the residual flux density of the PMs. The authors of [28] proposed the use of torque ripple for online PM demagnetization fault diagnosis using continuous wavelet transforms (CWT) and grey system theory. Wallscheid et al. [29] reviewed the existing methods for indirect model-based determination of PM temperature. Since the volume of PMs was decreased by 16.7% in [22,23], and the volume of PMs was partially decreased by about 11% in [26], the degree of PM demagnetization was relatively large. It would be preferable to be able to detect the onset of demagnetization to provide the user with advance notice that the magnet is beginning to demagnetize. In order to deal with a less advanced demagnetization situation, the authors reduced the volume of PMs by 2.5%, 5.0%, and 7.5% in separate experiments [30] and then investigated several variables for the diagnosis of lower demagnetization in interior PMSMs (IPMSMs) by simulations and experiments, namely, the electromotive force and the stator voltage [31]. Moreover, although most PMSMs are driven under a vector control strategy, previous studies [21,22,23,24,25,26,27,28,29] did not consider the machine running under vector control.
This paper investigated the vibration characteristics of IPMSMs with demagnetized PMs driven under vector control by way of experiments and 3-D FE analyses. Only the PMs of one pole were altered to non-magnetic material so as to mimic the effect of demagnetization. This means that this paper investigated asymmetric partial demagnetization, that is, the same as in [22,23,26]. Moreover, this paper estimated the level of demagnetization by using some components of vibration.
2. Experimental PMSM with Demagnetization
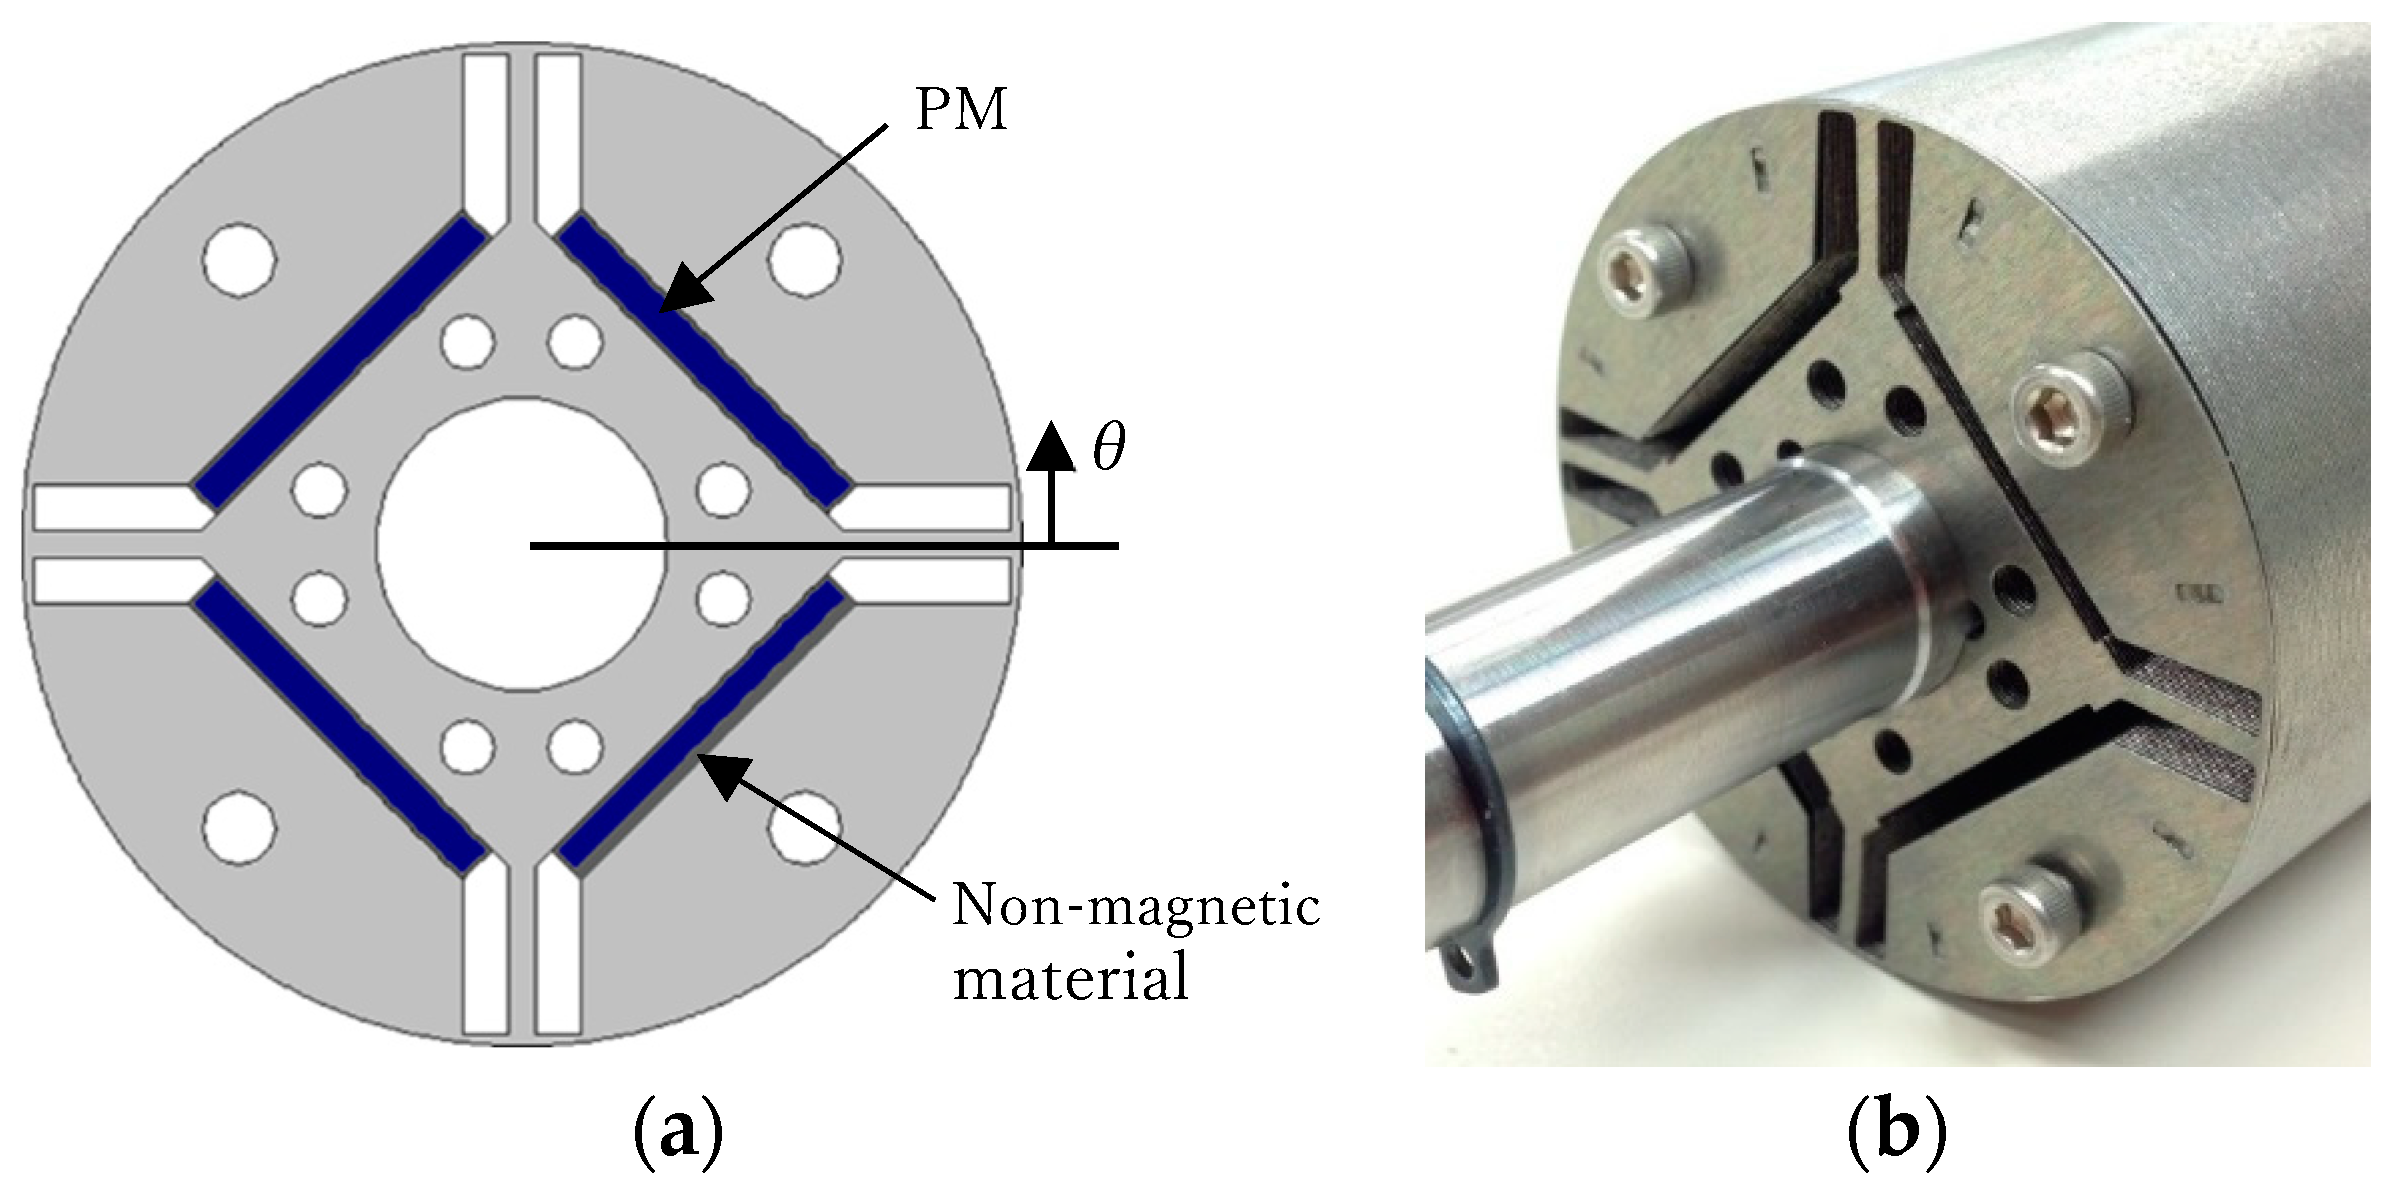
Figure 1 shows the rotor of an experimental four-pole IPMSM with parameters 1.5 kW, 3000 min−1, 4.8 Nm, and 5.6 A. A part of the PM material of one of four poles was altered to a non-magnetic material so as to mimic the effect of demagnetization. The PM material was Neodymium N39UH, which has residual magnetic flux density 1.25 T and density 7.65 kg/m3. The non-magnetic material was stainless steel, which has density 7.8 kg/m3; thus, the weight of the non-magnetic material was almost the same as that of the PM.
This paper reports experiments on the same stator and the same rotor using different PMs because slight differences between motors can affect the vibration characteristics, especially if the amount of demagnetization is very slight. We took into account two types of demagnetization. One is demagnetization in the radial direction, shown in Figure 2. One pole is composed of four PMs, and the thickness of the four PMs which composed one pole was reduced by 10%, 20%, or 30%; that is, the total volume of PM material used was decreased by about 2.5%, 5.0%, or 7.5%, respectively, in separate experiments, in order to imitate demagnetization or imperfect magnetization. The other is demagnetization in the axial direction, shown in Figure 3. The axial length of two of the four PMs per pole was reduced by 20%, 40%, or 60%; that is, the total volume of PM material used was decreased by about 2.5%, 5.0%, or 7.5%, respectively. Therefore, the PM volume of one pole for axial demagnetization was approximately the same as that for radial demagnetization. In order to remove eccentricity, non-magnetic materials were inserted into the region where the PM volume was decreased. Table 1 shows the volume of PMs for each demagnetization. Here, “Healthy” denotes the motor with fully magnetized PMs, R-2.5% denotes the motor with PMs demagnetized in the radial direction by about 2.5%, Z-2.5% denotes the motor with PMs demagnetized in the axial direction by about 2.5%, and so on. As PMs were manufactured in 0.1 mm steps, the reduction of PM volume denoted by 2.5% is not an exact value.
Figure 4 shows the experimental setup used to measure the vibration. An experimental IPMSM was driven by an inverter controlled by a Digital Signal Processor (DSP) DS1102 (dSPACE Japan K.K., Shinagawa, Japan). A PV08A (Rion Co. Ltd., Japan) piezoelectric acceleration pickup was attached to the top of the stator and was connected to a UV-06 charge amplifier. The vibration and torque signals were measured using a LABVIEW (2009, National Instruments, Japan) system.
3. Vibration Characteristics of an Experimental IPMSM Driven under Vector Control
In the measurement, the experimental IPMSM was driven under vector control. Figure 5 shows a typical block diagram for the vector-controlled PMSM system. In this diagram, two control loops were used; one is an inner loop to regulate the stator currents by converting to the d and q axes with the rotor position, and the other is an outer loop to control the motor speed. In this study, the d-axis current was maintained at 0. The system was composed of the motor, inverter, position sensor, two current sensors, and DSP DS1102. The switching frequency of the inverter was set to 4 kHz. The vector control diagram was carried out in the DS1102. The load condition was fixed at 0% and 70% of the rated torque by adding the load torque with a hysteresis brake. Figure 6 shows the measured vibration waveforms for the healthy motor, the motor with 7.5% demagnetized PMs in the radial direction, and the motor with 7.5% demagnetized PMs in the axial direction. The motor developed 70% of the rated torque in this measurement. It was found that the amplitude of the vibration signals emitted from the demagnetized motor was larger than that from the healthy motor.
Figure 7 shows FFT analyses of the vibration waveform emitted from the motor with radial demagnetization when the motor was running at a speed of 1200 min−1. Figure 8 shows those of the motor with axial demagnetization. It was found from these figures that the vibration at 70% load torque was larger than that at no load torque. Since the motor was running at a speed of 1200 min−1, the fundamental current frequency was 40 Hz. It can be observed from Figure 7b that the vibration had peak values at 440, 480, 520, 920, 960, and 1000 Hz, that is, at the 11th, 12th, 13th, 23rd, 24th, and 25th components. Since this motor has four poles, it was expected that the magnetic radial force would have a large value at 80 Hz when the motor was running at 1200 min−1. However, the vibration at 80 Hz is not large. By comparing Figure 7b and Figure 8b, we can see that the amplitude of vibration emitted from the motor with radial demagnetization was larger than that from the motor with axial demagnetization.
Although the vibration had another peak at 820 Hz, this component did not change in correspondence with the demagnetization level. Therefore, we investigated the 11th, 12th, 13th, 23rd, 24th, and 25th components. Figure 9 shows the characteristics of the 12th vibration component for load torque. The amplitude of vibration emitted from the healthy motor was almost the same for the different levels of load torque. On the contrary, the amplitude of vibration emitted from the demagnetized motor was approximately proportional to the load torque. The slope was large when the demagnetization level was large. It was also found that the amplitude of vibration emitted from the motor with radial demagnetization was about 1.5 times larger than that from the axial demagnetized motor. The 11th, 13th, 23rd, 24th, and 25th vibration components showed similar characteristics to the 12th component.
4. 3-D FE Analysis of Vibration Characteristics
In this chapter, the vibration characteristics are calculated using a 3-D finite element method to verify the experimental results. Figure 10 shows a model of the experimental motor. First, the flux distribution in the motor and electromagnetic force at the stator were calculated using the 3-D FE method. The analysis model is 1/2 of the model in the axial direction, because there is no symmetric condition in the circumferential direction. The numbers of nodes and elements used were 132,813 and 225,758, respectively, as shown in Figure 11a. The magnetic flux density was calculated by the 3-D nonlinear FEM with the measured stator current as the input values. Then, the electromagnetic force was calculated using Maxwell’s stress tensor. Figure 11b shows the finite element mesh of the cross-sectional region in the 3-D model for the calculation of eigenvalues and vibration characteristics. In Figure 11b, the aluminum case is taken into account.
Natural frequencies were obtained by measuring the transfer function of the stator core. A PV08A piezoelectric accelerometer was attached to the top of the stator and was connected to one channel of a UV-06 charge amplifier. A PH-51 impulse hammer was connected to the other channel. The charge amplifier was connected to a SA-01A4 signal analyzer and then to a PC where software for the SA-01A4 was installed. The transfer function was measured by hammering the stator surface. Table 2 shows the six lowest measured natural frequencies compared with the calculated ones. The relative error of the natural frequencies was in the range of 10% through 15%.
Figure 12 shows the FFT analysis of the electromagnetic force at a stator tooth calculated by 3-D FEM, where Figure 12a,b shows the force in the radial direction and the circumferential direction, respectively. Here, the measured stator current was used for the calculation by the 3-D FEM. It was found that the calculated electromagnetic force in the radial direction at a stator tooth was 80, 160, and 480 Hz, namely, the 2nd, 4th, and 12th harmonic components of the stator current. The electromagnetic force in the circumferential direction was 80, 160, 480, 520, and 960 Hz, namely, the 2nd, 4th, 12th, 13th, and 24th harmonic components.
Using the harmonic components of the electromagnetic force as the exciting force, the vibration characteristics were calculated by 3-D FEM. Figure 13 shows the harmonic components of vibration calculated by 3-D FEM for no load and for 70% load. It was found that the vibration at 70% load was larger than that at no load, and the vibration amplitudes at 80 Hz and 160 Hz were not large. Table 3 shows the amplitude of vibration at the main frequencies and at eigenvalues. By comparing the calculated vibrations shown in Figure 13 and the measured ones shown in Figure 7 and Figure 8, we observed that the calculated amplitudes of vibration were about 2 times larger than the measured ones. We believe that the error between the measured and the calculated vibrations is due to the calculated model. In the measurement, the motor was connected to a torque meter and a hysteresis brake on a motor pedestal. However, the authors calculated the vibration of only the motor, without including the pedestal and the torque meter, because it is difficult for 3-D FEM to calculate the whole measurement system. However, the qualitative characteristics were the same: We found that the vibration had peak values at the 440, 480, 520, 920, 960, and 1000 Hz components and that the vibration was small at 80 and 160 Hz and the eigenvalues. The amplitude of vibration at heavy load was larger than that at no load, and the amplitude of vibration emitted from the motor with radial demagnetization was larger than that with axial demagnetization.
5. Estimation of Demagnetization Level
It was clarified by the measurement and FE analysis in the previous section that the amplitude of vibration is approximately proportional to the load torque and demagnetization level. This section proposes an estimation method for the demagnetization level using the pre-measured characteristics shown in Figure 9. Let us explain how to estimate the demagnetization level using Figure 14. When a motor with demagnetized PMs, the demagnetization level of which is unknown, is driven under a vector control strategy, the vibration and the load torque are measured. Let the vibration be V and the load torque be T. Four pre-measured points (Ti, Vj), (Ti+1, Vj), (Ti, Vj+1), and (Ti+1, Vj+1) are chosen which are close to (T, V). The demagnetization level α can be estimated as follows:
where
and
In order to verify the method for estimation of the demagnetization level, a new PM with a demagnetization level of −3.75% was prepared. We estimated this demagnetization level by using the proposed method. Table 4 shows the estimated results of the demagnetization level for the radially demagnetized PMs using the 12th vibration component shown in Figure 9a. It was found that the estimated demagnetization level was −0.8% at no load and −3.2% through −4.1% for load torque larger than 0.48 Nm. Since the actual demagnetization level was −3.75%, it was verified that the demagnetization level can be estimated by measuring the load torque and the 12th component of vibration. Using the other vibration components, namely, the 11th, 13th, 24th, and 25th components, the demagnetization level can also be estimated. Table 5 shows the estimated demagnetization level for the axially demagnetized PMs using the 12th vibration component shown in Figure 9b. Since it was found, as shown in Table 5, that the estimated magnetization level was +1.12% at no load and −3.0% through −3.6% for load torque larger than 0.48 Nm, the demagnetization level for PMs with axial demagnetization can also be estimated, except when under no-load conditions. Therefore, the measurement of vibration and torque can be used to estimate the magnetization level of PMs under vector control, except for when under very light load.
6. Conclusions
This paper clarified the vibration characteristics relating to low levels of demagnetization in PMSMs under vector control by experiments and 3-D FE analyses. We found that the amplitude of some components of vibration was approximately proportional to the demagnetization level of PMs and the load torque. Moreover, the vibration and torque are very useful to the estimation of the magnetization level of PMs under vector control, except for when under very light load.
Author Contributions
Project administration, T.I.; writing, T.I.; measurement and calculation, N.I.
Funding
This research received no external funding.
Conflicts of Interest
The authors declare no conflict of interest.
References
- Chen, Y.; Liang, S.; Li, W.; Liang, H.; Wang, C. Faults and Diagnosis Methods of Permanent Magnet Synchronous Motors: A Review. Appl. Sci. 2019, 9, 2116. [Google Scholar] [CrossRef]
- Wang, Z.; Yang, J.; Huiping, Y.; Zhou, W. A review of Permanent Magnet Synchronous Motor fault diagnosis. In Proceedings of the IEEE Conference and Expo Transportation Electrification Asia-Pacific (ITEC Asia-Pacific), Beijing, China, 31 August–3 September 2014; pp. 1–5. [Google Scholar]
- Singh, S.; Kumar, N. Detection of Bearing Faults in Mechanical Systems Using Stator Current Monitoring. IEEE Trans. Ind. Inform. 2017, 13, 1341–1349. [Google Scholar] [CrossRef]
- Nayana, B.R.; Geethanjali, P. Analysis of Statistical Time-Domain Features Effectiveness in Identification of Bearing Faults from Vibration Signal. IEEE Sens. J. 2017, 17, 5618–5625. [Google Scholar] [CrossRef]
- Razavi-Far, R.; Farajzadeh-Zanjani, M.; Saif, M. An Integrated Class-Imbalanced Learning Scheme for Diagnosing Bearing Defects in Induction Motors. IEEE Trans. Ind. Inf. 2017, 13, 2758–2769. [Google Scholar] [CrossRef]
- Helmi, H.; Forouzantabar, A. Rolling bearing fault detection of electric motor using time domain and frequency domain features extraction and ANFIS. IET Electr. Power Appl. 2019, 13, 662–669. [Google Scholar] [CrossRef]
- Lopez-Perez, D.; Antonino-Daviu, J. Application of Infrared Thermography to Failure Detection in Industrial Induction Motors: Case Stories. IEEE Trans. Ind. Appl. 2017, 53, 1901–1908. [Google Scholar] [CrossRef]
- Rahman, M.M.; Uddin, M.N. Online Unbalanced Rotor Fault Detection of an IM Drive Based on Both Time and Frequency Domain Analyses. IEEE Trans. Ind. Appl. 2017, 53, 4087–4096. [Google Scholar] [CrossRef]
- Ghosh, E.; Mollaeian, A.; Kim, S.; Tjong, J.; Kar, N.C. DNN-Based Predictive Magnetic Flux Reference for Harmonic Compensation Control in Magnetically Unbalanced Induction Motor. IEEE Trans. Magn. 2017, 53, 1–7. [Google Scholar] [CrossRef]
- Morales-Perez, C.; Rangel-Magdaleno, J.; Peregrina-Barreto, H.; Amezquita-Sanchez, J.P.; Valtierra-Rodriguez, M. Incipient Broken Rotor Bar Detection in Induction Motors Using Vibration Signals and the Orthogonal Matching Pursuit Algorithm. IEEE Trans. Instrum. Meas. 2018, 67, 2058–2068. [Google Scholar] [CrossRef]
- Ali, M.Z.; Shabbir, M.N.S.K.; Liang, X.; Zhang, Y.; Hu, T. Machine Learning-Based Fault Diagnosis for Single- and Multi-Faults in Induction Motors Using Measured Stator Currents and Vibration Signals. IEEE Trans. Ind. Appl. 2019, 55, 2378–2391. [Google Scholar] [CrossRef]
- Barusu, M.R.; Sethurajan, U.; Deivasigamani, M. Non-invasive method for rotor bar fault diagnosis in three-phase squirrel cage induction motor with advanced signal processing technique. J. Eng. 2019, 2019, 4415–4419. [Google Scholar] [CrossRef]
- Glowacz, A. Fault diagnosis of single-phase induction motor based on acoustic signals. Mech. Syst. Signal Process. 2019, 117, 65–80. [Google Scholar] [CrossRef]
- Glowacz, A.; Glowacz, W. Vibration-Based Fault Diagnosis of Commutator Motor. Shock Vib. 2018, 2018. [Google Scholar] [CrossRef]
- Glowacz, A. Fault Detection of Electric Impact Drills and Coffee Grinders Using Acoustic Signals. Sensors 2019, 19, 269. [Google Scholar] [CrossRef] [PubMed]
- Mao, Y.; Zuo, S.; Cao, J. Effects of Rotor Position Error on Longitudinal Vibration of Electric Wheel System in In-Wheel PMSM Driven Vehicle. IEEE/ASME Trans. Mechatron. 2018, 23, 1314–1325. [Google Scholar] [CrossRef]
- Cuevas, M.; Romary, R.; Lecointe, J.; Morganti, F.; Jacq, T. Noninvasive Detection of Winding Short-Circuit Faults in Salient Pole Synchronous Machine With Squirrel-Cage Damper. IEEE Trans. Ind. Appl. 2018, 54, 5988–5997. [Google Scholar] [CrossRef]
- Park, Y.; Fernandez, D.; Lee, S.B.; Hyun, D.; Jeong, M.; Kommuri, S.K.; Briz, F. Online Detection of Rotor Eccentricity and Demagnetization Faults in PMSMs Based on Hall-Effect Field Sensor Measurements. IEEE Trans. Ind. Appl. 2019, 55, 2499–2509. [Google Scholar] [CrossRef]
- Cheng, M.; Gao, F.; Li, Y. Vibration Detection and Experiment of PMSM High Speed Grinding Motorized Spindle Based on Frequency Domain Technology. Meas. Sci. Rev. 2019, 19, 109–125. [Google Scholar] [CrossRef] [Green Version]
- Huang, G.; Edwardo FFukushima, S.J.; Zhang, C.; He, J. Estimation of Sensor Faults and Unknown Disturbance in Current Measurement Circuits for PMSM Drive System. Measurement 2019, 137, 580–587. [Google Scholar] [CrossRef]
- Faiz, J.; Koti, H.N. Demagnetization Fault Indexes in Permanent Magnet Synchronous Motors. An Overview. IEEE Trans. Magn. 2016, 52, 8201511. [Google Scholar] [CrossRef]
- Rajagopalan, S.; Le, R.; Habetler, T.; Harley, R. Diagnosis of potential rotor faults in brushless DC machines. Proc. Inst. Elect. Eng. Conf. Publ. 2004, 2, 668–673. [Google Scholar]
- Urresty, J.; Riba, J.; Delgado, M.; Romeral, L. Detection of Demagnetization Faults in Surface-Mounted Permanent Magnet Synchronous Motors by Means of the Zero-Sequence Voltage Component. IEEE Trans. Energy Convers. 2012, 27, 42–51. [Google Scholar] [CrossRef]
- Torregrossa, D.; Khoobroo, A.; Fahimi, B. Prediction of Acoustic Noise and Torque Pulsation in PM Synchronous Machines with Static Eccentricity and Partial Demagnetization Using Field Reconstruction Method. IEEE Trans. Ind. Electron. 2012, 59, 934–944. [Google Scholar] [CrossRef]
- Liu, K.; Zhu, Z. Online Estimation of the Rotor Flux Linkage and Voltage-Source Inverter Nonlinearity in Permanent Magnet Synchronous Machine Drives. IEEE Trans. Power Electron. 2014, 29, 418–427. [Google Scholar] [CrossRef]
- Yang, Z.; Shi, X.; Krishnamurthy, M. Vibration monitoring of PM synchronous machine with partial demagnetization and inter-turn short circuit faults. In Proceedings of the 2014 IEEE Transportation Electrification Conference and Expo, Dearborn, MI, USA, 15–18 June 2014. [Google Scholar]
- Alameh, K.; Cite, N.; Hoblos, G.; Barakat, G. Vibration-based Fault Diagnosis Approach for Permanent Magnet Synchronous Motors. IFAC Pap. 2015, 48, 1444–1450. [Google Scholar] [CrossRef]
- Zhu, M.; Hu, W.; Kar, N.C. Torque-Ripple-Based Interior Permanent-Magnet Synchronous Machine Rotor Demagnetization Fault Detection and Current Regulation. IEEE Trans. Ind. Appl. 2017, 53, 2795–2804. [Google Scholar] [CrossRef]
- Wallscheid, O.; Huber, T.; Peters, W.; Bocker, J. Real-Time Capable Methods to Determine the Magnet Temperature of Permanent Magnet Synchronous Motors—A Review. In Proceedings of the IEEE-IECON, Dallas, TX, USA, 29 October–1 November 2014; pp. 811–818. [Google Scholar]
- Shinagawa, S.; Ishikawa, T.; Kurita, N. Characteristics of Interior Permanent Magnet Synchronous Motor with Imperfect Magnets. IEEJ J. Ind. Appl. 2015, 4, 346–351. [Google Scholar] [CrossRef] [Green Version]
- Ishikawa, T.; Igarashi, N.; Kurita, N. Failure Diagnosis for Demagnetization in Interior Permanent Magnet Synchronous Motors. Int. J. Rotating Mach. 2017, 2017. [Google Scholar] [CrossRef]
Figure 1.
Rotor of the experimental interior permanent magnet synchronous motor (IPMSM): (a) rotor configuration; (b) photograph of rotor.
Figure 1.
Rotor of the experimental interior permanent magnet synchronous motor (IPMSM): (a) rotor configuration; (b) photograph of rotor.

Figure 2.
PMs for radial demagnetization: (a) magnet configuration; (b) photograph of magnet.

Figure 3.
PMs for axial demagnetization: (a) magnet configuration; (b) photograph of magnet.

Figure 4.
Experimental setup.

Figure 5.
Block diagram for a PMSM under a vector control strategy.

Figure 6.
Vibration waveforms at 70% load torque: (a) healthy motor; (b) R-7.5% motor; (c) Z-7.5% motor.
Figure 6.
Vibration waveforms at 70% load torque: (a) healthy motor; (b) R-7.5% motor; (c) Z-7.5% motor.


Figure 7.
FFT analysis of vibration waveforms emitted from the motor with radial demagnetization: (a) no load torque; (b) 70% load torque.
Figure 7.
FFT analysis of vibration waveforms emitted from the motor with radial demagnetization: (a) no load torque; (b) 70% load torque.

Figure 8.
FFT analysis of measured vibration waveforms emitted from the motor with axial demagnetization: (a) no load torque; (b) 70% load torque.
Figure 8.
FFT analysis of measured vibration waveforms emitted from the motor with axial demagnetization: (a) no load torque; (b) 70% load torque.

Figure 9.
Characteristics of the 12th vibration component relative to load torque: (a) radial demagnetization motor; (b) axial demagnetization motor.
Figure 9.
Characteristics of the 12th vibration component relative to load torque: (a) radial demagnetization motor; (b) axial demagnetization motor.

Figure 10.
Experimental IPMSM.

Figure 11.
Finite element mesh of the cross-sectional region in the 3D model: (a) for electromagnetic field calculation; (b) for vibration calculation considering aluminum case.
Figure 11.
Finite element mesh of the cross-sectional region in the 3D model: (a) for electromagnetic field calculation; (b) for vibration calculation considering aluminum case.

Figure 12.
Electromagnetic force at a stator tooth calculated by 3D FEM: (a) electromagnetic force in the radial direction; (b) electromagnetic force in the circumferential direction.
Figure 12.
Electromagnetic force at a stator tooth calculated by 3D FEM: (a) electromagnetic force in the radial direction; (b) electromagnetic force in the circumferential direction.

Figure 13.
FFT analysis for calculated vibration waveforms: (a) no load; (b) 70% load.

Figure 14.
How to estimate the demagnetization level using the measured torque T and vibration V.


Table 1.
Dimensions of PMs.
| PM | L (mm) | W (mm) | H (mm) | V (mm3) | V/VHealthy |
|---|---|---|---|---|---|
| Healthy | 22.6 | 20.2 | 2.2 | 16070 | - |
| R-2.5% | 22.6 | 20.2 | 2.0 | 15704 | 0.977 |
| R-5.0% | 22.6 | 20.2 | 1.8 | 15339 | 0.955 |
| R-7.5% | 22.6 | 20.2 | 1.6 | 14974 | 0.932 |
| Z-2.5% | 18.0 | 20.2 | 2.2 | 15661 | 0.975 |
| Z-5.0% | 13.4 | 20.2 | 2.2 | 15252 | 0.950 |
| Z-7.5% | 8.8 | 20.2 | 2.2 | 14843 | 0.924 |
Table 2.
Natural frequencies.
| Measured (Hz) | Calculated (Hz) | Relative Error (%) |
|---|---|---|
| 179 | 207 | 15.6 |
| 472 | 521 | 12.5 |
| 592 | 647 | 11.0 |
| 952 | 1063 | 11.8 |
| 1240 | 1371 | 11.1 |
| 1468 | 1655 | 12.7 |
Table 3.
Calculated amplitudes of vibration.
| Vibration (mm/s2) | ||||
|---|---|---|---|---|
| Frequency (Hz) | Condition | Healthy | R-7.5% | Z-7.5% |
| 440 (11th) | No load | 0.070 | 0.235 | 0.162 |
| 480 (12th) | No load | 0.205 | 0.294 | 0.194 |
| 520 (13th) | No load | 0.192 | 0.256 | 0.160 |
| 920 (23rd) | No load | 0.173 | 0.257 | 0.176 |
| 960 (24th) | No load | 0.197 | 0.297 | 0.153 |
| 1000 (25th) | No load | 0.177 | 0.244 | 0.183 |
| 440 (11th) | 70% load | 0.090 | 1.14 | 0.915 |
| 480 (12th) | 70% load | 0.263 | 1.43 | 1.10 |
| 520 (13th) | 70% load | 0.245 | 1.25 | 0.903 |
| 920 (23rd) | 70% load | 0.221 | 1.25 | 0.997 |
| 960 (24th) | 70% load | 0.252 | 1.44 | 0.866 |
| 1000 (25th) | 70% load | 0.226 | 1.19 | 1.03 |
| 207 (1st eigenvalue) | 70% load | 0.006 | 0.008 | 0.001 |
| 472 (2nd eigenvalue) | 70% load | 0.022 | 0.007 | 0.068 |
| 593 (3rd eigenvalue) | 70% load | 0.022 | 0.009 | 0.001 |
| 952 (4th eigenvalue) | 70% load | 0.051 | 0.18 | 0.018 |
Table 4.
Estimation of the demagnetization level of a radially demagnetized PM using the 12th vibration component.
Table 4.
Estimation of the demagnetization level of a radially demagnetized PM using the 12th vibration component.
| Torque (Nm) | Vibration (mm/s2) | Estimated Value (%) |
|---|---|---|
| 0.0 | 0.067 | −0.80 |
| 0.48 | 0.093 | −3.21 |
| 0.95 | 0.139 | −4.06 |
| 1.43 | 0.166 | −3.59 |
| 1.91 | 0.226 | −3.86 |
| 2.39 | 0.267 | −3.70 |
| 2.86 | 0.324 | −3.46 |
| 3.34 | 0.396 | −3.51 |
Table 5.
Estimation of the demagnetization level of an axially demagnetized PM using the 12th vibration component.
Table 5.
Estimation of the demagnetization level of an axially demagnetized PM using the 12th vibration component.
| Torque (Nm) | Vibration (mm/s2) | Estimated Value (%) |
|---|---|---|
| 0.0 | 0.071 | +1.12 |
| 0.48 | 0.086 | −3.04 |
| 0.95 | 0.115 | −3.20 |
| 1.43 | 0.134 | −3.59 |
| 1.91 | 0.159 | −3.36 |
| 2.39 | 0.179 | −3.34 |
| 2.86 | 0.211 | −3.41 |
| 3.34 | 0.234 | −3.52 |
© 2019 by the authors. Licensee MDPI, Basel, Switzerland. This article is an open access article distributed under the terms and conditions of the Creative Commons Attribution (CC BY) license (http://creativecommons.org/licenses/by/4.0/).
Share and Cite
MDPI and ACS Style
Ishikawa, T.; Igarashi, N. Failure Diagnosis of Demagnetization in Interior Permanent Magnet Synchronous Motors Using Vibration Characteristics. Appl. Sci. 2019, 9, 3111. https://doi.org/10.3390/app9153111
AMA Style
Ishikawa T, Igarashi N. Failure Diagnosis of Demagnetization in Interior Permanent Magnet Synchronous Motors Using Vibration Characteristics. Applied Sciences. 2019; 9(15):3111. https://doi.org/10.3390/app9153111
Chicago/Turabian StyleIshikawa, Takeo, and Naoto Igarashi. 2019. "Failure Diagnosis of Demagnetization in Interior Permanent Magnet Synchronous Motors Using Vibration Characteristics" Applied Sciences 9, no. 15: 3111. https://doi.org/10.3390/app9153111
Note that from the first issue of 2016, this journal uses article numbers instead of page numbers. See further details here.