Article

Application of Deep Learning Techniques and Bayesian Optimization with Tree Parzen Estimator in the Classification of Supply Chain Pricing Datasets of Health Medications

by
David Opeoluwa Oyewola
1,
Emmanuel Gbenga Dada
2,
Temidayo Oluwatosin Omotehinwa
3,
Onyeka Emebo
4 and
Olugbenga Oluseun Oluwagbemi
5,6,*
1
Department of Mathematics and Statistics, Federal University Kashere, Gombe P.M.B. 0182, Nigeria
2
Department of Mathematical Sciences, University of Maiduguri, Maiduguri P.M.B. 1069, Nigeria
3
Department of Mathematics and Computer Science, Federal University of Health Sciences, Otukpo P.M.B. 145, Nigeria
4
Department of Computer Science, Virginia Tech University, Blacksburg, VA 24061, USA
5
Department of Computer and Information Technology, Sol Plaatje University, Kimberley 8301, South Africa
6
National Institute for Theoretical and Computational Sciences (NiTheCS), Stellenbosch 7602, South Africa
*
Author to whom correspondence should be addressed.
Appl. Sci. 2022, 12(19), 10166; https://doi.org/10.3390/app121910166
Submission received: 3 September 2022 / Revised: 21 September 2022 / Accepted: 29 September 2022 / Published: 10 October 2022
(This article belongs to the Special Issue Artificial Intelligence for Health and Well-Being)

Abstract

:
From the development and sale of a product through its delivery to the end customer, the supply chain encompasses a network of suppliers, transporters, warehouses, distribution centers, shipping lines, and logistics service providers all working together. Lead times, bottlenecks, cash flow, data management, risk exposure, traceability, conformity, quality assurance, flaws, and language barriers are some of the difficulties that supply chain management faces. In this paper, deep learning techniques such as Long Short-Term Memory (LSTM) and One Dimensional Convolutional Neural Network (1D-CNN) were adopted and applied to classify supply chain pricing datasets of health medications. Then, Bayesian optimization using the tree parzen estimator and All K Nearest Neighbor (AllkNN) was used to establish the suitable model hyper-parameters of both LSTM and 1D-CNN to enhance the classification model. Repeated five-fold cross-validation is applied to the developed models to predict the accuracy of the models. The study showed that the combination of 1D-CNN, AllkNN, and Bayesian optimization (1D-CNN+AllKNN+BO) outperforms other approaches employed in this study. The accuracy of the combination of 1D-CNN, AllkNN, and Bayesian optimization (1D-CNN+AllKNN+BO) from one-fold to 10-fold, produced the highest range between 61.2836% and 63.3267%, among other models.

1. Introduction

There are different diseases affecting public health and safety across different parts of the world. Much research has centered on proffering solutions by diagnosing and truncating the transmission of diseases such as COVID-19 (henceforth, SARS-CoV-2) [1,2], HIV [3,4], Ebola [5,6,7,8], malaria [9,10,11,12,13,14,15,16,17,18,19,20], hereditary diseases [21,22], monkeypox [23,24,25], tuberculosis [26,27,28,29,30], and other diseases [31,32,33,34,35], by adopting different computational, modeling and bioinformatics approaches. Recently, the World Health Organization (WHO) declared monkeypox disease a case of a global public health emergency of International Concern [36]. Health medications such as vaccines, and liquid and solid medications are very essential and in high demand to combat the diseases [37,38,39,40]. After the production of these medications, one of the major problems is how to transport and distribute these health medications effectively and efficiently to regions where they are urgently needed. Health medications form an essential part of human society. However, the supply chain process that health medication undergoes before they are safely delivered to their various destinations can be very complicated and challenging. Issues such as unpredictability, instability, and a lack of accountability are problems facing the global supply chain sector. Companies today, (pharmaceutical firms inclusive), face a distinct set of difficulties, including transportation issues, outsourcing, bottlenecks due to unexpectedly high demand, in addition to growing consumer expectations, and complicated operational processes. Health medication supply chain fragility was recently brought to light by the outbreak of the SARS-CoV-2 pandemic [41,42].
At present, organizations are seeking ways to make their supply chains less susceptible to disturbances in the current environment of transforming the supply chain competitive landscape, evolving workplace practices, and increasingly volatile demand [43]. Many well-known and new supply chain difficulties can be solved by computational approaches such as machine learning. Artificial intelligence helps companies manage their supply chains better and make them more resilient to disturbances. One of the ways supply chain managers can take to address pressing challenges in the supply chain process is to use machine learning use cases as a prepared roadmap of the steps they should follow [44,45,46].
Recently, the conventional linear supply chain has been evolving over the past few years into a computerized supply chain network, which we have all seen (DSNs). Businesses are actively reviewing their overall supply chain strategy in anticipation of the recent reality, and COVID-19 has only expedited this process [47]. It is feasible to convert conventional, linear supply chains into linked, adaptive, expandable, and configurable digitized supply chain networks with the aid of technologies like IoT, intelligent systems, and deep learning. Conventional supply chains operate according to a predetermined workflow. This is how most industrial execution systems work [48]. A nondeterministic system, on the other hand, lacks predetermined workflows and gives automation itself some latitude in how it manages business logic. Improved online manufacturing systems can reorganize and improve production processes, prevent service disruptions, and lower the expenses associated with changing product lines [49].
The widespread use of machine learning throughout the supply chain has made it possible for retailers, suppliers, and wholesalers to implement the massive adjustments that are urgently required to address the epidemic. Benefits that have never been feasible before are now available to supply chain operations thanks to machine learning, including cost savings via improved supply chain prediction and risk management, rapid supplies, and improved customer experience, to mention a few [50]. Machine learning will most significantly aid supply chain experts by giving them additional insight into how to improve supply chain efficiency and foresee abnormalities in logistics costs and performance before they arise. Machine learning is also revealing which areas of automation will result in the greatest scale advantage. As a result of supply management machine learning technologies, retailers and suppliers are cooperating in whole new ways. Machine learning, a branch of artificial intelligence, uses data to train computer models to respond to events on their own [51]. The computer may progressively train itself in this way, improving the precision of its own algorithms. Some machine learning methods are used in the supply chain. According to Gartner [43,52], by 2023, cognitive algorithms and artificial intelligence approaches will be implemented or augmented in 25 percent of all supply chain technology systems, according to Gartner [43,53].
Inventory management is one component of supply chain management. It requires expensive storage and upkeep of inventory to keep it in good shape. Therefore, inventory planning should be approached carefully by supply chain managers as it directly affects a company’s cash flow and profit margins. Among the most prevalent applications of machine learning in the supply chain is inventory management [54]. The issue of under-or overstocking can be resolved with the aid of machine learning. With ML, you can forecast the growth in demand based on data that can be gathered from a variety of sources, such as the open market environment, trends in the market, advertising, purchases, and historical analyses [55]. Additionally, you can plan to stock up on supplies and avoid having an excess of either items or crucial components for manufacture. There is a need for a variety of facts for the forecast to be correct. Machine learning presents a range of solutions to the issue of inadequate data for research to be successful. One such method is data augmentation, which enables you to greatly enhance the variety of data provided for training models without having to collect additional data. Depending on the type of data, several augmentation strategies are utilized in deep learning applications [56,57]. Approaches like Synthetic Minority Over-sampling TEchnique (SMOTE) or Synthetic Minority Over-sampling TEchnique-Nominal Continuous (SMOTE NC) are frequently used to enhance plain numerical data [58,59]. Depending on the nature of the project, augmentation techniques for large amounts of data, such as images and text, range from straightforward manipulations to neural network-generated data. A machine learning technique called incremental learning trains a model using a small quantity of data [60]. Rather, learning begins with a rather basic model that generally forecasts the estimated value with a certain variability. The model is trained to be able to predict outcomes more accurately when a data scientist inserts additional data instances. The number of datasets will eventually be sufficient to generate accurate predictions.
Along with supervised learning and unsupervised learning, reinforcement learning (RL) is one of the three fundamental machine learning methods. It employs rewards and penalties as cues for appropriate and inappropriate conduct [61]. RL is employed in robotic systems and process control to allow the robot to develop an effective, adaptable control system for itself that gains knowledge from its own experience and behavior [62]. When it comes to data, the decision of whether to employ a data lake or a data warehouse emerges. Data lakes are frequently employed in advanced analytics or machine learning applications. They are frequently employed in ML projects because they enable the real-time collection and storage of data from numerous sources. A data warehouse is appropriate for operational processes and daily operations, whereas a data lake is ideal for those who require a thorough study of broad-spectrum data that have been acquired over time. Nevertheless, a lot of businesses are increasingly utilizing both types of storage, particularly when a data lake serves as the foundation for a data warehouse that leverages sanitized and structured data from a DL [63].
Another type of supply chain ML application is computer vision (CV) for inventory control. It is often used in many different settings. It is first used to categorize and tally freshly delivered items. CV also helps in the identification of visible package damage. With the use of computer vision, the program can classify the items it “sees.” Robots equipped with cameras, for example, may scan your storage spaces and instantly produce a picture of your goods. Machine learning techniques that may be applied in the CV sector include supervised learning, unsupervised learning, and reinforcement learning [64].
Predictive maintenance of equipment is another common application of machine learning in the supply chain. Based on real-time asset data instead of a predetermined timetable, ML ensures reactive and preventative maintenance of equipment. Supply chain experts can drastically reduce maintenance costs by improving asset upkeep. Additionally, ML aids in the decline of no-fault-found (NFF) situations. When a unit is deemed to be defective, it is taken out of service and designated as NFF. If no abnormality is found, the device is put back into use without any repairs. The production process becomes more efficient as the number of such accidents decreases [65]. ML aids in determining a package’s location throughout the logistics process. It enables supply chain experts to monitor the whereabouts of cargo while it is being transported. Additionally, it gives insight into the circumstances of the package’s transportation. Retailers can keep an eye on variables like temperature, vibration, humidity, etc. with the use of sensors. Additionally, ML supports in-the-moment route optimization. It keeps track of the weather and the state of the roads and makes suggestions on how to shorten travel time and optimize the route. This allows for the diversion of trucks at any moment when a more economical route is available [66].
Machine learning is utilized in warehouses to automate manual tasks, foresee potential problems, and minimize paperwork for warehouse workers. For instance, computer vision enables the management of conveyor belt operations and the forecasting of blockages. Thanks to NLP and OCR [67], warehouse personnel can automatically recognize goods’ arrival and modify their delivery statuses. On the product, barcodes and inscriptions are scanned by cameras, and the data are immediately input into the system. Additionally, machine learning assists in programming robots and autonomous vehicles, both of which are commonly utilized in warehouses. Autonomous vehicles and robots assist with receiving, packing and unpacking, transporting, and uploading and unloading boxes with the use of system-integrated instructions. In this scenario, computer vision aids in locating a vacant space for a box, monitoring its proper placement, and preventing robot and automobile accidents in warehouses [68]. This paper is an innovative work because it deals with the hybridization of deep learning and Bayesian optimization with a tree parzen estimator for the classification of the supply chain of health medication datasets. To the best of our knowledge, there is no study in the literature that has adopted such a technique. The major contributions of this work include:
  • A survey of machine learning and deep learning algorithms that have been applied for supply chain management was presented.
  • Determination of the most appropriate deep learning model for the classification of supply chain health medications was done.
  • Development of deep learning and Bayesian optimization Techniques with Tree Parzen Estimator for classification of supply chain health medications was done.
  • Evaluation of the performance of the proposed methods for classifying health medications using different metrics was achieved.
The rest of the paper is organized as follows: a review of related work together with the summary of contributions table is presented in Section 2. Whereas Section 3 explains the methods used for the classification of supply chain health medications. The simulation and statistical results of our experiments are presented in Section 4. The conclusion of the paper is in Section 5.

2. Materials and Methods

2.1. Related Works

In the area of supply chain management, some study has been done. Wong et al. [69] examine the technological design while considering the technical viability in terms of scalability, large data processing, and analytics. For data transfer and communication between members of the community, blockchain technology establishes a network that is mainly dependable. Supply chain management using blockchain technology is susceptible to efficiency and memory issues because of the irreversibility, increasing volume, and heterogeneity of supply chain transaction data on the blockchain peer-to-peer network of different supply chain participants. To uphold the norms of supply chain management using blockchain technology, the blockchain architecture backed by a cutting-edge cloud infrastructure was proposed. The cloud platform supports all required web services with scalability, accessibility, protection, and virtualized computing features that make it easier to distribute, share, and store a sizable amount of immutable transaction records with the help of privacy and confidentiality web services, including the use of status update web services. The limitation of the work is that further quantitative and empirical investigations into the supply chain management performance model are required.
Alnahhal, Ahrens, and Salah [70] examined the dynamic lead-time forecasting that may be done by a logistics firm to optimize temporal cargo consolidation. Consolidating shipments is frequently done to cut the cost of export, but it can lengthen the delivery time. In the study, forecasting is done using real data in a make-to-order supply chain where the logistics provider is unaware of the producers’ own data records. Using machine learning techniques like logistic regression and linear regression, forecasting was carried out in stages. The final stage verifies whether the order will arrive during the next delivery week or not. After each cargo delivery, forecasting is reviewed to see whether it would be capable of delivering the present inbound purchases for a specific customer promptly or if it would wait until the next week. The outcomes demonstrated acceptable accuracy expressed in many ways, one of which is dependent on a type I error with an average value of 0.07. Adaptive forecasting is used in the work in order to optimize cargo temporal integration in the aggregation center. The limitations of the study include a lengthy lead time and the assumption that it will take a few weeks. Furthermore, forecasting by the third-party delivery company is unnecessary if suppliers offer correct information about delivery schedules. Suppliers can offer better forecasting because they typically have access to more local knowledge. Temporal consolidation would not be desirable if stock level costs are too high and transportation costs are low.
A novel medicine supply chain and recommendation system built on blockchain, and machine learning was developed by Abbas et al. [71] and deployed (DSCMR). A consumer medicine recommendation system based on machine learning and a system for managing the drug supply chain based on blockchain are the two main parts of our suggested strategy. The first module installs the medication supply chain management system using open blockchain fabrics. This system can continuously track and monitor the drug distribution process in the intelligent pharmaceutical business. In contrast, the N-gram and LightGBM models are employed in the machine learning module to provide clients in the pharmaceutical business with recommendations for the best or highest-rated medications. These models were trained using the well-known drug review dataset, which the University of California made available to the public as part of a fully accessible machine learning collection. Additionally, this blockchain system incorporates the machine learning module with the aid of the REST API. Finally, they run a number of tests to evaluate the effectiveness and usefulness of our proposed solution. The system’s limitations are that the network is not very large, and the technology is not used in real-time by pharmaceutical companies to evaluate its effectiveness. Additionally, the accuracy of the machine learning models used in the work is subpar.
Shahbazi and Byun [72] provided a method for manipulating perishable food that integrates the most recent advances in blockchain technology, machine learning technology (ML), and fuzzy logic traceability systems. This technology is known as the blockchain machine learning-based food traceability system (BMLFTS). The proposed system’s blockchain technology was created to address issues such as weight, evaporation, warehousing transactions, and shipment times. The blockchain data flow is intended to demonstrate how machine learning was extended to the level of food traceability. Additionally, to extend shelf life, supply chains use precise and reliable data. The proposed solution has limitations dependent on the use of other supply chain applications in the food traceability scenario. The proposed system should not be limited to food traceability; additional analysis features, such as risk management and e-commerce transactions, can be included. These are the two primary aspects that are recommended for further study and refining of the proposed technique. Similar information flows, including risk, material, and value flows, can be addressed by an incorporated strategy to build a supply chain that is more dependable and safer.
Tirkolaee et al. [73] give a general overview of how ML approaches are being used across the supply chain. They named machine learning (ML) applications in supply chain management (SCM) as one of the most well-known artificial intelligence (AI) methodologies. The importance of machine learning (ML) approaches in supplier selection and segmentation, supply chain risk prediction, demand and sales estimation, inventory control, transport and logistics, environmental sustainability (SD), and digital economy (CE) is highlighted in this study. The study’s implications for the major issues and shortcomings are then examined, followed by managerial advice and suggestions for future research. The authors predicted advancements in AI research and proposed more investigation into the use of RL approaches in real-time pricing. The study’s main flaw is that it only looked into a small number of algorithms, leaving out many other highly effective deep learning and machine learning methods.
Manasas [74] explains how lead time prediction and minimization using machine learning techniques can help with supply chain management. Lead time has been extensively studied since it is seen as a crucial aspect in both supply chain planning and customer satisfaction. These techniques were used on a sizable set of Greek-headquartered enterprises that manufacture aluminum in multiple stages and with multiple products. The lead times for the company’s main product groups, architectural aluminum profiles, and accessories, were explored in depth using two predictive models. A third model was used to accurately forecast for aluminum accessories to avoid stock-outs, which have a significant impact on the lead times for orders placed. The case study’s outcomes seem more than acceptable, outperforming the effectiveness of the technologies in use for demand forecasting and lead time prediction. The work’s limitations include inaccurate lead time estimation; waiting periods between phases should be considered as this “dead time” influences the overall cycle time. In addition, the industrial environment is undergoing dynamic changes. Substantial changes in the system, such as the adoption of new planning methods and systems, are not easily accomplished by the algorithms in the absence of appropriate data, despite the fact that machine learning algorithms are good at recognizing the environment’s modifications when being retrained.
Wong et al. [75] used artificial intelligence (AI) to show how supply chains (SCs) can respond dynamically to unstable conditions, reducing the need for small-to-medium-sized businesses (SMEs) to make potentially costly decisions. This work explores the effect of AI on SC risk management for SMEs, building on a resource-based perspective. Based on information gathered from executives, managers, and senior managers of SMEs, a structural model consisting of AI-risk management capabilities, SC reengineering prowess, and supply chain agility (SCA) was created and evaluated. Artificial neural networks (ANNs) and partial least squares-based structural equation modeling (PLS-SEM) are the key methodologies used in this study (ANN). According to the findings, SC re-engineering flexibility and capacities are influenced by the application of AI for risk management. Efficiency is further impacted and mediated by reengineering abilities. Reliability was found for models A and B when PLS-SEM and ANN were compared. The SC’s current levels of demand uncertainty put managers under pressure to make difficult trade-off decisions in a short amount of time. AI makes it feasible to model different situations to provide answers to important issues that outdated infrastructures cannot. In this work, non-linear correlations in the model were discovered and a multi-construct adaptability idea was combined. The limitation of the study is that other factors affecting the acceptance of technology, like culture, managerial dedication, and technological innovation, were not taken into account by the model.
Keerthana [76] applied different machine learning techniques for supply chain management. To close the supply-demand imbalance, the researcher created a complete system that uses an expandable deep neural network architecture. Depending on transaction records from already processed transactions, the architecture is able to examine a number of customized input items and proactively identify supply and demand trends. Based on a set of adaptable features, a general training model is created to forecast future demand, which is then put to the test. Integrating layers are applied to transfer high-dimensional features onto a small subdomain, resulting in a more compact representation, to bring together incoming data. The training framework of the model is made up of fully joined layers with connected activation functions. The limitation of the work is the low performance of the machine learning models used.
Abou Zwaida, Pham, and Beauregard [77] presented a study on a drug refilling optimization problem, a general model for drug inventory management in a hospital. To solve the optimization challenge of a drug shortage, they investigated the hospital’s drug supply chain model and developed Dynamic Refilling dRug Optimization (DR2O). They simulate an objective function that seeks to reduce the restocking costs, which include the price of the drug itself, the cost of storing it, and the consequence of a deficit. They also took budgetary limitations and supply limits into account while refilling medications, such as storage capability. They also proposed the Deep Reinforcement Learning Model for Drug Inventory (DRLD), a deep learning approach based on RL and DNN in which the pharmaceutical problem is represented as a state in a Markov Decision Process (MDP). They searched for a proper measure to decide whether to supply based on each state in order to reduce the objective cost function. They created an online approach to system control based on the MDP model, where reward and Q-matrices are established to assess an action match for each state. They presented a DNN model that can approximate the Q-values after training and can understand the behavior of the system because of the large search state space in RL. Lastly, they looked at using a detailed simulation to carry out their work. They specifically compared their strategy to three baseline strategies, which included support functionality, ski rental, and max-min. In most analyses, their approach outperforms other methods considered in the paper, particularly in terms of lowering the cost of restocking and the scarcity issue. The limitation of the work is the relatively high rate of unexpected results.
Milani et al. [78] worked on the forecasting of supply chain management for non-communicable diseases. The authors examine the applicability of forecasting modeling to non-communicable diseases (NCDs) in supply chain management, including the suitable techniques to gather and analyze the crucial data. In healthcare, a different approach has been put in place to forecast both vertical and horizontal supply chain interactions utilizing numerical forecasting models and machine learning. To foresee harmful medical events, the paper suggests various types of data gathering, analysis, and prediction methodologies. These methods may prove valuable in the healthcare supply chain, which includes manufacturers, wholesalers, marketers, and providers. The shortcoming of the work is that the performance of the machine learning and deep learning models used in the work was not reported.
Liotine [79] reviews the outcomes of the findings of a panel study conducted by the industry to determine how supply chain control tower (CT) deployments for the pharmaceutical business are affected by new autonomous intelligence technologies, such as artificial intelligence and machine learning. Such technologies have the capability to transform CTs into a model that allows for the collection, assessment, and decision-making of data in real time. This can be done by utilizing these technologies to handle decision intricacy better and carry out decisions at rates that people would normally find difficult to handle. The essential skills that must be enabled and the increased level of decision accessibility they offer are some of the main elements that have been recognized. They also considered some of the obstacles involved in accomplishing this, such as data quality and reliability, collaboration and data sharing across supply chain layers, system-to-system compatibility, decision-validation, and administrative effects, among several others. The drawback of the work is that no machine learning algorithm was implemented in the paper.
Shah [80] explains the essential components of every supply chain and the many tactics a drug manufacturer can employ to operate effectively. Artificial intelligence (AI) and machine learning (ML) tools are some of the more contemporary techniques that businesses utilize for supply chain optimization. Lead times are shortened because of these innovative technologies, which also assist in forecasting better routes in the future and drastically save expenses. The paper then examines paracetamol, a medicine that is extensively produced in India as an active pharmaceutical ingredient (API). The article offers suggestions for strategies to enhance the supply chain for this specific API in India by assessing its existing manufacturing across the supply chain process. Overall, increasing organizational profitability may be accomplished by strengthening India’s supply chain management through the creation of cogent plans and the application of data-driven decision-making. The limitation of the work is that it is not scientific enough as there is no practical implementation of any AI-based algorithms for supply chain management in the paper.

2.2. Methodology

2.2.1. Supply Chain Shipment Price Dataset

Supply chain management refers to the transportation of goods and services and includes all processes that convert raw materials into completed products. It comprises aggressively streamlining a company’s supply-side procedures to maximize customer value and gain a market advantage. The supply chain shipping pricing dataset used in this investigation was collected from Kaggle [81]. The supply chain shipping price dataset, which was utilized as the target variable, has four modes of transportation, which are classified as Air, Truck, Air Charter, and Ocean mode. Aircraft are used to deliver commodities in air freight or air charter. The data sample sizes are 10,324.
The quickest mode of transportation without a doubt is air travel. Being the most practical form of transportation and not having to deal with many natural obstacles makes it quite advantageous. Due to this advantage, regardless of a location’s geographic challenge, it is ultimately the most accessible. Except for exceptionally hefty products that would not fit inside the aircraft, many objects can be transported using airfreight service. Also known as the best method of shipping perishable goods, this technique of transportation. Air travel is without a doubt the quickest means of transportation. It is incredibly beneficial since it is the most convenient mode of transportation and does not have to contend with numerous natural impediments. Because of this benefit, it is eventually the most accessible to all locations, regardless of geographical obstacles. Most things may be delivered via airfreight service, apart from particularly heavyweight items that may not fit within the aircraft. This means of transportation is also recognized as the finest mode of shipment for perishable commodities.
When compared to other types of transportation, air shipping is frequently the most expensive. Express shipping refers to things that are transported using air transport since the shipment pace is faster, the products are delivered sooner, and the procedure is somewhat more expensive. You may anticipate your items to arrive in 1 to 2 days if you choose air transport. One of the oldest modes of moving products is via land, for example, by truck. When it comes to shipping products within a country or across borders, this is the most practical option. Trucks are commonly employed to move things across highways because they have large cargo compartments that can accommodate heavier objects like building materials and even autos. This means of transportation is less expensive than the others. However, it is possible that the goods will take longer to arrive at their destination. Railways are another mode of land transportation. Because rail freight is less expensive and can move bigger commodities across the country, it provides a number of benefits. Shipping Through Sea (Ocean) is the term used to describe shipping by sea for a variety of uses, such as commercial or military. It is a technique for shipping comparatively bigger amounts of material using cargo ships in which the cargo is first loaded into a vessel before being packed into containers. Almost everything may be transported by water, however, if you want your product delivered fast, shipping products by sea is not advised. However, as input variables, we utilized line-item value, line-item insurance, and line-item quantity. Any Sales Order or Purchase Order that we may place for distinct items on the same Purchase Order or Sales Order is referred to as a Line Item. All the things requested are mentioned one after the other in the Sales/Purchase Order, whereas the Line of Insurance refers to the coverage provided under the specific policy being purchased.

2.2.2. Long Short-Term Memory (LSTM)

Deep learning is a sort of neural network with several layers, commonly referred to as deep structured learning. These networks do better than standard neural networks at remembering information from prior occurrences. One such device that employs many networks in a loop is a recurrent neural network (RNN). Thanks to networks that are in a closed loop, the information may be kept. Each network in the loop gets information and input from the preceding network, takes the required action, and produces output while sending the information to the next network. Only recent information is required by certain applications, but more historical data may be desired by others. The common recurrent neural networks experience learning delays when the gap between the moment of necessity and the required prior information expands. However, a kind of RNN called Long Short-Term Memory (LSTM) Networks [82] can learn such occurrences. These networks have been created expressly to get over the recurrent networks’ problem with long-term reliance. The ability to recall information over a long period of time is a strength of LSTMs. The validity of the model may be impacted by extra previous information, hence LSTMs are an obvious option for usage. The four neural network layers that make up a standard LSTM module sometimes referred to as a repeating module, interact in a special way. The LSTM is represented mathematically as follows:
f t = α W f · h t 1 , x t + b f
  i t = α W i · h t 1 , x t + b i
  c t = tanh W c · h t 1 , x t + b c
  o t = α W o · h t 1 , x t + b o
  h t = o t × tan h c t
where f t is the forget gate at time step t ,   i t is the input gate at time step t ,   c t is the cell gate at time step t ,   o t is the output gate at time step t ,   h t is the hidden state at time step t ,   h t 1 is the previous hidden state at time step t ,   o t is the output gate at time step t ,   α is the activation function, W f ,   W i ,   W c , W o are the weight of forget gate, input gate, cell gate, output gate respectively and b f ,   b i ,   b c , b o are bias of forget gate, input gate, cell gate, ouput gate.

2.2.3. One Dimensional Convolutional Neural Network (1D-CNN)

A convolutional neural network (CNN) [83] can mine data in depth because of its incredible feature extraction capabilities. A convolutional neural network (CNN) is a two-dimensional image processing technique. A convolution kernel glides across an image, extracting pixel information and allowing image classification and identification. A one-dimensional convolutional neural network (1D-CNN) is a modified form of CNN. The convolution layers of 1D-CNN [84] have one-dimensional filters and a one-dimensional spectral input layer. 1D-CNN is made up of convolutional layers, max-pooling layers, and fully connected layers.
The mathematical representation of 1D-CNN is:
x = β i = 1 n c o n v 1 D W o i + b i
where x is the input, β is the activation function, n represents the number of feature maps in the layer, W represents the trainable one-dimensional convolutional kernel, x i represent i th feature map, b i represent the bias of the i th feature map, o i is the output of the i th neuron.

2.2.4. Bayesian Optimization with Tree-Structured Parzen Estimators

The goal of hyper-parameter optimization in machine or deep learning is to determine the hyper-parameters of a particular machine or deep learning algorithm that provide the highest performance when tested against a validation set. A number of hyper-parameters influence the predictive accuracy of the models. It is critical to tune these hyper-parameters in a reasonable manner. However, unlike conventional parameter optimization, hyper-parameter optimization is a combinatorial optimization issue that cannot be solved using the gradient descent approach. Furthermore, because every hyper-parameter alteration necessitates retraining to assess the effect, computation for evaluating a collection of hyper-parameter configurations is particularly demanding. Bayesian Optimization will be used in this work along with probabilistic regression models such as tree-structured parzen estimators. According to [85] the configuration space is limited to a tree-structured parzen estimator, which gives a straightforward approach for determining the model and determining local optimal hyper-parameter settings. Bayesian Optimization using a Tree-Structured Parzen Estimator is mathematically expressed as follows:
  p s a | b = l b   i f   a > a * g b   i f   a a *  
E I a = a m i n max ( a m i n a b , 0 ) p s a | b d a
where a is the set of objective vectors, l b is the probability density function, g b is the probability density function of the remaining observation, a m i n is current minimum loss, a b is the loss under the hyper-parameter setting b .   E I is the expected improvement, b is the local optimal hyper-parameter setting.

2.2.5. Target Variable Class Imbalance

The above-mentioned target variable resulted in some class imbalance. For example, in Figure 1, there is a class imbalance in shipping methods, with air accounting for 53.5 percent, truck accounting for 34.1 percent, air charter accounting for 8.0 percent, and ocean accounting for 4.5 percent. To compensate for the imbalance, we employed AllKNN (All K Nearest Neighbor) by [44]. Because the number of neighbors of the internal closest neighbors algorithm is raised at each iteration, AllKNN differs from other under-sampling techniques. This strategy employs the closest neighbor’s algorithm for the class based on its difficulty in learning. The methods have a comparable impact by removing noisy data around the class borders. This makes deep learning more successful at finding underrepresented classes. Figure 1 demonstrates that air medical transport has been a significant mode of transportation since it can move very quickly, which is quite useful in an emergency. They can deliver the medications and patients to the required location. This is because the airways are not backed up and can quickly go to the desired location.

3. Model Specification

We compared the performance of two widely used deep learning techniques. In this case, we contrasted a one-dimensional convolutional neural network with long short-term memory (LSTM) (1D-CNN). Deep learning or deep structured learning refers to neural network types with many layers, such as LSTM or 1D-CNN. When it comes to recalling information from prior occurrences, these networks perform better than normal neural networks. The network’s closed-loop design keeps the information safe. Every network in the loop gets input and data from the preceding network, performs the specified action, and then outputs data while sending them to the next network. While some applications just require the most recent data, others may call for more historical data. Such examples can be learned by Recurrent Neural Networks (RNNs), specifically Long Short-Term Memory (LSTM) Networks [86]. These networks are specially designed to circumvent the recurrent networks’ issue with long-term dependency. Long-term memory systems (LSTMs) are effective in recalling information. The validity of the model may be impacted by extra previous information; hence LSTMs are an obvious option for usage. The LSTM block contains four gates: cell state gate retains g information over time, forget gate g f regulates the extent of the value maintained in the cell, input gate g i controls the extent of the value flow in the cell, and the output gate g o controls the extent of the value in the cell to be utilized for computing the output. A completely linked layer and an activation function are included in each gate. The LSTM block also has three inputs: cell state s t 1 ; previously hidden state h t 1 ; and current input x t , as well as three outputs: cell state s t ; hidden state h t ; and current output y t . The current output is created depending on the hidden state. The mathematical formulation of the LSTM units is as follows:
g f = γ W f x t , h t 1
g i = γ W i x t , h t 1
g = tan h W x t , h t 1
g o = γ W o x t , h t 1
s t = g f s t 1 g i g
h t = g o tan h s t
y t = γ W h t
A unified neural network of 1D-CNN, on the other hand, is made up of 12 layers: five 1D convolutional neural network (1D-CNN) layers, two dropout layers, one max-pooling layer, one flattened layer, and three fully connected layers. The signals are first routed via the first convolutional layer, which has a filter size of 32. The kernel of the first layer of our proposed 1D-Convolutional network is set to 3, indicating that all weights will be shared by every stride of the signal’s input and output layers. The filter size is raised from 32 to 64 in the second 1D-convolutional layer, and the kernel size is adjusted to 3 in all 1D convolutional layers. Furthermore, the filter size is set to 128 in the third 1D-convolutional layer, but the padding is set to the same value in all three 1D-convolutional layers. The fourth layer is a max pooling layer that is used to down-sample the input representation from layer three. The pooling size is set to 3, the strides are set to 2, and the padding is set to the same. The fifth and seventh convolutional layer filter sizes are increased to 256 and 512, respectively, with the same padding and kernel size set to 3. The sixth and eighth layers are dropout layers with a value of 0.2 that are positioned between the fifth and sixth convolutional layers to reduce overfitting. The ninth layer is a flattening layer that reduces the input data to a single dimension. The flatten layer’s single dimension was fed into the fully connected layer 10 with 512 nodes, and the leaky ReLU activation function was employed in all activation functions. Layer 11 has 256 nodes and is completely connected. After passing through Layer 11, data are delivered into the last fully linked layers with a linear activation function for final prediction. Figure 2 is the block diagram of the proposed model. The mathematical expressions for the 1D-convolutional neural network ( y ), Leaky ReLU activation ( β ), max pooling ( m p e ), and dropout ( d ) layers are as follows:
y = β i = 1 n c o n v 1 D W x i + b i
β = { β x ,   f o r   0 < x 0 }
m p e = max ( m p e 1 : e e 1 < e + s )
d = i = 1 n w i δ i x i

3.1. Repeated k-Fold Cross Validation

To improve the predicted performance of deep learning [87,88] models, repeated k-fold is utilized in this study. As for regression and classification models, it may be used for both [89,90,91,92]. Provide the mean result across all folds from all runs by simply iterating the k fold cross-validation approach several times. The supplied dataset will be divided into k folds according to the first input k, which is specified to be 5 (or subsets). On the k-1 subsets, the model is trained, and its performance is assessed using the remaining subset. These stages will be repeated up to a limit of two times, which will be determined by the algorithm’s second parameter. Each iteration of the repeated k-fold cross-validation is a conventional k-fold algorithm implementation. To begin, the dataset is divided into k subsets, each of which is randomly assigned a number between 1 and 5. The subset is used as a validation set, with the remaining subsets being used for training. On the validation or test set, the model is trained and assessed. The prediction error is also determined, and the step is performed k times. Finally, the total prediction error is calculated by averaging the prediction errors in each scenario.

3.2. Other Related Works

Chen et al. [93] proposed a new disease diagnosis and treatment recommendation system to make the best use of the sophisticated medical equipment found in modern hospitals and the depth of expertise of skilled physicians. First, a Density-Peaked Clustering Analysis (DPCA) technique for illness-symptom clustering is proposed in order to more precisely and effectively identify disease symptoms. Additionally, the Apriori algorithm does association studies on disease-diagnosis (D-D) rules and disease-treatment (D-T) rules independently. Even if they are in a constrained therapeutic setting, patients and novice doctors are advised to receive the proper diagnosis and treatment plan. A parallel solution was also implemented using the Apache Spark cloud platform in order to achieve the objectives of high throughput and low response latency. Comprehensive experimental results show that the proposed system efficiently achieves illness-symptom clustering and provides intelligent and precise disease treatment suggestions. The proposed system’s weakness is the lack of evaluation of the efficiency of disease diagnostic and treatment methods.
Wang et al. [94] developed a novel system for solving the problem of incremental group-level popularity prediction. The two key phases are restarting CP decomposition to reduce cumulative error and progressively forecasting by utilizing progressive CP decomposition. In terms of forecast accuracy and running time, extensive empirical studies show that IGPP performs better than other baselines. The study concentrated mostly on investigating dynamic diffusion throughout the temporal dimension. The authors also expanded the applications of our incremental methodology in big data environments and explored more general incremental approaches that can describe the evolving groups over time.
Chen et al. [95] applied a Periodicity-based Parallel Time Series Prediction (PPTSP) technique for large-scale time-series data that is suggested and implemented in the Apache Spark cloud computing environment. A Time Series Data Compression and Abstraction (TSDCA) approach is described to efficiently manage the enormous historical datasets. This algorithm can scale down the data while properly retrieving the features. On the basis of this, they suggested a Multi-layer Time Series Periodic Pattern Recognition (MTSPPR) algorithm employing the Fourier Spectrum Analysis (FSA) technique. A Periodicity-based Time Series Prediction (PTSP) algorithm is also suggested. The models for all prior periods are used to forecast data for the later period, and a temporal attenuation factor is added to reduce the influence of the various periods on the outcome of the prediction. Additionally, they developed a parallel approach on the Apache Spark platform, utilizing the Streaming real-time computing module, to enhance the performance of the suggested algorithms. Extended experimental results demonstrate that, in terms of prediction accuracy and performance, the PPTSP approach has a significant edge over competing algorithms.
Pu et al. [96] developed a new attention convolution neural network (named ED-ACNN) for anticipating the movement of people in every area of a city center, using historical human traffic data, and it is based on an encoder-decoder architecture. The proposed system is capable of learning all the spatial and temporal interrelations of vehicular images, including proximity, period, and pattern. The effectiveness of the method was assessed using three different real-world datasets from Beijing and New York City. It outperformed ten widely used baselines in terms of accuracy and efficiency, proving that the suggested approach is more suitable for predicting traffic flow. Experimentally, Beijing and New York City’s two distinct forms of population flow were thoroughly evaluated, and the findings demonstrate that the suggested approach can be highly competitive with leading-edge thresholds.
Fillipe et al. [97] applied long short-term memory (LSTM) as a model for forecasting time series. The model focused on a large volume of data from a time series characterized by nonlinearities. However, Oyewola et al. [98] developed a novel Auditory Algorithm, which follows the pathway of the auditory system like that of the human ear. The results show that the auditory algorithm preforms better than other algorithms considered in the paper.

4. Results and Discussion

In this section, the dataset and developed models such as the Long Short-Term Memory (LSTM) and One Dimensional Convolutional Neural Network (1D-CNN) were subjected to repeated K fold cross-validation. Python 3.6, numpy, sklearn, keras, imblearn, pandas, matplotlib, seaborn, and plotly are the python packages used in this work. The hyperopt library in Python is used to perform Bayesian hyperparameter optimization. The supply chain dataset’s missing values were shown using a heatmap. The heatmap in Figure 3 shows two colors: red for missing data and green for remaining values with no Nan values. Shipment Mode, Dosage, and Line-Item Insurance contain missing values.
Correlation heatmaps are heatmaps that display the degree of correlations between numerical variables. The links between variables and their strength are visualized using correlation graphs. Every numerical variable in a correlation plot is typically represented by a column. The rows reflect the connections between each pair of variables. The values in the cells represent the strength of the correlation; positive values represent a positive relationship, while negative values represent a negative association. The strength of potential relationships between variables may be evaluated using heatmaps of correlation. Additionally, linear, and nonlinear correlations, as well as outliers, may be found using correlation plots. It is easy to quickly spot relationships between variables because of the color coding of the cells. Correlation heatmaps may be used to discover both linear and nonlinear relationships between data. Line-Item Quantity is substantially connected with Line-Item Insurance, as seen in Figure 4, with a correlation value of 0.8. Meanwhile, the Pack Price has a 0.6 correlation coefficient with Unit Price, although Unit Price is unaffected by Unit of Measure or ID.
The data peaks are displayed using a violin plot, which is a mix between a box plot and a kernel density plot. It serves as a representation of the distribution of numerical data. Violin plots display summary statistics as well as the density of each variable, as opposed to box plots, which can only offer summary statistics. The median can be seen as a white dot in violin plots. Conversely, the narrow gray line represents the remaining portion of the distribution, while the wide gray bar in the middle displays the interquartile range. On either side of the gray line, a kernel density estimation is displayed to demonstrate how the data are distributed. The violin plot is divided between broader and skinnier parts, with wider areas representing a greater likelihood that members of the population would adopt the given value and skinnier areas representing a lower probability. As seen in Figure 5, the median Pack Price for Pediatric and Adult is about 1 but with a greater likelihood, whereas the median Pack Price for ACT is around 45 but with a lower chance. Furthermore, with a decreased chance, the median Pack Price for Malaria is about 30.
The performance of the deep learning models used in this study was enhanced with the aid of repeated k-fold cross-validation. This merely involves repeating the cross-validation process and reporting the average outcome across all folds from all runs. The supply chain shipping data are separated into five folds and repeated twice in this approach, as shown in Table 1, Table 2, Table 3, Table 4, Table 5 and Table 6. When training our models, we must consider loss and accuracy. Loss is a metric that represents the sum of our model’s errors. It determines how well or poorly our model is performing. Furthermore, accuracy assesses how well our model predicts by comparing model predictions to true values in percentage terms. Table 1 displays the Loss and Accuracy of Long Short-Term Memory (LSTM). The Loss is within the range of 1.3907 and 1.4682, which means that the model does not perform well. Also, the accuracy in Table 1 is within the range of 50 and 55 which shows that the accuracy is low. Since the loss is low and accuracy is low, it means the LSTM model is not performing well. Table 2 displays the Loss and Accuracy of the One-Dimensional Convolutional Neural Network (1D-CNN). The Loss is within the range of 1.3 and 1.4 while the accuracy is within the range of 52 and 55. Both the loss and accuracy were very low. It means that 1D-CNN is not performing well.
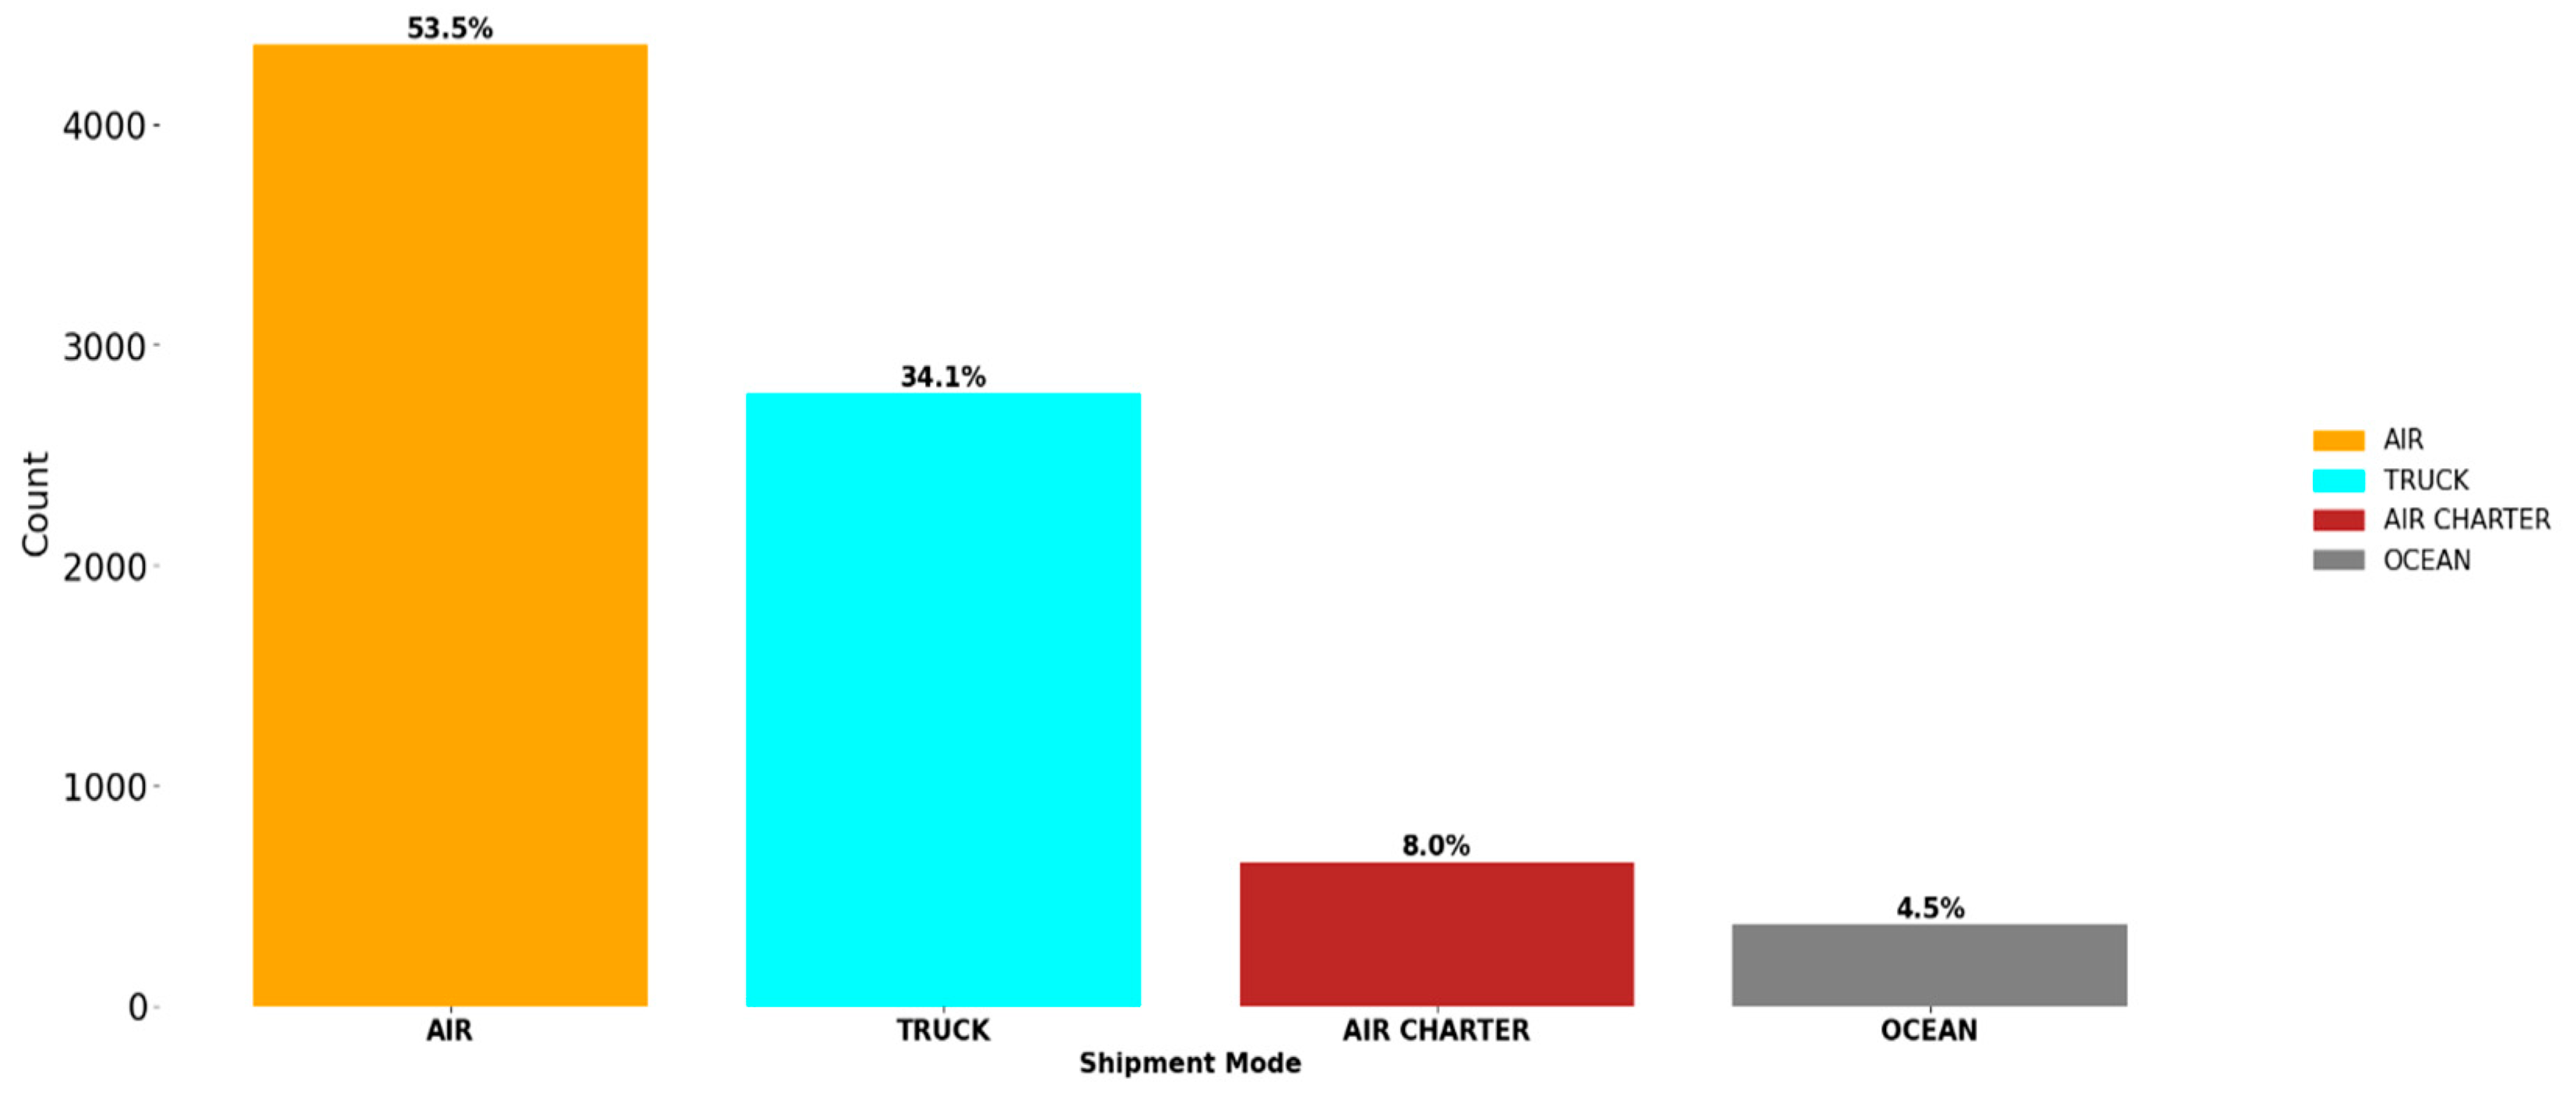
By keeping all the data from the minority class and lowering the size of the majority class, under-sampling is a method for balancing disparate datasets. As demonstrated in Figure 1, there were uneven classes in target variables such as shipment mode. The dataset was undersampled using AllkNN. The Loss and Accuracy of LSTM and 1D-CNN with AllKNN are shown in Table 3 and Table 4. The accuracy of LSTM has increased from 50% to 63%, indicating that the model outperforms the prior model. To fine-tune the deep learning methods in Table 3 and Table 4, Bayesian Optimization (BO) using a tree-structured parzen estimator was used. Bayesian Optimization is a method for finding the lowest or maximum of an objective function that uses the Bayes Theorem to guide the search. In many real-world analytics applications, optimizing a function is critical. By optimization, we imply determining the objective function maximum or minimum with a certain set of parameter combinations. Table 5 and Table 6 show the outcomes of hyperparameter adjustment for LSTM+AllkNN and 1D-CNN+AllkNN. Table 5 and Table 6 show a slight improvement in accuracy, indicating that the accuracy is performing well. Table 7 shows all of the parameters used in LSTM+AllkNN and 1D-CNN+AllkNN before and after Bayesian Optimization using the Tree Parzen estimator in LSTM+AllkNN and 1D-CNN+AllkNN, respectively. After using Bayesian Optimization, there is a modest rise in the parameter. The pie chart of the overall Loss of LSTM, 1D-CNN, LSTM+AllkNN, 1D-CNN+AllkNN, LSTM+AllkNN+BO, 1D-CNN+AllkNN+BO is shown in Figure 5. 1D-CNN+AllkNN has a relatively low percentage loss compared to other models, indicating that the model outperforms the others. Furthermore, Figure 6 depicts the pie chart of the overall loss of LSTM, 1D-CNN, LSTM+AllkNN, 1D-CNN+AllkNN, LSTM+AllkNN+BO, and 1D-CNN+AllkNN+BO. The results show that 1D-CNN+AllkNN+BO has the lowest loss with 15.3% while LSTM and 1D-CNN have the highest loss with 18.3%. Figure 7 depicts the overall accuracy of LSTM, 1D-CNN, LSTM+AllkNN, 1D-CNN+AllkNN, LSTM+AllkNN+BO, and 1D-CNN+AllkNN+BO. The ranking is topped by 1D-CNN+AllkNN, which has an extremely high accuracy of 17.6 percent. This means that the model performs admirably in supply chain management.

5. Conclusions

This research was conducted with the goal of enhancing supply chain management, and saving time and money by doing away with manual intervention. Based on our findings, we demonstrated that Bayesian Optimization with the tree parzen estimator and AllkNN may be used to optimize deep learning models such as Long Short-Term Memory (LSTM) and One Dimensional Convolutional Neural Network (1D-CNN). The experimental results showed that combining 1D-CNN, AllkNN, and Bayesian Optimization with a tree parzen estimator may increase the accuracy of the supply shipment price datatset. This research, like any other study, has some limitations. There is a chance that bias crept in because all of our samples were gathered via the Kaggle website. Furthermore, despite our best efforts, it is possible that the sample we gathered from the industry was not large enough to reflect the whole sector. Due to these limitations, further research must be done with larger samples across other industries in order to gain fresher insights.
In the future, we hope to broaden our empirical studies to include other and bigger configuration spaces, as well as increase the number of iterations and datasets. We may also mitigate the problem of overfitting in deep learning by reshuffling the train and validation split for each function evaluation. Machine learning techniques are an area of interest that we have not addressed. For supply chain management classification, machine learning techniques can be used with Bayesian Optimization approaches. The goal of Bayesian model-based optimization is to minimize the number of times the objective function must be run by evaluating just the set of hyperparameters that has shown the most promise in prior calls to the evaluation function. The Tree-structured Parzen Estimator (TPE) is a sequential model-based optimization in which models are constructed progressively to estimate the performance of hyperparameters based on previous measurements, and then new hyperparameters are chosen to test based on this model.

Author Contributions

Conceptualization, D.O.O., E.G.D., T.O.O. and O.O.O.; methodology, D.O.O. and E.G.D.; software, D.O.O.; validation, D.O.O., E.G.D., T.O.O., O.O.O. and O.E.; formal analysis, D.O.O., E.G.D., T.O.O., O.O.O. and O.E.; investigation, D.O.O.; resources, O.O.O. and O.E.; data curation, D.O.O., E.G.D., T.O.O., O.O.O. and O.E.; writing—original draft preparation, D.O.O., E.G.D., T.O.O., O.O.O.; writing—review and editing, D.O.O., E.G.D., T.O.O., O.O.O. and O.E.; visualization, D.O.O., E.G.D., T.O.O., O.O.O. and O.E. All authors have read and agreed to the published version of the manuscript.

Funding

This research received no external funding, and the APC was funded by Virginia Tech University research support to O.E.

Institutional Review Board Statement

Not applicable.

Informed Consent Statement

Not applicable.

Data Availability Statement

The dataset used was obtained from Kaggle (a freely available online open-access database); https://www.kaggle.com/code/divyeshardeshana/supply-chain-shipment-price-data-analysis/data (accessed on 10 August 2022). There is no need to obtain any consent whatsoever.

Acknowledgments

OE was supported with institutional research support from Virginia Tech University, USA.

Conflicts of Interest

The authors declare no conflict of interest. The funders had no role in the design of the study; in the collection, analyses, or interpretation of data; in the writing of the manuscript; or in the decision to publish the results.

References

  1. Oluwagbemi, O.O.; Oladipo, E.K.; Kolawole, O.M.; Oloke, J.K.; Adelusi, T.I.; Irewolede, B.A.; Dairo, E.O.; Ayeni, A.E.; Kolapo, K.T.; Akindiya, O.E.; et al. Bioinformatics, Computational Informatics and Modeling Approaches to the Design of mRNA COVID-19 vaccine candidates, the Special Issue Computation to Fight SARS-CoV-2 (COVID-19). Computation 2022, 10, 117. [Google Scholar] [CrossRef]
  2. Oluwagbemi, O.O.; Oladipo, E.K.; Dairo, E.O.; Ayeni, A.E.; Irewolede, B.A.; Oyewole, M.P.; Ogunrinde, B.H.; Olawale, B.M.; Adegoke, H.M.; Jimah, E.M.; et al. Computational construction of a glycoprotein multi-epitope subunit vaccine candidate for old and new South-African SARS-CoV-2 virus strains. Inform. Med. Unlocked J. 2022, 28, 100845. [Google Scholar] [CrossRef] [PubMed]
  3. Stonbraker, S.; Cho, H.; Hermosi, G.; Pichon, A.; Schnall, R. Usability Testing of a mHealth App to Support Self-Management of HIV-Associated Non-AIDS Related Symptoms. Stud. Health Technol. Inform. 2018, 250, 106–110. [Google Scholar] [PubMed]
  4. Oluwagbemi, O.O.; Oluwagbemi, F.E.; Jatto, A.; Hui, C. MAVSCOT: A fuzzy logic-based HIV diagnostic system with indigenous multi-lingual interfaces for rural Africa. PLoS ONE 2020, 15, e0241864. [Google Scholar] [CrossRef] [PubMed]
  5. Nasution, M.A.F.; Toepak, E.P.; Alkaff, A.H.; Tambunan, U.S.F. Flexible docking-based molecular dynamics simulation of natural product compounds and Ebola virus Nucleocapsid (EBOV NP): Acomputational approach to discover new drug for combating Ebola. BMC Bioinform. 2018, 19, 419. [Google Scholar] [CrossRef] [Green Version]
  6. Oluwagbemi, O.; Oluwagbemi, F.; Abimbola, O. Ebinformatics: Ebola Fuzzy Informatics Systems on the diagnosis, prediction, and recommendation of appropriate treatments for Ebola Virus Disease (EVD). Inform. Med. Unlocked 2016, 2, 12–37. [Google Scholar] [CrossRef] [Green Version]
  7. Tom-Aba, D.; Olaleye, A.; Olayinka, A.T.; Nguku, P.; Waziri, N.; Adewuyi, P.; Adeoye, O.; Oladele, S.; Adeseye, A.; Oguntimehin, O.; et al. Innovative Technological Approach to Ebola Virus Disease Outbreak Response in Nigeria Using the Open Data Kit and Form Hub Technology. PLoS ONE 2015, 10, e0131000. [Google Scholar] [CrossRef] [PubMed] [Green Version]
  8. Oluwagbemi, O.; Olaitan, A. A Comparative Computational Genomics of Ebola Virus Disease Strains: In-silico Insight for Ebola Control. Inform. Med. Unlocked 2018, 12, 106–119. [Google Scholar] [CrossRef]
  9. Rahi, M.; Sharma, R.; Saroha, P.; Chaturvedi, R.; Bharti, P.K.; Sharma, A. Polymerase Chain Reaction-Based Malaria Diagnosis Can Be Increasingly Adopted during Current Phase of Malaria Elimination in India. Am. J. Trop. Med. Hyg. 2022, 106, 1005–1012. [Google Scholar] [CrossRef]
  10. Oluwagbemi, O.; Oluwagbemi, F.; Fagbore, O. Malavefes: A computational fuzzy voice-enabled anti-malarial drug informatics software for correct dosage prescription of anti-malaria drugs. J. King Saud Univ. Comput. Inf. Sci. 2017, 30, 185–197. [Google Scholar] [CrossRef]
  11. Kuehn, B.M. Vaccine Development Is Charting a New Path in Malaria Control. JAMA 2022, 327, 510–512. [Google Scholar] [CrossRef]
  12. Oluwagbemi, O.O.; Fornadel, C.M.; Adebiyi, E.F.; Norris, D.E.; Rasgon, J.L. AnoSpEx: A Stochastic, Spatially-Explicit Computational Model for Studying Anopheles Metapopulation Dynamics. PLoS ONE 2013, 8, e68040. [Google Scholar] [CrossRef]
  13. Owen, B.N.; Winkel, M.; Bonnington, C.; Nuwa, A.; Achan, J.; Opigo, J.; Tibenderana, J.K.; Pothin, E. Dynamical malaria modeling as a tool for bold policy-making. Nat. Med. 2022, 28, 610–611. [Google Scholar] [CrossRef]
  14. Oluwagbemi, O.; Clarance, Y.S. Computational Predictive Framework towards the Control and Reduction of Malaria incidences in Africa. Egypt. Comput. Sci. J. 2012, 36, 1–17. [Google Scholar]
  15. Li, Y.; Stewart, K.; Han, K.T.; Han, Z.Y.; Aung, P.P.; Thein, Z.W.; Htay, T.; Chen, D.; Nyunt, M.M.; Plowe, C.V. Understanding spatio-temporal human mobility patterns for malaria control using a multi-agent mobility simulation model. Clin. Infect. Dis. 2022, ciac568. [Google Scholar] [CrossRef]
  16. Oluwagbemi, O.O.; Ojutalayo, T.; Obinna, N. Development of a Secured Information System to Manage Malaria Related Cases in Southwestern region of Nigeria. Egypt. Comput. Sci. J. 2010, 34, 23–34. [Google Scholar]
  17. Ngowo, H.S.; Okumu, F.O.; Hape, E.E.; Mshani, I.H.; Ferguson, H.M.; Matthiopoulos, J. Using Bayesian state-space models to understand the population dynamics of the dominant malaria vector, Anopheles funestus in rural Tanzania. Malar. J. 2022, 21, 161. [Google Scholar] [CrossRef]
  18. Oluwagbemi, O.; Ofoezie, U.; Nwinyi, O. A Knowledge-based data mining system for diagnosing malaria related cases in Healthcare Management. Egypt. Comput. Sci. J. 2010, 34, 1–10. [Google Scholar]
  19. Burgert, L.; Reiker, T.; Golumbeanu, M.; Möhrle, J.J.; Penny, M.A. Model-informed target product profiles of long-acting-injectables for use as seasonal malaria prevention. PLoS Glob. Public Health 2022, 2, e0000211. [Google Scholar] [CrossRef]
  20. Oluwagbemi, O.; Adeoye, E.; Fatumo, S. Building a Computer-Based Expert System for Malaria Environmental Diagnosis: An Alternative Malaria Control Strategy. Egypt. Comput. Sci. J. 2009, 33, 55–69. [Google Scholar]
  21. Fadl, S.A.; Revels, J.W.; Gharai, L.R.; Hanneman, K.; Dana, F.; Proffitt, E.K.; Grizzard, J.D. Cardiac MRI of Hereditary Cardiomyopathy. RadioGraphics 2022, 42, 625–643. [Google Scholar] [CrossRef]
  22. Oluwagbemi, O.; Oluwagbemi, F.; Ughamadu, C. Android Mobile Informatics Application for some Hereditary Diseases and Disorders (AMAHD): A Complementary framework for medical practitioners and patients. Inform. Med. Unlocked 2016, 2, 38–69. [Google Scholar] [CrossRef] [Green Version]
  23. Isidro, J.; Borges, V.; Pinto, M.; Sobral, D.; Santos, J.D.; Nunes, A.; Mixão, V.; Ferreira, R.; Santos, D.; Duarte, S.; et al. Phylogenomic characterization and signs of microevolution in the 2022 multi-country outbreak of monkeypox virus. Nat. Med. 2022, 28, 1569–1572. [Google Scholar] [CrossRef]
  24. Antinori, A.; Mazzotta, V.; Vita, S.; Carletti, F.; Tacconi, D.; Lapini, L.E.; D’Abramo, A.; Cicalini, S.; Lapa, D.; Pittalis, S.; et al. Epidemiological, clinical and virological characteristics of four cases of monkeypox support transmission through sexual contact, Italy, May 2022. Eurosurveillance 2022, 27, 2200421. [Google Scholar] [CrossRef]
  25. Vandenbogaert, M.; Kwasiborski, A.; Gonofio, E.; Descorps-Declère, S.; Selekon, B.; Meyong, A.A.N.; Ouilibona, R.S.; Gessain, A.; Manuguerra, J.-C.; Caro, V.; et al. Nanopore sequencing of a monkeypox virus strain isolated from a pustular lesion in the Central African Republic. Sci. Rep. 2022, 12, 10768. [Google Scholar] [CrossRef]
  26. Yuan, Q.; Wen, Z.; Yang, K.; Zhang, S.; Zhang, N.; Song, Y.; Chen, F. Identification of Key CircRNAs Related to Pulmonary Tuberculosis Based on Bioinformatics Analysis. BioMed Res. Int. 2022, 2022, 1717784. [Google Scholar] [CrossRef]
  27. van Heusden, P.; Mashologu, Z.; Lose, T.; Warren, R.; Christoffels, A. The COMBAT-TB Workbench: Making Powerful Mycobacterium tuberculosis Bioinformatics Accessible. mSphere 2022, 7, e00991-21. [Google Scholar] [CrossRef]
  28. Harouna Hamidou, Z.; Morsli, M.; Mamadou, S.; Drancourt, M.; Saad, J. Emergence of multi-drug-resistant Mycobacterium tuberculosis in Niger: A snapshot based on whole-genome sequencing. PLoS Negl. Trop. Dis. 2022, 16, e0010443. [Google Scholar] [CrossRef]
  29. Tomas, N.; Leonelli, D.; Campoy, M.; Marthey, S.; Le, N.H.; Rengel, D.; Martin, V.; Pál, A.; Korduláková, J.; Eynard, N.; et al. Bioinformatic Mining and Structure-Activity Profiling of Baeyer-Villiger Monooxygenases from Mycobacterium tuberculosis. mSphere 2022, 7, e00482-21. [Google Scholar] [CrossRef]
  30. Ishikawa, S.; Ozeki, Y.; Suga, S.; Mukai, Y.; Kobayashi, H.; Inouchi, E.; Kaboso, S.A.; Gebretsadik, G.; Dewi, D.N.S.S.; Nishiyama, A.; et al. Monitoring IgG against Mycobacterium tuberculosis proteins in an Asian elephant cured of tuberculosis that developed from long-term latency. Sci. Rep. 2022, 12, 4310. [Google Scholar] [CrossRef]
  31. Oluwagbemi, O.O.; Ogeh, D.N.; Adewumi, A.; Fatumo, S.A. Computational and Mathematical Modeling: Applicability to Infectious Disease Control in Africa. Asian J. Sci. Res. 2016, 9, 88–105. [Google Scholar] [CrossRef] [Green Version]
  32. Oluwagbemi, O.; Oladunni, B. Diagnosis and Recommender System for Some Neglected Tropical Diseases. Int. J. Nat. Appl. Sci. 2010, 6, 181–188. [Google Scholar]
  33. Daramola, J.O.; Osamor, V.C.; Oluwagbemi, O.O. A Grid based framework For Pervasive HealthCare Using Wireless Sensors Networks: A Case for Developing Nations. Asian J. Inf. Technol. 2008, 7, 260–267. [Google Scholar]
  34. Fatumo, S.A.; Ogeh, D.N.; Oluwagbemi, O.O.; Adenmosun, O.O. Informatics tools supporting biomedical research and healthcare outcomes in Africa: Current utilization and strategies to improve access. Eur. J. Sci. Res. 2016, 138, 137–151. [Google Scholar]
  35. Oluwagbemi, O.; Jatto, A. Implementation of a TCM-based computational health informatics diagnostic tool for Sub-Saharan African students. Inform. Med. Unlocked 2019, 14, 43–58. [Google Scholar] [CrossRef]
  36. WHO. 2022. Available online: https://www.who.int/europe/news/item/23-07-2022-who-director-general-declares-the-ongoing-monkeypox-outbreak-a-public-health-event-of-international-concern (accessed on 12 August 2022).
  37. Chen, Z.; Zheng, W.; Wu, Q.; Chen, X.; Peng, C.; Tian, Y.; Sun, R.; Dong, J.; Wang, M.; Zhou, X.; et al. Global diversity of policy, coverage, and demand of COVID-19 vaccines: A descriptive study. BMC Med. 2022, 20, 130. [Google Scholar] [CrossRef]
  38. Liu, K.; Lou, Y. Optimizing COVID-19 vaccination programs during vaccine shortages. Infect. Dis. Model. 2022, 7, 286–298. [Google Scholar] [CrossRef]
  39. Kim, C.; Yee, R.; Bhatkoti, R.; Carranza, D.; Henderson, D.; Kuwabara, S.A.; Trinidad, J.P.; Radesky, S.; Cohen, A.; Vogt, T.M.; et al. COVID-19 Vaccine Provider Access and Vaccination Coverage Among Children Aged 5-11 Years—United States, November 2021–January 2022. Morb. Mortal. Wkly. Rep. 2022, 71, 378–383. [Google Scholar] [CrossRef]
  40. Mavundza, E.J.; Ndwandwe, D.; Wiysonge, C.S. COVID-19 vaccine demand protest might have increased vaccine acceptance and uptake in South Africa. Hum. Vaccines Immunother. 2022, 18, 5. [Google Scholar] [CrossRef]
  41. Essar, M.Y.; Khan, H.; Babar, M.S.; Hasan, M.M.; Rackimuthu, S.; Costa, A.C.D.S.; Ahmad, S.; Nemat, A. Mucormycosis, conflicts and COVID-19: A deadly recipe for the fragile health system of Afghanistan. Int. J. Health Plan. Manag. 2022, 37, 543–546. [Google Scholar] [CrossRef]
  42. Paintsil, E. COVID-19 threatens health systems in sub-Saharan Africa: The eye of the crocodile. J. Clin. Investig. 2020, 130, 2741–2744. [Google Scholar] [CrossRef] [Green Version]
  43. Bokhan, K. Machine Learning in Supply Chain: 8 Use Cases that Will Impress You. 2020. Available online: https://www.n-ix.com/machine-learning-supply-chain-use-cases/ (accessed on 27 June 2022).
  44. Dai, Z.; Aqlan, F.; Gao, K.; Zhou, Y. A two-phase method for multi-echelon location-routing problems in supply chains. Expert Syst. Appl. 2019, 115, 618–634. [Google Scholar] [CrossRef]
  45. Koh, S.L.; Saad, S.; Arunachalam, S. Competing in the 21st century supply chain through supply chain management and enterprise resource planning integration. Int. J. Phys. Distrib. Logist. Manag. 2006, 36, 455–465. [Google Scholar]
  46. Sadeghi, S.; Rasouli, N.; Jandaghi, G. Identifying and prioritizing contributing factors in supply chain competitiveness by using PLS-BWM techniques (case study: Payam shoes company). World Sci. News 2016, 2, 117–143. [Google Scholar]
  47. Alicke, K.; Azcue, X.; Barriball, E. Supply-Chain Recovery in Corona Virus Times—Plan for Now and the Future. 2020. Available online: http://dln.jaipuria.ac.in:8080/jspui/bitstream/123456789/1543/1/Supply-chain-recovery-in-coronavirus-times-plan-for-now-and-the-future.pdf (accessed on 5 September 2022).
  48. Fahrni, S.; Jansen, C.; John, M.; Kasah, T.; Körber, B.; Mohr, N. Coronavirus: Industrial IoT in Challenging Times; McKinsey & Company: Atlanta, GA, USA, 2020; Volume 22. [Google Scholar]
  49. Kilpatrick, J.; Barter, L. COVID-19: Managing Supply Chain Risk and Disruption; Deloitte: Toronto, ON, Canada, 2020. [Google Scholar]
  50. Seca, D. A Review on Oracle Issues in Machine Learning. arXiv 2021, arXiv:2105.01407. [Google Scholar]
  51. Biggio, B.; Roli, F. Wild patterns: Ten years after the rise of adversarial machine learning. Pattern Recognit. 2018, 84, 317–331. [Google Scholar] [CrossRef] [Green Version]
  52. Tirkolaee, E.B.; Sadeghi, S.; Mooseloo, F.M.; Vandchali, H.R.; Aeini, S. Application of machine learning in supply chain management: A comprehensive overview of the main areas. Math. Probl. Eng. 2021, 2021, 1476043. [Google Scholar]
  53. Ran, J. Intelligent Method of Supply Chain Circulation Industry Structure Based on Machine Learning. Mob. Inf. Syst. 2021, 2021, 4116497. [Google Scholar] [CrossRef]
  54. Timme, S.G.; Williams-Timme, C. The Real Cost of Holding Inventory. Supply Chain. Manag. Rev. 2003, 7, 30–37. [Google Scholar]
  55. Gumus, A.T.; Guneri, A.F.; Ulengin, F. A new methodology for multi-echelon inventory management in stochastic and neuro-fuzzy environments. Int. J. Prod. Econ. 2010, 128, 248–260. [Google Scholar] [CrossRef]
  56. Wong, S.C.; Gatt, A.; Stamatescu, V.; McDonnell, M.D. Understanding data augmentation for classification: When to warp? In Proceedings of the 2016 International Conference on Digital Image Computing: Techniques and Applications (DICTA), Gold Coast, Australia, 30 November–2 December 2016; pp. 1–6. [Google Scholar]
  57. Chepurko, N.; Marcus, R.; Zgraggen, E.; Fernandez, R.C.; Kraska, T.; Karger, D. ARDA: Automatic relational data augmentation for machine learning. arXiv 2020, arXiv:2003.09758. [Google Scholar] [CrossRef]
  58. Chawla, N.V.; Bowyer, K.W.; Hall, L.O.; Kegelmeyer, W.P. SMOTE: Synthetic minority over-sampling technique. J. Artif. Intell. Res. 2002, 16, 321–357. [Google Scholar] [CrossRef]
  59. Islahulhaq, W.W.; Ratih, I.D. Classification of Non-Performing Financing Using Logistic Regression and Synthetic Minority Over-sampling Technique-Nominal Continuous (SMOTE-NC). Int. J. Adv. Soft Comput. Appl. 2021, 13, 115–128. [Google Scholar]
  60. Wu, Y.; Chen, Y.; Wang, L.; Ye, Y.; Liu, Z.; Guo, Y.; Fu, Y. Large scale incremental learning. In Proceedings of the IEEE/CVF Conference on Computer Vision and Pattern Recognition, Long Beach, CA, USA, 15–20 June 2019; pp. 374–382. [Google Scholar]
  61. Arulkumaran, K.; Deisenroth, M.P.; Brundage, M.; Bharath, A.A. Deep reinforcement learning: A brief survey. IEEE Signal Process. Mag. 2017, 34, 26–38. [Google Scholar] [CrossRef] [Green Version]
  62. Nguyen, H.; La, H. Review of deep reinforcement learning for robot manipulation. In Proceedings of the 2019 Third IEEE International Conference on Robotic Computing (IRC), Naples, Italy, 25–27 February 2019; pp. 590–595. [Google Scholar]
  63. Giebler, C.; Gröger, C.; Hoos, E.; Schwarz, H.; Mitschang, B. Leveraging the data lake: Current state and challenges. In Proceedings of the International Conference on Big Data Analytics and Knowledge Discovery, Linz, Austria, 26–29 August 2019; Springer: Cham, Switzerland; pp. 179–188. [Google Scholar]
  64. Gregory, S.; Singh, U.; Gray, J.; Hobbs, J. A computer vision pipeline for automatic large-scale inventory tracking. In Proceedings of the 2021 ACM Southeast Conference Virtual Event, New York, NY, USA, 15–17 April 2021. [Google Scholar]
  65. Gayialis, S.P.; Kechagias, E.P.; Konstantakopoulos, G.D.; Papadopoulos, G.A. A Predictive Maintenance System for Reverse Supply Chain Operations. Logistics 2022, 6, 4. [Google Scholar] [CrossRef]
  66. Zantalis, F.; Koulouras, G.; Karabetsos, S.; Kandris, D. A review of machine learning and IoT in smart transportation. Future Internet 2019, 11, 94. [Google Scholar] [CrossRef] [Green Version]
  67. Zadgaonkar, H.; Chandak, M. Locating Objects in Warehouses Using BLE Beacons & Machine Learning. IEEE Access 2021, 9, 153116–153125. [Google Scholar]
  68. Ribeiro, A.M.N.; do Carmo, P.R.X.; Endo, P.T.; Rosati, P.; Lynn, T. Short-and Very Short-Term Firm-Level Load Forecasting for Warehouses: A Comparison of Machine Learning and Deep Learning Models. Energies 2022, 15, 750. [Google Scholar] [CrossRef]
  69. Wong, S.; Yeung, J.K.W.; Lau, Y.Y.; So, J. Technical sustainability of cloud-based blockchain integrated with machine learning for supply chain management. Sustainability 2021, 13, 8270. [Google Scholar] [CrossRef]
  70. Alnahhal, M.; Ahrens, D.; Salah, B. Dynamic Lead-Time Forecasting Using Machine Learning in a Make-to-Order Supply Chain. Appl. Sci. 2021, 11, 10105. [Google Scholar] [CrossRef]
  71. Abbas, K.; Afaq, M.; Ahmed Khan, T.; Song, W.C. A blockchain and machine learning-based drug supply chain management and recommendation system for smart pharmaceutical industry. Electronics 2020, 9, 852. [Google Scholar] [CrossRef]
  72. Shahbazi, Z.; Byun, Y.C. A procedure for tracing supply chains for perishable food based on blockchain, machine learning and fuzzy logic. Electronics 2020, 10, 41. [Google Scholar] [CrossRef]
  73. Ni, D.; Xiao, Z.; Lim, M.K. A systematic review of the research trends of machine learning in supply chain management. Int. J. Mach. Learn. Cybern. 2020, 11, 1463–1482. [Google Scholar] [CrossRef]
  74. Manasas, V. Supply Chain Optimization Using Machine Learning Methods. A Manufacturing Case Study. Master’s Thesis, School of Science & Technology, Hessaloniki, Greece, 2020. [Google Scholar]
  75. Wong, L.W.; Tan, G.W.H.; Ooi, K.B.; Lin, B.; Dwivedi, Y.K. Artificial intelligence-driven risk management for enhancing supply chain agility: A deep-learning-based dual-stage PLS-SEM-ANN analysis. Int. J. Prod. Res. 2022, 1–21. [Google Scholar] [CrossRef]
  76. Keerthana, M. Supply Chain Management Using Artificial Intelligence, ICTACT. J. Data Sci. Mach. Learn. 2021, 2, 231–234. [Google Scholar]
  77. Abu Zwaida, T.; Pham, C.; Beauregard, Y. Optimization of inventory management to prevent drug shortages in the hospital supply chain. Appl. Sci. 2021, 11, 2726. [Google Scholar] [CrossRef]
  78. Milani, M.M.; Begawan, B.S.; Darussalam, B.; Imran, M.M.A.H.; Ramashini, M.; Krishani, M. Forecasting of Supply Chain Management for Non-Communicable Diseases. In Proceedings of the International Conference on Advances in Computing and Technology (ICACT–2020), Kelaniya, Sri Lanka, 28 November 2020; pp. 85–87. [Google Scholar]
  79. Liotine, M. Shaping the next generation pharmaceutical supply chain control tower with autonomous intelligence. J. Auton. Intell. 2019, 2, 56–71. [Google Scholar] [CrossRef] [Green Version]
  80. Shah, P. Post COVID-19 Supply Chain Optimization for the Indian Pharmaceutical Industry using AI Techniques. Intersect Stanf. J. Sci. Technol. Soc. 2021, 15, 1. [Google Scholar]
  81. Ardeshana, D. Available online: https://www.kaggle.com/code/divyeshardeshana/supply-chain-shipment-price-data-analysis/data (accessed on 10 August 2022).
  82. Oyewola, D.O.; Alechenu, B.; Al-Mustapha, K.A.; Oyewande, O.V. Classification of Dementia Diseases Using Deep Learning Techniques. FUDMA J. Sci. 2020, 4, 371–379. [Google Scholar] [CrossRef]
  83. Oyewola, D.O.; Dada, E.G.; Misra, S.; Damaševičius, R. A Novel Data Augmentation Convolutional Neural Network for Detecting Malaria Parasite in Blood Smear Images. Appl. Artif. Intell. 2022, 36, 2033473. [Google Scholar] [CrossRef]
  84. Yao, D.; Liu, B.L.H.; Yang, J.; Jia, L. Remaining useful life prediction of roller bearings based on improved 1D-CNN and simple recurrent unit. Measurement 2021, 175, 109166. [Google Scholar] [CrossRef]
  85. Zhang, W.; Wu, C.; Zhong, H.; Li, Y.; Wang, L. Prediction of undrained shear strength using extreme gradient boosting and random forest based on Bayesian optimization. Geosci. Front. 2021, 12, 469–477. [Google Scholar] [CrossRef]
  86. Tomek, I. An experiment with the edited nearest-neighbor rule. IEEE Trans. Syst. Man. Cybern. 1976, 6, 448–452. [Google Scholar]
  87. Hu, J.; Qing, Z.; Liu, R.; Zhang, X.; Lv, P.; Wang, M.; Wang, Y.; He, K.; Gao, Y.; Zhang, B. Deep Learning-Based Classification and Voxel-Based Visualization of Frontotemporal Dementia and Alzheimer’s Disease. Front. Neurosci. 2021, 14, 626154. [Google Scholar] [CrossRef]
  88. Oyewola, D.O.; Dada, E.G. Exploring machine learning: A scientometrics approach using bibliometrix and VOSviewer. SN Appl. Sci. 2022, 4, 143. [Google Scholar] [CrossRef]
  89. Kim, T.-Y.; Cho, S.-B. Predicting residual energy consumption using CNN-LSTM neural networks. Energy 2019, 182, 72–81. [Google Scholar] [CrossRef]
  90. Oyewola, D.O.; Dada, E.G.; Emebo, O.; Oluwagbemi, O.O. Using Deep 1D Convolutional Grated Recurrent Unit Neural Network to Optimize Quantum Molecular Properties and Predict Intramolecular Coupling Constants of Molecules of Potential Health Medications and Other Generic Molecules. Appl. Sci. 2022, 12, 7228. [Google Scholar] [CrossRef]
  91. Oyewola, D.; Dada, E.G.; Ezekiel Omole, O.; Al-Mustapha, K.A. Predicting Nigerian Stock Returns Using Technical Analysis and Machine Learning. Eur. J. Electr. Eng. Comput. Eng. 2019, 3, 1–8. [Google Scholar] [CrossRef] [Green Version]
  92. Fold, K. Available online: https://scikitlearn.org/stable/modules/generated/sklearn.model_selection.RepeatedKFold.html (accessed on 20 July 2022).
  93. Chen, J.; Li, K.; Rong, H.; Bilal, K.; Yang, N.; Li, K. A disease diagnosis and treatment recommendation system based on big data mining and cloud computing. Inf. Sci. 2018, 435, 124–149. [Google Scholar] [CrossRef] [Green Version]
  94. Wang, J.; Jiang, W.; Li, K.; Wang, G.; Li, K. Incremental group-level popularity prediction in online social networks. ACM Trans. Internet Technol. 2021, 22, 3461839. [Google Scholar] [CrossRef]
  95. Chen, J.; Li, K.; Rong, H.; Bilal, K.; Li, K.; Philip, S.Y. A periodicity-based parallel time series prediction algorithm in cloud computing environments. Inf. Sci. 2019, 496, 506–537. [Google Scholar] [CrossRef] [Green Version]
  96. Pu, B.; Liu, Y.; Zhu, N.; Li, K.; Li, K. ED-ACNN: Novel attention convolutional neural network based on encoder–decoder framework for human traffic prediction. Appl. Soft Comput. 2020, 97, 106688. [Google Scholar] [CrossRef]
  97. Fernandes, F.; Stefenon, S.F.; Seman, L.O.; Nied, A.; Ferreira, F.C.S.; Subtil, M.C.M.; Klaar, A.C.R.; Leithardt, V.R.Q. Long Short-term Memory Stacking Model to Predict the Number of Cases and Deaths Caused by COVID-19. J. Intell. Fuzzy Syst. 2022, 42, 6221–6234. [Google Scholar] [CrossRef]
  98. Oyewola, D.O.; Ibrahim, A.; Kwanamu, J.; Dada, E.G. A new auditory algorithm in stock market prediction on oil and gas sector in Nigerian stock exchange. Soft Comput. Lett. 2021, 3, 100013. [Google Scholar] [CrossRef]
Figure 1. Shipment Mode Class Imbalance.
Applsci 12 10166 g001
Figure 2. Block Diagram of Proposed Model.
Applsci 12 10166 g002
Figure 3. Detecting Missing values in Supply Chain Shipment Dataset.
Applsci 12 10166 g003
Figure 4. Correlation Coefficient of Supply Shipment Pricing Dataset.
Applsci 12 10166 g004
Figure 5. Violin Plot of Pack Price vs Sub Classification.
Applsci 12 10166 g005
Figure 6. Overall Loss of LSTM, 1D-CNN, LSTM+AllkNN,1D-CNN+AllkNN, LSTM+AllkNN+BO, 1D-CNN+AllkNN+BO.
Applsci 12 10166 g006
Figure 7. Overall Accuracy of LSTM, 1D-CNN, LSTM+AllkNN,1D-CNN+AllkNN, LSTM+AllkNN+BO.
Applsci 12 10166 g007
Table 1. Loss and Accuracy of Long Short-Term Memory (LSTM).
IterationLoss (%)Accuracy (%)
FOLD 11.4142 × 10−754.0441
FOLD 21.3936 × 10−755.2696
FOLD 31.4682 × 10−751.9607
FOLD 41.4419 × 10−752.5735
FOLD 51.3907 × 10−752.9411
FOLD 61.4053 × 10−753.7990
FOLD 71.4725 × 10−750.9803
FOLD 81.4010 × 10−755.1470
FOLD 91.4144 × 10−754.3558
FOLD 101.4071 × 10−753.4969
Table 2. Loss and Accuracy of One Dimensional Convolutional Neural Network (1D-CNN).
IterationLoss (%)Accuracy (%)
FOLD 11.4740 × 10−752.4509
FOLD 21.4287 × 10−753.4313
FOLD 31.4243 × 10−753.4313
FOLD 41.4302 × 10−752.4509
FOLD 51.4287 × 10−753.3088
FOLD 61.4316 × 10−753.0637
FOLD 71.4243 × 10−754.0441
FOLD 81.3294 × 10−755.5147
FOLD 91.4539 × 10−752.3926
FOLD 101.3837 × 10−754.4785
Table 3. Loss and Accuracy of LSTM+AllKNN.
IterationLoss (%)Accuracy (%)
FOLD 11.2414 × 10−760.6625
FOLD 21.2883 × 10−760.0414
FOLD 31.3006 × 10−759.4202
FOLD 41.1600 × 10−762.5258
FOLD 51.2463 × 10−760.0414
FOLD 61.2809 × 10−759.2132
FOLD 71.327 × 10−758.5921
FOLD 81.2957 × 10−758.3850
FOLD 91.2908 × 10−760.4554
FOLD 101.1007 × 10−765.0103
Table 4. Loss and Accuracy of 1D-CNN+AllKNN.
IterationLoss (%)Accuracy (%)
FOLD 11.2932 × 10−760.4554
FOLD 21.1550 × 10−763.9751
FOLD 31.2661 × 10−760.2484
FOLD 41.2093 × 10−761.9047
FOLD 51.2143 × 10−761.9047
FOLD 61.2710 × 10−760.0414
FOLD 71.2365 × 10−760.0414
FOLD 81.3500 × 10−756.9358
FOLD 91.3204 × 10−758.5921
FOLD 101.2167 × 10−760.2484
Table 5. Loss and Accuracy of LSTM+AllKNN+BO.
IterationLoss (%)Accuracy (%)
FOLD 11.2426 × 10−760.4554
FOLD 21.2291 × 10−761.3871
FOLD 31.2550 × 10−760.4554
FOLD 41.2229 × 10−761.2836
FOLD 51.3167 × 10−758.5921
FOLD 61.2574 × 10−759.6273
FOLD 71.2315 × 10−761.3871
FOLD 81.2108 × 10−763.9026
FOLD 91.2678 × 10−762.2432
FOLD 101.2439 × 10−761.3943
Table 6. Loss and Accuracy of 1D-CNN+AllKNN+BO.
IterationLoss (%)Accuracy (%)
FOLD 11.2192 × 10−761.2836
FOLD 21.1617 × 10−762.7660
FOLD 31.2797 × 10−760.3519
FOLD 41.0192 × 10−763.1297
FOLD 51.2266 × 10−760.6625
FOLD 61.1618 × 10−762.2234
FOLD 71.2612 × 10−760.3512
FOLD 81.2467 × 10−760.4678
FOLD 91.160 × 10−762.3845
FOLD 101.1532 × 10−763.3267
Table 7. Parameters of Hyper parameter tuning of LSTM and 1D-CNN.
AlgorithmsBefore Bayesian OptimizationAfter Bayesian Optimization
HyperparameterValuesHyperparameterValues
LSTMUnits 1–416, 32, 64, 128Units 1–4550, 715, 146, 216
return_sequencesTruereturn_sequencesTrue
Dropout 1–40.2Dropout 1–40.2, 0.6, 0.4, 0.4
OptimizerRmspropOptimizerRmsprop
LossCategorical_crossentropyLossCategorical_crossentropy
Batch size80Batch size80
LeakyReLU0.2LeakyReLU0.2, 0.8, 0.01, 0.01
1D-CNNFilters32, 64, 128, 256, 512Filters670, 347, 948, 268
Kernel size3Kernel size3
PaddingsamePaddingsame
LeakyReLU0.001LeakyReLU0.002, 0.001, 0.001, 0.001,0.002
Pool size3Pool size3
Strides2Strides2
Dropout0.2Dropout0.3, 0.7
LossCategorical_crossentropyLossCategorical_crossentropy
Batch size80Batch size80
Publisher’s Note: MDPI stays neutral with regard to jurisdictional claims in published maps and institutional affiliations.

