Carbon Dioxide Uptake by Mortars and Concretes Made with Portuguese Cements


1
Spanish Institute of Cement and its Applications (IECA), C/José Abascal, 53, 28003 Madrid, Spain
2
CIMNE—MADRID (UPC), Pº General Martínez Campos, 41, 9º, 28010 Madrid, Spain
3
Department of Geological and Mines Engineering, Mine and Energy Engineering School, Technical University of Madrid (UPM), C/Ríos Rosas, 21, 28003 Madrid, Spain
4
Oficemen, C/José Abascal, 53, 28003 Madrid, Spain
*
Author to whom correspondence should be addressed.
Appl. Sci. 2020, 10(2), 646; https://doi.org/10.3390/app10020646
Submission received: 16 December 2019
/
Revised: 9 January 2020
/
Accepted: 14 January 2020
/
Published: 16 January 2020
(This article belongs to the Special Issue Carbon Capture and Utilization)
Abstract
:Featured Application
The Guidelines for National Greenhouse Gas Inventories, published in 2006 by the Intergovernmental Panel on Climate Change (IPCC), provides the procedure to calculate national GHGs emissions. However, it does not consider the net carbon dioxide emissions by the Portland cement clinker (released by the calcination process in the clinker fabrication minus concrete carbonation). This paper is a practical example of the net assessment to be followed.
Abstract
As the cement industry continues to address its role in the climate crisis, Portugal’s cement industry has started to calculate its net CO2 emissions to become an entirely carbon neutral sector. These emissions are calculated by simply subtracting the total CO2 uptake due to mortar and concrete carbonation from the total CO2 that is emitted during the calcination process (clinker production). However, the procedures given in the Intergovernmental Panel on Climate Change (IPCC) Guidelines for National Greenhouse Gas (GHG) Inventories to report GHG emissions do not contain any element that would grant this calculation method the status of an internationally recognized procedure. Therefore, some climate models are not accurate because they do not account for the carbon dioxide uptake due to concrete and mortar carbonation, as is evidenced in this paper. Climate models have improved since the IPCC’s Fourth Assessment Report (AR4), but they can further improve by implementing carbon dioxide uptake by cement-based materials. In the present paper, a quick and easy method of evaluating net CO2 emissions is utilized (simplified method) along with an advanced method. Portuguese net CO2 emissions of the cement produced from 2005 to 2015 were calculated while taking carbon dioxide uptake during the service-life and end-of-life and secondary usage stages into account. Following the simplified method, 8.7 million tons of carbon dioxide were found to be uptake by mortars and concretes made with Portuguese cement over the ten-year period, in which 37.8 million tons were released due to the calcination process. In addition, an advanced method has been used to estimate the carbon dioxide uptake, which provided only slightly higher results than that of the simplified method (9.1 million tons).
1. Introduction
Concrete is a key, sustainable building material that was initiated by the modern society at the beginning of the 21st century. Concrete helps in the development of cities, regions and countries. Its pervasive importance is because it is possible to apply in many civil engineering and buildings uses with a relative low cost. Long-term reinforced concrete structures such as bridges, pipes, highways, and buildings demonstrate the indisputable high durability of this essential material and, therefore, its sustainability.
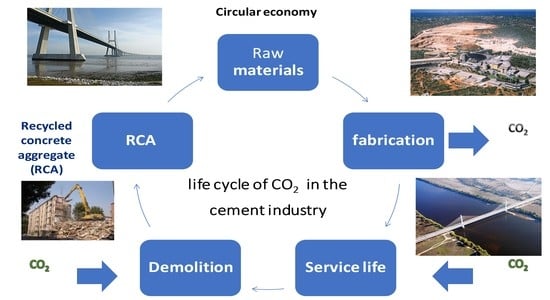
Cement is concrete’s main constituent because is responsible for the binding of all the components, which comprise, at least, clinker and gypsum. More sustainable cements also contain different amounts of industrial wastes such as coal fly ash, ground granulated blast-furnace slag, and/or silica fume. Clinker production requires the calcination of the limestone used as raw material. This reaction produces huge amounts of carbon dioxide, which is emitted into the atmosphere. Consequently, the reduction of these carbon dioxide emissions is paramount for a better future. On the other hand, mortars and concretes suffer a well-known chemical reaction named carbonation, i.e., calcium hydroxide, where C–S–H gel, ettringite, calcium aluminates, and others react with the carbon dioxide to form calcium carbonate [1]. Thanks to this chemical reaction, it can be said that part of the carbon dioxide emitted during the calcination process is reabsorbed by cement-based materials. Consequently, hydrated cement can be considered a carbon sink (Figure 1). However, the current methodology for reporting carbon dioxide emissions referred to in the Guidelines for National Greenhouse Gas Inventories [2,3], published by the Intergovernmental Panel on Climate Change (IPCC), does not considers the carbonation process. Therefore, carbonation is not included in national inventories. The net carbon dioxide emissions (carbon dioxide released by calcination minus carbon dioxide uptake by carbonation) should be calculated by the National Inventories of Greenhouse Gas Emissions in order to have accurate data for country reporting.
Some climate models are not accurate because they do not account for carbon dioxide uptake due to concrete and mortar carbonation. However, they can further improve the implementation of carbon dioxide uptake via cement-based materials. The need for such an improvement is based on the possibility that it could facilitate the inclusion of supplementary methodologies, not only for the sources but also for greenhouse gas (GHG) and sink effects, especially during the material’s working life phase. Thus, it is a goal of the cement industry that the IPCC recognizes a method for calculating this sink due to the carbonation of cement-based materials. That is why The European Cement Association (CEMBUREAU) has promoted the creation of the concrete CO2 sink project and has agreed to propose a methodology of the calculation of CO2 uptake [3]. According to the simplified methodology [3], during the service life of the cement-based applications, up to 20% of the process emissions that are related to the production of the cement can be absorbed. In addition, after the cement-based material’s service-life, it is sometimes recycled as secondary material, such as aggregates, and there would therefore be an extra 3% of carbon dioxide uptake [3].
The Intergovernmental Panel on Climate Change (IPCC) recognizes the physicochemical process of carbonation for carbon removal; nevertheless, it is currently not considered in the countries’ GHG emissions inventories. Consequently, the cement industry is working on developing an adequate methodology in order to allow a country to calculate the CO2 removal due to concrete and mortar carbonation.
2. CO2 Emissions by the Cement Sector
About 65% of carbon dioxide emissions of the cement sector are due to the calcination of raw materials, mainly limestone calcination, as shown in Equation (1). The remaining 35% are emitted by the fuel combustion. Consequently, about 3% of the global anthropogenic CO2 emissions can be attributed to the calcination process of the raw materials produced in clinker kilns [4]. The calcium oxide content in a clinker is 0.65 kg CaO/kg clinker; therefore, it is necessary to extract about 1.16 kg of limestone from the earth’s surface to produce 1 kg of clinker.
CaCO3 → CaO + CO2
1 kg → 0.56 kg + 0.44 kg
1.16 kg → 0.65 kg + 0.51 kg
The largest source of the carbon dioxide emissions from the Portuguese cement industry is limestone calcination (62.4%–65.4%, 2005–2015 period). The remainder is accounted for by fuel combustion (34.6–37.6, 2005–2015 period).
The content of CaO in clinkers amounts to 65%; then, the theoretical carbon dioxide emissions by calcination in the clinker production are 0.51 kg CO2/kg clinker. On the other hand, carbon dioxide emissions from fuel use depend on the type of fuel (petcoke, coal, fuel oil, alternative fuels, and so on).
The global cement sector indicators in 2014, published by The International Energy Agency (IEA) [5], showed that the cement sector was the second biggest industrial carbon dioxide emitter, in general, and the first biggest industrial process emitter, in particular (63% CO2 process and 37% energy-related carbon dioxide). In regard to energy use, the cement sector was the second biggest industrial coal user and the third biggest industrial energy user (61% coal, 13% electricity, 13% oil, 9% gas, 3% wastes, and 2% biomass). Therefore, the cement industry could play a big role in lowering carbon dioxide emissions. Particularly, carbon intensity might be reduced in several ways, such as lowering the clinker/cement ratio, increasing energy and process efficiencies, switching to fuels with lower carbon intensities, and carbon dioxide removal. In addition, after a period of time, part of these carbon dioxide emissions is absorbed by cement-based materials when the physicochemical process known as carbonation occurs. The chemistry of carbonation has been reviewed in some papers [6,7,8].
Carbon dioxide emissions per ton of cement have been lowered worldwide in the last few years [9]. Nevertheless, the production of cement is growing rapidly, achieving an amount of 4.65 billion tons in 2016 (Figure 2) [10]. Asia produces 80.5% of the world’s production, while Europe–CEMBUREAU only produces 5.3%.
Figure 3 shows the gross carbon dioxide emissions for grey clinker; the emissions shown are the direct carbon dioxide emissions, except for the on-site electricity production and the emissions from biomass fuel. Carbon dioxide emissions due to clinker production have been reduced in the last decade, as shown in Figure 3 [9], from more than 925 kg CO2/t clinker (North America) in 2005 to 825–850 kg CO2/t clinker in 2015. In particular, it should be highlighted that Portugal has experienced a significant decrease from 855 kg CO2/t clinker in 2005 to 821 kg CO2/t clinker in 2015 (Figure 3).
Additionally, it should be pointed out that the European cement industry, in general, has considerably diminished its environmental impact [9,10]. There was also a slight decrease in CO2 emissions in several countries in the 1990–2003 period, when considering both calcination process and fuel combustion per ton of cement, as shown in Figure 4 [11]. China, Spain, and Germany, among others, have exhibited a significant reduction of carbon dioxide emissions as consequence of their reduction of the clinker factor. That is, they followed a significant growing trend of blended cement production with an upward content of additions.
This downward trend can be confirmed looking at the development of the average value. The new climate change framework is paramount in order to maintain the current downward trend. For instance, European standardization has promoted the use of new ternary cements with the publication of the FprEN 197-1:2020 “Common cements – Part 1: Composition and essential characteristics”.
Five hundred million tons of carbon dioxide emissions were reported by the cement sector in 1970, and about one thousand million tons were reported in 2000. In 2010, the original value of 1970 was tripled. In the future, the use of carbon capture and storage (CCS) techniques in the cement sector will be necessary to maintain CO2 emissions at a low rate [12]. Therefore, the ultimate goal of the cement industry in regard to carbon dioxide emission levels should be about 350–400 kg CO2 per ton of cement. This objective can be achieved by increasing the addition/clinker ratio in blended cements, by using alternative fuels, by using non-carbonated raw materials, and by improving the energy efficiency.
On the other hand, the United Nations has established 17 Goals in order to implement the three legs of the sustainable development in the United Nations 2030 Agenda [13], i.e., society, environment, and economy. They are called the Sustainable Development Goals (SDGs) (Figure 5). Accordingly, the European Union has established a set of indicators to check the SDGs in Europe [14]. In particular, cement production can generate some environmental impacts, such as CO2 emissions. Nevertheless, the cement-based materials use, such as mortars and concretes, has led to the improvement of infrastructures in general, e.g., transport, water supply, and energy. Consequently, cement production plays an enormous role in human wellbeing (society) and economic development, which are two of the three legs of sustainable development.
In addition, great efforts of the cement production sector in promoting sustainable development have been acknowledged (Figure 5). Cement-based materials are essential to economic growth (Goal 8), infrastructures (Goal 9), sanitation (Goal 6), sustainable cities (Goal 11) and climate action (Goal 13).
3. CO2 Uptake of Concrete
Carbonation is a physico-chemical process that has been extensively defined and modelled (Figure 6) in the literature [1,4,6,7,8]. Figure 7 summarizes the main factors that affect the carbonation uptake by mortars and concretes. These materials consist of a solid cement matrix that contains aggregates, capillary pores, and air bubbles in its interior. When one wants to calculate the amount of carbon dioxide fixed by the cement matrix, one needs to multiply the carbonation coefficient by the square root of the time ratio. Therefore, the decreasing trend of the square-root of time is well-known. This fact means that, after a period of time, the increase of carbon dioxide uptake is negligible. Given that, the carbonation uptake process involves two distinct parts: (i) maximum carbon dioxide uptake during the first twenty to fifty years and (ii) a negligible period (Figure 6). According to Figure 6, it takes between 20 and 25 years to reach 50% of carbonation and between 70 and 80 years to reach 90% of carbonation.
According to EN 206 [15], the exposure classes, in regard to the corrosion that is induced by carbonation where concrete-containing reinforcement or another embedded metal is exposed to air and moisture, are:
- XC1: dry or permanently wet
- XC2: wet or rarely dry
- XC3: moderate humidity
- XC4: cyclic wet and dry
On the other hand, the European standard EN 1992-1-1 (Eurocode 2) [16] deals with reinforced concrete structure design in civil engineering works and buildings. In particular, Eurocode 2 describes the minimum concrete cover for reinforcement, taking account the carbonation exposure class (XC), as shown in Table 1 [16].
Based on the simplified method [3] and the advanced method, a first study for the calculation of CO2 uptake in a period of ten years (2005–2015) attributed to the Portuguese cements was carried out for this paper. Carbon dioxide emissions reported by the Portuguese cement industry and provided by the Technical Association of the Cement Industry from Portugal (ATIC) helped to estimate the percentage of reduction of CO2 emissions due to cement-based material’s sink effect.
4. Methodology
4.1. Calculation of CO2 Uptake of Concretes and Mortars Following the Simplified Method (Tier 1)
As mentioned in [3], the amount of carbon dioxide that can be absorbed during the service life of a product that is manufactured with cement can be calculated with a fixed conservative value by using the simplified methodology. This value could either be 15% or 20% of the CO2 emissions, because the process of calcination is a long way from the maximum theoretical value of carbon dioxide that can be absorbed (around 490 kg of CO2 per ton in the case of a cement without addition, CEM I). Regarding the CO2 uptake of concretes and mortars during the end-of-life period, it is estimated to be 3% of the CO2 emissions due to the process of calcination [3]. Equations (2) and (3) represent the general procedure to calculate the CO2 uptake of cement-based materials for the service life and end-of-life stages, according to the simplified method (Tier 1). In the present study, the parameters α and β were 0.20 and 0.03, respectively.
CO2 uptake (service life) = α × reported calcination emissions to the IPCC
CO2 uptake (end-of-life) = β × reported calcination emissions to the IPCC
4.2. Calculation of CO2 Uptake of Concretes and Mortars Following the Advanced Method (Tier 2)
The carbon dioxide uptake by mortars and concretes that are produced with Portuguese Portland cements can be calculated according to Equation (4).
where:
(CO2)uptake = C × CO2,max × DoC × (kco2 √ t/1000) × S/V
- (CO2)uptake: carbon dioxide content uptake, kg CO2.
- C: cement manufactured, kg cement.
- CO2,max: maximum carbon dioxide content able to be uptake, kg CO2/kg cement.
- DoC: carbonation degree, dimensionless. In this study was 0.6576.
- kco2: carbonation rate, mm/year0.5.
- t: time, years.
- S/V: surface per volume ratio, m2/m3.
5. Results
5.1. CO2 Uptake of Concretes Manufactured with Portuguese Cements Following the Simplified Method
Table 2 shows the summary of the Portuguese domestic data for clinker annual production, total absolute gross CO2 emissions (without biomass emissions), and absolute gross process CO2 emissions from cement manufacturing plants between 2005 and 2015. The theoretical uptake has been defined as 23% of all CO2 emissions due to calcination for the service life period (20%) and the end-of-life plus secondary usage stage (2% + 1% = 3%), respectively [3]. Therefore, if a factor of 0.23 is applied to the absolute gross process CO2 emissions shown in Table 2, this factor was proposed in the IVL simplified methodology [3], the results that appear in Figure 8 can be obtained.
CO2 uptake in Portuguese cement manufacturing plants has been estimated to be 8.7 million tons of CO2 during the period of 2005–2015.
5.2. CO2 Uptake of Concretes Manufactured with Portuguese Cements Following the Advanced Method
Cement consumption and the end use of concretes from 2005 to 2015 are shown in Figure 9. The key point in this methodology is the surface per volume ratio (S/V) factor selection, which depends on the type of application. The S/V of the structural elements can be divided in several groups. The S/V ratios used in the present study were three for civil works, eight for buildings, and 20 for mortars. It was assumed that the full carbonation in mortar is achieved after 10–15 years of carbonation (year 2025). The high porosity of mortars is well-known, so their carbonation rate is much higher than that of concretes. This fact justified the assumption.
The carbonation rate, kco2 (mm/year0.5), can be calculated by applying Equation (5) to the experimental results. In the present study, the carbonation rate, kco2, in concrete used in structures was estimated from the Portuguese data shown in the literature [17,18]. Figure 10 summarizes the experimental Portuguese results.
where:
- B = carbonation coefficient (mm/y0.5).
- x = carbonation depth (mm).
- t = time of natural carbonation (years).
The maximum stoichiometric amount of carbon dioxide that can be absorbed can be calculated by applying Equation (6), and the results of such a calculation are shown in Table 3.
where:
CO2,max → (CaOreactive /100) × binder × (MCO2/MCaO)
- CO2,max: maximum amount of carbon dioxide that can be absorbed, kg CO2/kg cement.
- CaOreactive: kg CaO/kg binder × 100. This value is taken as 65%.
- Binder: Amount of cement (kg).
- MCO2: 44.0 g/mol.
- MCaO: 56.1 g/mol.
By applying Equation (6) to a CEM I with 95% clinker that contains 65% CaOreactive, it can be seen that the maximum amount of carbon dioxide that can be absorbed is equal to CO2,max = (65/100) × 0.95 × (44/56) = 0.49 kg CO2/kg CEM I. This value only applies to a cement with 95% clinker (CEM I). As far as other cements are concerned, this value drops in proportion to clinker content. Table 3 has been prepared in order to rapidly display the maximum amount of carbon dioxide that the different EN 197-1 [19] cements can absorb.
The amount of carbon dioxide that can be absorbed, in kg of concrete or of mortar, during the service life of a material that is manufactured mainly with cement can be calculated from the input data and following the method described in Section 4.2. For the calculation, it must be noted that the carbonation follows a square root of time, and the carbonated depth is increasing each year following the equation: x=k∙√t. This means that the emissions produced in one year are incorporated into the concrete in the following years with a decreasing trend of time.
The carbonation coefficients used in the present paper were taken from the Portuguese literature. Nevertheless, EN 16757 [20] contains Table BB.1 to estimate the carbonation rate, kco2 (mm/year0.5) exclusively on the basis of the concrete’s compressive strength. It is true that there is a direct relationship between carbonation rate and concrete’s compressive strength when the correlation is determined with the cement itself, the type of aggregates, additives, etc. However, when one of these factors is modified, different correlations are found [21]. Therefore, it is not possible to generalize the results compiled in Table BB.1 and to apply them to all the cements that are manufactured in Europe or for all the environments to which concrete is exposed. According to Monteiro et al., the carbonation coefficient for structural elements within the XC3 class (unpainted concrete) ranges from 3.33 to 4.20 mm/year0.5 [18] and is consistent with that found in the study conducted by The Eduardo Torroja Institute of Construction Sciences - Spanish National Research Council (IETcc-CSIC) in 2010 [22]. Furthermore, the values shown in Table BB.1 (EN 16757 [20]) range from 0.50 to 16.50 mm/year0.5, i.e., they are greater than those found in actual Portuguese concretes that are manufactured in accordance with EN 206 [15]. The whole amount of carbon dioxide that can be absorbed by concretes and mortars made with Portuguese cements, consumed from 2005 to 2015, is shown in Figure 11. In addition, the growth path of carbon dioxide uptake is represented by a growing curve for each considered application (civil engineering, building and mortars). As expected, the higher the surface/volume (S/V) ratio and carbonation coefficient (kco2), the higher the carbon dioxide uptake [23].
The total amount of carbon dioxide that can be absorbed by concretes and mortars made with Portuguese cements, consumed from 2005 to 2015 while considering surface/volume (S/V) ratios of three for civil engineering works, eight for buildings, and 20 for mortars, is shown in Figure 11. It is assumed that the full carbonation in mortar is achieved after 10–15 years of carbonation (year 2025).
In addition, the growth path of carbon dioxide uptake is represented by a growing curve for each considered application (civil engineering, building and mortars). As expected, the higher the S/V ratio, the higher the carbon dioxide uptake.
In the present case, it can be observed that the carbon dioxide uptake during the ten years production period (2005–2015) was found to go from 5.6 to 7.4 million tons from 2050 to 2100. Consequently, the percentage of carbon dioxide uptake, considering the absolute gross process CO2 emissions, was in the range between 14.7% and 19.6% (Figure 12). Consequently, the simplified method agrees with the carbon dioxide uptake from the origin considered in the present study until the year 2100. Nevertheless, 9.1 million tons of carbon dioxide will be uptake in the year 2121 (24.2%), when 3% of the absolute gross process CO2 emissions due to the end-of-life stage is added to the carbon dioxide uptake reached in 2021.
Figure 12 shows the carbon dioxide uptake that was calculated by dividing the accumulated yearly absorption by the absolute gross process CO2 emissions; this is expressed in percentage. This figure represents the results obtained for the main applications of cement-based products (civil engineering works, buildings, and mortars). As result of the sharp decrease of the cement consumption from 2005 (8.705.000 tons) to 2010 (5.803.000 tons) and to the end of the investigation period, 2015 (2.745.000 tons), the relative uptake is lower as shown in Figure 12.
Comparing the results that were obtained by applying the simplified and advanced methods, it a good agreement in general is evident. However, the advanced methods allowed for a more realistic calculation and, therefore, higher results were found when using them. As such, the 8.7 million tons found when using the simplified method became 9.1 million tons when using the advanced method proposed in the present paper. Consequently, the use of advanced methods is recommended in order to get more accurate results to be used as input data in the climate models that are developed within the IPPC’s assessment report context.
Figure 13 shows the net carbon dioxide emissions by final use of the mortars, building and civil works cement consumed in Portugal from 2005 to 2015. As expected, mortars carbonated very quickly, whereas civil works concretes carbonated very slowly. Consequently, the carbon dioxide uptake performed by mortars reached about 95% in ten years. On the contrary, after one hundred years of carbonation, civil works and building concretes only reached 6.6% and 26.0%, respectively.
The Intergovernmental Panel on Climate Change (IPCC) is currently in its sixth assessment cycle and is developing three special reports, a methodology report on national greenhouse gas inventories and the Sixth Assessment Report (AR6). In regard to the shortcomings in the current climate models, which do not consider net carbon dioxide emissions, the lead and contributing authors as well as the review editors strongly encourage the improvement of such models by implementing the actual impact of the Portland cement sector, i.e., including the net carbon dioxide emissions by the Portland cement clinker (released by the calcination process in the clinker fabrication minus the carbon dioxide uptake by mortars and concrete carbonation).
6. Conclusions
The conclusions reached with this study are as follows:
- The total amount of carbon dioxide that can be absorbed by concretes and mortars made with Portuguese cements, consumed from 2005 to 2015, was found to go from 5.6 to 7.4 million tons from 2050 to 2100 when considering the surface/volume ratios of three for civil engineering works, eight for buildings, and 20 for mortars. Thus, the percentage of carbon dioxide uptake, considering the absolute gross process CO2 emissions, is in the range between 14.8% and 19.6%. Consequently, the simplified method agrees with the carbon dioxide uptake from the origin considered in the present study until the year 2100. Nevertheless, 9.1 million tons of carbon dioxide will be uptake in the year 2121 (24.2%), when 3% of the absolute gross process CO2 emissions due to the end-of-life stage is added to the carbon dioxide uptake reached in 2021.
- In the period of 2005–2015, CO2 absorption from Portuguese cements was estimated at 8.7 million tons of CO2 when using the simplified methodology and applying a factor of 0.23 (20% for service life and 3% for the end-of-life plus secondary usage stage), which is what is proposed in the IVL simplified methodology.
- Mortar’s carbon dioxide uptake was about 95% in ten years. However, civil works and building concretes only reached 6.6% and 26.0% after one hundred years of carbonation, respectively.
- As expected, short carbonation periods provide a low carbon dioxide uptake. Therefore, actual service-life periods should be considered in order to assess the whole process. In addition, the great influence of the S/V ratio on carbon dioxide uptake make this a key factor in this advanced methodology
- In regard to the shortcomings in the current climate models, which do not consider the net carbon dioxide emission (released by the calcination process in the clinker fabrication minus concrete carbonation) attributed to the Portland cement clinker production, IPCC authors are strongly encouraged to improve their climate models adding the aforementioned net carbon dioxide emissions.
Author Contributions
Conceptualization, C.A. and M.Á.S.; methodology, C.A.; software, C.A.; formal analysis, C.A.; investigation, C.A. and M.Á.S.; resources, A.Z.; data curation, C.A.; writing—original draft preparation, M.Á.S.; writing—review and editing, A.Z., P.M., C.A. and M.Á.S.; visualization, A.Z. and P.M., supervision, A.Z.; project administration, A.Z.; funding acquisition, A.Z. All authors have read and agreed to the published version of the manuscript.
Funding
This research was funded by the Technical Association of the Cement Industry from Portugal (ATIC).
Acknowledgments
We would like to express our profound gratitude to the Technical Association of the Cement Industry from Portugal (ATIC) and all individuals that have kindly collaborated with us.
Conflicts of Interest
The authors declare no conflict of interest.
References
- Sanjuan, M.A.; Estévez, E.; Argiz, C.; Del Barrio, D. Effect of curing time on granulated blast-furnace slag cement mortars carbonation. Cem. Concr. Compos. 2018, 90, 257–265. [Google Scholar] [CrossRef]
- The Intergovernmental Panel on Climate Change. 2006 IPCC Guidelines for National Greenhouse Gas Inventories; IPCC Guidelines Volume 3. Chapter 3 Industrial Processes. In IPCC Good Practice Guidance and Uncertainty Management in National Greenhouse Gas Inventories 3.1; Eggleston, H.S., Buendia, L., Miwa, K., Ngara, T., Tanabe, K., Eds.; IGES: Hayama, Japan, 2006; Available online: https://www.ipcc-nggip.iges.or.jp/public/gp/english/3_Industry.pdf (accessed on 2 December 2019).
- Stripple, H.; Ljungkrantz, C.; Gustafsson, T. CO2 Uptake in Cement-Containing Products. Background and Calculation Models for IPCC Implementation, 1st ed.; Report Number: B 2309; IVL Swedish Environmental Research Institute: Stockholm, Sweden, 2018; pp. 20–30. [Google Scholar]
- Andrade, C.; Sanjuán, M.A. Updating Carbon Storage Capacity of Spanish Cements. Sustainability 2018, 10, 4806. [Google Scholar] [CrossRef] [Green Version]
- International Energy Agency (IEA). CO2 Emissions from Fuel Combustion 2019: HIGHLIGHTS; IEA Publications: Paris, France, 2018; p. 156. Available online: http://data.iea.org/payment/products/115-co2-emissions-from-fuel-combustion.aspx (accessed on 2 December 2019).
- Sevelsted, T.F.; Skibsted, J. Carbonation of C–S–H and C–A–S–H samples studied by 13C, 27Al and 29Si MAS NMR spectroscopy. Cem. Concr. Res. 2015, 71, 56–65. [Google Scholar] [CrossRef]
- Zhou, Q.; Glasser, F. Kinetics and mechanism of the carbonation of ettringite. Adv. Cem. Res. 2000, 12, 131–136. [Google Scholar] [CrossRef]
- Morandeau, A.; Thiery, M.; Dangla, P. Investigation of the carbonation mechanism of CH and CSH in terms of kinetics, microstructure changes and moisture properties. Cem. Concr. Res. 2014, 56, 153–170. [Google Scholar] [CrossRef] [Green Version]
- World Business Council for Sustainable Development (WBCSD)—Cement Sustainability Initiative’s (CSI). Getting the Numbers Right (GNR) Project, 1st ed.; World Business Council for Sustainable Development: Geneva, Switzerland; Available online: http://www.wbcsdcement.org/index.php/key-issues/climate-protection/gnr-database (accessed on 10 September 2019).
- The European Cement Association (CEMBUREAU). Activity Report, 1st ed.; CEMBUREAU: Brussels, Belgium, 2017; pp. 1–42. Available online: https://cembureau.eu/media/1716/activity-report-2017.pdf (accessed on 2 December 2019).
- Hoenig, V.; Hoppe, H.; Emberger, B. Carbon Capture Technology—Options and Potentials for the Cement Industry, 1st ed.; European Cement Research Academy: Düsseldorf, Germany, 2007; pp. 1–96. [Google Scholar]
- International Energy Agency (IEA). Energy Technology Perspectives. Scenarios & Strategies to 2050, 1st ed.; IEA/OECD: Paris, France, 2006. [Google Scholar]
- UN General Assembly. Transforming Our World: The 2030 Agenda for Sustainable Development, 1st ed.; United Nations: New York, NY, USA, 2015. [Google Scholar]
- Eurostat. Sustainable Development in the European Union. Overview of Progress towards the SDGs in an EU Context, 1st ed.; Publications Office of the European Union: Luxembourg, 2017; pp. 1–37. [Google Scholar]
- EN 206: 2013—Concrete—Specification, Performance, Production and Conformity; European Committee for Standardization (CEN): Brussels, Belgium, 2013.
- EN 1992-1-1. Eurocode 2: Design of Concrete Structures—Part 1-1: General Rules and Rules for Buildings; European Committee for Standardization (CEN): Brussels, Belgium, 2004. [Google Scholar]
- Bettencourt Ribeiro, A.; Santos, T.; Gonçalves, A. Performance of concrete exposed to natural carbonation: Use of the k-value concept. Constr. Build. Mater. 2018, 175, 360–370. [Google Scholar] [CrossRef]
- Monteiro, I.; Branco, F.A.; de Brito, J.; Neves, R. Statistical analysis of the carbonation coefficient in open air concrete structures. Constr. Build. Mater. 2012, 29, 263–269. [Google Scholar] [CrossRef]
- Sanjuán, M.A.; Argiz, C. The new European standard on common cements specifications, EN-197-1:2011. Mater. Construcc. 2012, 62, 425–430. [Google Scholar] [CrossRef] [Green Version]
- EN 16757:2016. Sustainability of Construction Works—Environmental Product Declarations—Product Category Rules for Concrete and Concrete Elements. Annex BB (Informative). CO2 Uptake by Carbonation—Guidance on Calculation; European Committee for Standardization (CEN): Brussels, Belgium, 2016. [Google Scholar]
- Sanjuán, M.Á.; Estévez, E.; Argiz, C. Carbon Dioxide Absorption by Blast-Furnace Slag Mortars in Function of the Curing Intensity. Energies 2019, 12, 2346. [Google Scholar] [CrossRef] [Green Version]
- Galán, I.; Andrade, C.; Mora, P.; Sanjuán, M.A. Sequestration of CO2 by Concrete Carbonation. Environ. Sci. Technol. 2010, 44, 3181–3186. [Google Scholar] [CrossRef] [PubMed]
- Sanjuán, M.A.; Andrade, C.; Mora, P.; Zaragoza, A. Carbon Dioxide Uptake by Cement-Based Materials: A Spanish Case Study. Appl. Sci. 2020, 10, 339. [Google Scholar] [CrossRef] [Green Version]
Figure 1.
Life cycle of CO2 in the cement industry.

Figure 2.
World cement production in 2016 by region and main countries (4.65 billion tons) [10].
Figure 2.
World cement production in 2016 by region and main countries (4.65 billion tons) [10].

Figure 3.
Gross carbon dioxide emissions for grey clinker from 2005 to 2015 [9].
Figure 3.
Gross carbon dioxide emissions for grey clinker from 2005 to 2015 [9].

Figure 4.
CO2 emissions due to the process and the combustion per ton of cement in several countries from 1990 to 2004 [11].
Figure 4.
CO2 emissions due to the process and the combustion per ton of cement in several countries from 1990 to 2004 [11].

Figure 5.
Sustainable Development Goals (SDGs).

Figure 6.
Carbonation uptake intensity (Source: elaborated by the authors).

Figure 7.
Main factors affecting the carbonation uptake by the mortars and concretes (Source: elaborated by the authors).
Figure 7.
Main factors affecting the carbonation uptake by the mortars and concretes (Source: elaborated by the authors).

Figure 8.
Estimation of the partial absorption of carbon dioxide that is emitted due to the process of decarbonation according to the IVL simplified methodology [3] and by applying a factor of 0.23 (20% during the service life period and 3% for the end-of-life plus secondary usage stage of the CO2 emissions due to calcination).

Figure 9.
Cement consumption (solid line and left-hand scale) and end use of cement in concretes (bars and right-hand scale) from 2005 to 2015.
Figure 9.
Cement consumption (solid line and left-hand scale) and end use of cement in concretes (bars and right-hand scale) from 2005 to 2015.

Figure 10.
Carbonation rate of Portuguese concretes made with different proportions of coal fly ash and ground granulated blast-furnace slag and (a) 251 kg/m3 of cement, w/c = 0.65; (b) 342 kg/m3 of cement, w/c = 0.44; and (c) 440 kg/m3 of cement, w/c = 0.35 [17].
Figure 10.
Carbonation rate of Portuguese concretes made with different proportions of coal fly ash and ground granulated blast-furnace slag and (a) 251 kg/m3 of cement, w/c = 0.65; (b) 342 kg/m3 of cement, w/c = 0.44; and (c) 440 kg/m3 of cement, w/c = 0.35 [17].

Figure 11.
Carbon dioxide uptake (tons) considering the surface/volume (S/V) ratios of three for civil engineering works, eight for buildings, and 20 for mortars (mortars only carbonated for ten years). In addition, 3% of the absolute gross process CO2 emissions due to the end-of-life stage was added to the carbon dioxide uptake reached in 2021 (green point).

Figure 12.
Carbon dioxide uptake, i.e., carbon dioxide absorbed by cement-based materials consumed from 2005 to 2015 related to the absolute gross process CO2 emissions (t) produced from 2005 to 2015 for surface/volume (S/V) ratios of three for civil engineering works, eight for buildings, and 20 for mortars (mortars only carbonated for ten years); 3% of the absolute gross process CO2 emissions due to the end-of-life stage was added to the carbon dioxide uptake reached in 2021 (green bar).

Figure 13.
Net carbon dioxide emissions by final use (mortars, building and civil works). Carbon dioxide uptake from 2005 to 2021 in regard to the carbon dioxide released from 2005 to 2015 (%).
Figure 13.
Net carbon dioxide emissions by final use (mortars, building and civil works). Carbon dioxide uptake from 2005 to 2021 in regard to the carbon dioxide released from 2005 to 2015 (%).


Table 1.
Environmental requirement for minimum concrete cover (mm) according to reference [16] in corrosion that is induced by carbonation.
Table 1.
Environmental requirement for minimum concrete cover (mm) according to reference [16] in corrosion that is induced by carbonation.
| Environmental Requirement for Minimum Concrete Cover (mm) | Structural Class | |||||
|---|---|---|---|---|---|---|
| Exposure Class: Corrosion Induced by Carbonation | S1 | S2 | S3 | S4 | S5 | S6 |
| XC1—dry or permanently wet | 10 | 10 | 10 | 15 | 20 | 25 |
| XC2—wet or rarely dry | 10 | 15 | 20 | 25 | 30 | 35 |
| XC3—moderate humidity | 10 | 15 | 20 | 25 | 30 | 35 |
| XC4—cyclic wet and dry | 15 | 20 | 25 | 30 | 35 | 40 |
Table 2.
Clinker annual production, total absolute gross CO2 emissions (without biomass emissions), and absolute gross process CO2 emissions (kilotons) from Portuguese cement manufacturing plants between 2005 and 2015.
Table 2.
Clinker annual production, total absolute gross CO2 emissions (without biomass emissions), and absolute gross process CO2 emissions (kilotons) from Portuguese cement manufacturing plants between 2005 and 2015.
| Year | 2005 | 2006 | 2007 | 2008 | 2009 | 2010 | 2011 | 2012 | 2013 | 2014 | 2015 |
|---|---|---|---|---|---|---|---|---|---|---|---|
| Clinker annual production (kilotons) | 7865 | 7777 | 8018 | 7748 | 6164 | 6484 | 5351 | 4882 | 5427 | 5968 | 5626 |
| Total Absolute Gross CO2 Emissions (kilotons) (without biomass emissions) | 6722 | 6640 | 6811 | 6524 | 5075 | 5458 | 4455 | 4015 | 4393 | 4904 | 4621 |
| Absolute Gross Process CO2 Emissions (kilotons) | 4206 | 4141 | 4256 | 4146 | 3200 | 3471 | 2825 | 2588 | 2872 | 3162 | 2978 |
Table 3.
Maximum amount of carbon dioxide, CO2,max that the different EN 197-1 cements can absorb.
| Main Types | Type Name | Type Notation | K 1 | MAC 2 | Factor (Kcement/KCEM I) | Factor (Kcement/KCEM I) | CO2,max |
|---|---|---|---|---|---|---|---|
| kg CO2/kg Cement | |||||||
| CEM I | Portland cement | CEM I | 95–100 | 0–5 | 95/95 = 1 | 1 | 0.49 |
| CEM II | Portland-slag cement | CEM II/A-S | 80–88 | 0–5 | 80/95–94/95 | 0.84–0.99 | 0.41–0.48 |
| CEM II/B-S | 65–79 | 0–5 | 65/95–79/95 | 0.68–0.83 | 0.34–0.41 | ||
| Portland-silica fume cement | CEM II/A-D | 90–94 | 0–5 | 90/95–94/95 | 0.95–0.99 | 0.46–0.48 | |
| Portland-pozzolana cement | CEM II/A-P | 80–94 | 0–5 | 80/95–94/95 | 0.84–0.99 | 0.41–0.48 | |
| CEM II/B-P | 65–79 | 0–5 | 65/95–79/95 | 0.68–0.83 | 0.34–0.41 | ||
| CEM II/A-Q | 80–94 | 0–5 | 80/95–94/95 | 0.84–0.99 | 0.41–0.48 | ||
| CEM II/B-Q | 65–79 | 0–5 | 65/95–79/95 | 0.68–0.83 | 0.34–0.41 | ||
| Portland-fly ash cement | CEM II/A-V | 80–94 | 0–5 | 80/95–94/95 | 0.84–0.99 | 0.41–0.48 | |
| CEM II/B-V | 65–79 | 0–5 | 65/95–79/95 | 0.68–0.83 | 0.34–0.41 | ||
| CEM II/A-W | 80–94 | 0–5 | 80/95–94/95 | 0.84–0.99 | 0.41–0.48 | ||
| CEM II/B-W | 65–79 | 0–5 | 65/95–79/95 | 0.68–0.83 | 0.34–0.41 | ||
| Portland-burnt shale cement | CEM II/A-T | 80–94 | 0–5 | 80/95–94/95 | 0.84–0.99 | 0.41–0.48 | |
| CEM II/B-T | 65–79 | 0–5 | 65/95–79/95 | 0.68–0.83 | 0.34–0.41 | ||
| Portland-limestone cement | CEM II/A-L | 80–94 | 0–5 | 80/95–94/95 | 0.84–0.99 | 0.41–0.48 | |
| CEM II/B-L | 65–79 | 0–5 | 65/95–79/95 | 0.68–0.83 | 0.34–0.41 | ||
| CEM II/A-LL | 80–94 | 0–5 | 80/95–94/95 | 0.84–0.99 | 0.41–0.48 | ||
| CEM II/B-LL | 65–79 | 0–5 | 65/95–79/95 | 0.68–0.83 | 0.34–0.41 | ||
| Portland-composite cement | CEM II/A-M | 80–88 | 0–5 | 80/95–94/95 | 0.84–0.99 | 0.41–0.48 | |
| CEM II/B-M | 65–79 | 0–5 | 65/95–79/95 | 0.68–0.83 | 0.34–0.41 | ||
| CEM III | Blast furnace cement | CEM III/A | 35–64 | 0–5 | 35/95–64/95 | 0.37–0.67 | 0.18–0.33 |
| CEM III/B | 20–34 | 0–5 | 20/95–34/95 | 0.21–0.36 | 0.10–0.18 | ||
| CEM III/C | 5–19 | 0–5 | 5/95–19/95 | 0.05–0.20 | 0.03–0.10 | ||
| CEM IV | Pozzolanic cement | CEM IV/A | 65–89 | 0–5 | 65/95–89/95 | 0.68–0.94 | 0.34–0.46 |
| CEM IV/B | 45–64 | 0–5 | 45/95–64/95 | 0.47–0.67 | 0.23–0.33 | ||
| CEM V | Composite cement | CEM V/A | 40–64 | 0–5 | 40/95–64/95 | 0.42–0.67 | 0.21–0.33 |
| CEM V/B | 20–38 | 0–5 | 20/95–38/95 | 0.21–0.40 | 0.10–0.20 |
1 Clínker; 2 Minor additional constituents.
© 2020 by the authors. Licensee MDPI, Basel, Switzerland. This article is an open access article distributed under the terms and conditions of the Creative Commons Attribution (CC BY) license (http://creativecommons.org/licenses/by/4.0/).
Share and Cite
MDPI and ACS Style
Sanjuán, M.Á.; Andrade, C.; Mora, P.; Zaragoza, A. Carbon Dioxide Uptake by Mortars and Concretes Made with Portuguese Cements. Appl. Sci. 2020, 10, 646. https://doi.org/10.3390/app10020646
AMA Style
Sanjuán MÁ, Andrade C, Mora P, Zaragoza A. Carbon Dioxide Uptake by Mortars and Concretes Made with Portuguese Cements. Applied Sciences. 2020; 10(2):646. https://doi.org/10.3390/app10020646
Chicago/Turabian StyleSanjuán, Miguel Ángel, Carmen Andrade, Pedro Mora, and Aniceto Zaragoza. 2020. "Carbon Dioxide Uptake by Mortars and Concretes Made with Portuguese Cements" Applied Sciences 10, no. 2: 646. https://doi.org/10.3390/app10020646
Note that from the first issue of 2016, this journal uses article numbers instead of page numbers. See further details here.