Mechanical Characterization of Timber-to-Timber Composite (TTC) Joints with Self-Tapping Screws in a Standard Push-Out Setup


1
Department of Engineering and Architecture, University of Trieste, 34127 Trieste TS, Italy
2
Department of Civil, Construction-Architectural & Environmental Engineering, University of L’Aquila, 67100 L’Aquila AQ, Italy
*
Author to whom correspondence should be addressed.
Appl. Sci. 2020, 10(18), 6534; https://doi.org/10.3390/app10186534
Submission received: 25 August 2020
/
Revised: 15 September 2020
/
Accepted: 16 September 2020
/
Published: 18 September 2020
(This article belongs to the Special Issue Buildings and Structures under Extreme Loads II)
Abstract
:Self-tapping screws (STSs) can be efficiently used in various fastening solutions for timber constructions and are notoriously able to offer high stiffness and load-carrying capacity, compared to other timber-to-timber composite (TTC) joint typologies. The geometrical and mechanical characterization of TTC joints, however, is often hard and uncertain, due to a combination of various influencing parameters and mechanical aspects. Among others, the effects of friction phenomena between the system components and their reciprocal interaction under the imposed design loads can remarkably influence the final estimates on structural capacity, in the same way of possible variations in the boundary conditions. The use of Finite Element (FE) numerical models is well-known to represent a robust tool and a valid alternative to costly and time consuming experiments and allows one to further explore the selected load-bearing components at a more refined level. Based on previous research efforts, this paper presents an extended FE investigation based on full three-dimensional (3D) brick models and surface-based cohesive zone modelling (CZM) techniques. The attention is focused on the mechanical characterization of small-scale TTC specimens with inclined STSs having variable configurations, under a standard push-out (PO) setup. Based on experimental data and analytical models of literature, an extended parametric investigation is presented and correlation formulae are proposed for the analysis of maximum resistance and stiffness variations. The attention is then focused on the load-bearing role of the steel screws, as an active component of TTC joints, based on the analysis of sustained resultant force contributions. The sensitivity of PO numerical estimates to few key input parameters of technical interest, including boundaries, friction and basic damage parameters, is thus discussed in the paper.
1. Introduction
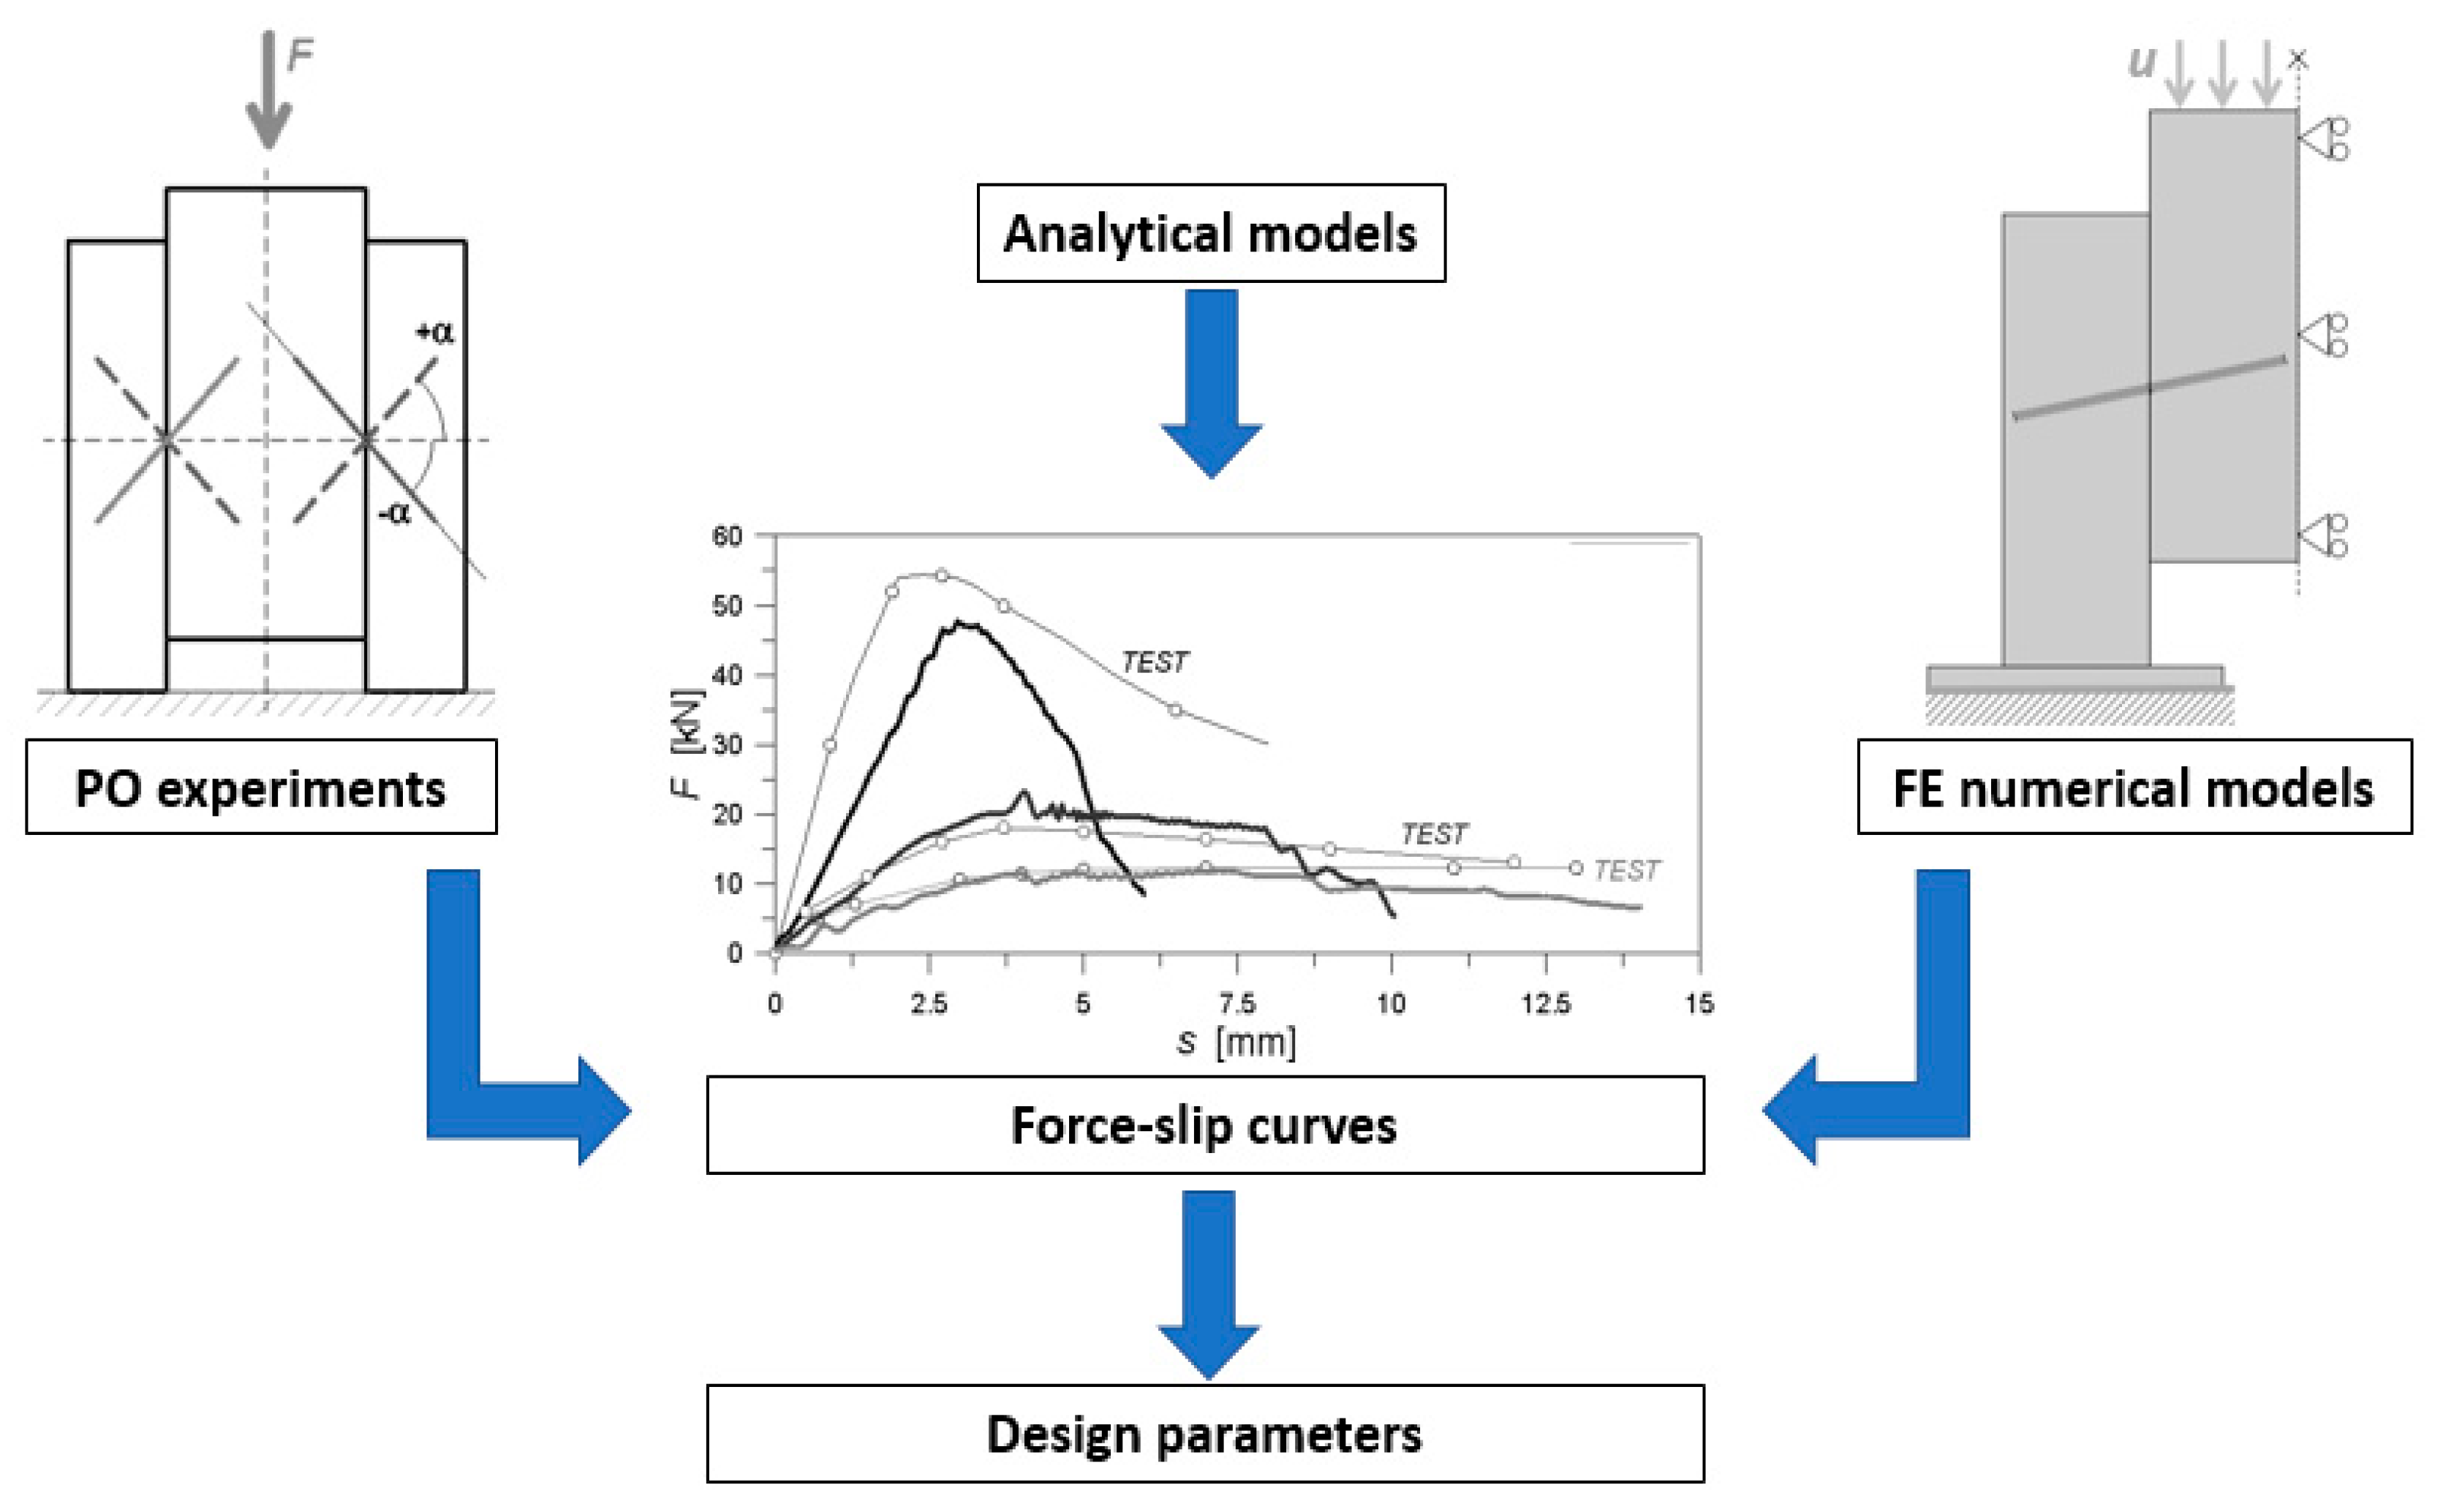
Timber-to-timber composite joints are widely used in novel or existing buildings, with variable detailing (i.e., type of fasteners, detailing, spacing, arrangement, etc.). Among others, self-tapping screws (STSs) are particularly efficient due to their continuous thread, and their high withdrawal capacity allows one to realize connections with increased stiffness and load-carrying capacity. The benefit of STSs, compared to traditional TTC joints, can be clearly perceived, particularly when the screws are used with an inclined configuration with respect to the timber grain. On the other side, the arrangement of screws, requires the designer to account for several aspects that could directly affect the load transfer mechanism of a given TTC joint, including the bending capacity of screws, the embedment strength of wood, the withdrawal capacity of fasteners, the amount of friction phenomena between the involved components. Appropriate assessment methods and tools are thus required for their accurate mechanical characterization (Figure 1).
In the last years, analytical formulations have been proposed for the prediction of the expected stiffness and load-carrying capacity of TTC screwed connections [1,2,3,4,5,6,7]. However, it is generally recognized that both the joint features and the loading conditions can strongly affect the overall mechanical performance. This is in contrast with most of the design applications, that are commonly developed on simplified estimates of serviceability (or ultimate) stiffness and ultimate resistance values, and generally use a constant stiffness value for joints with variable spacing. In this regard, the more refined analytical methods of literature (i.e., [6,7]) are still partially capable to capture the actual performance of inclined STSs configurations. In the years, several research studies have been thus focused on more refined but cost/time consuming experimental investigations for the assessment of TTC joints, aiming at overcoming the actual gaps of design knowledge [8,9,10,11,12], and including also several timber-concrete composite (TCC) solutions [13,14], or novel hybrid techniques for TTC beams with inclined STSs [15,16,17].
This paper presents an extended Finite Element (FE) numerical study (ABAQUS/Explicit [18,19]) that takes into account a wide set of configurations for TTC joints with inclined STSs, under a standard push-out (PO) setup. The numerical investigation takes inspiration from past experimental results reported in [6] by Tomasi et al., where various joint prototypes of technical interest have been explored, as well as from [20,21], where an enhanced cohesive zone modelling (CZM) approach has been proposed and validated in support of an enhanced mechanical characterization of the fasteners. The reference modelling strategy is described in Section 3.
The numerically predicted resistance and stiffness parameters are thus briefly compared in Section 4, based on the available experimental and analytical data from [5,6]. As a reference, standard test procedures for timber joints are taken into account from [22,23]. Accordingly, the correlation of collected data is assessed with the derivation of empirical fitting curves. Successively, the load-bearing performance and sensitivity of TTC-PO specimens to some key input parameters is explored (Section 5). The attention is focused on the effects of the base restraint, as well as friction phenomena and timber contact interfaces, and further on some basic CZM damage parameters for failure detection (Section 6). In doing so, major advantage is taken from the numerical derivation of the resultant forces that are sustained separately by the STSs or transferred by the timber components.
2. Background
2.1. Reference Experimental Approach
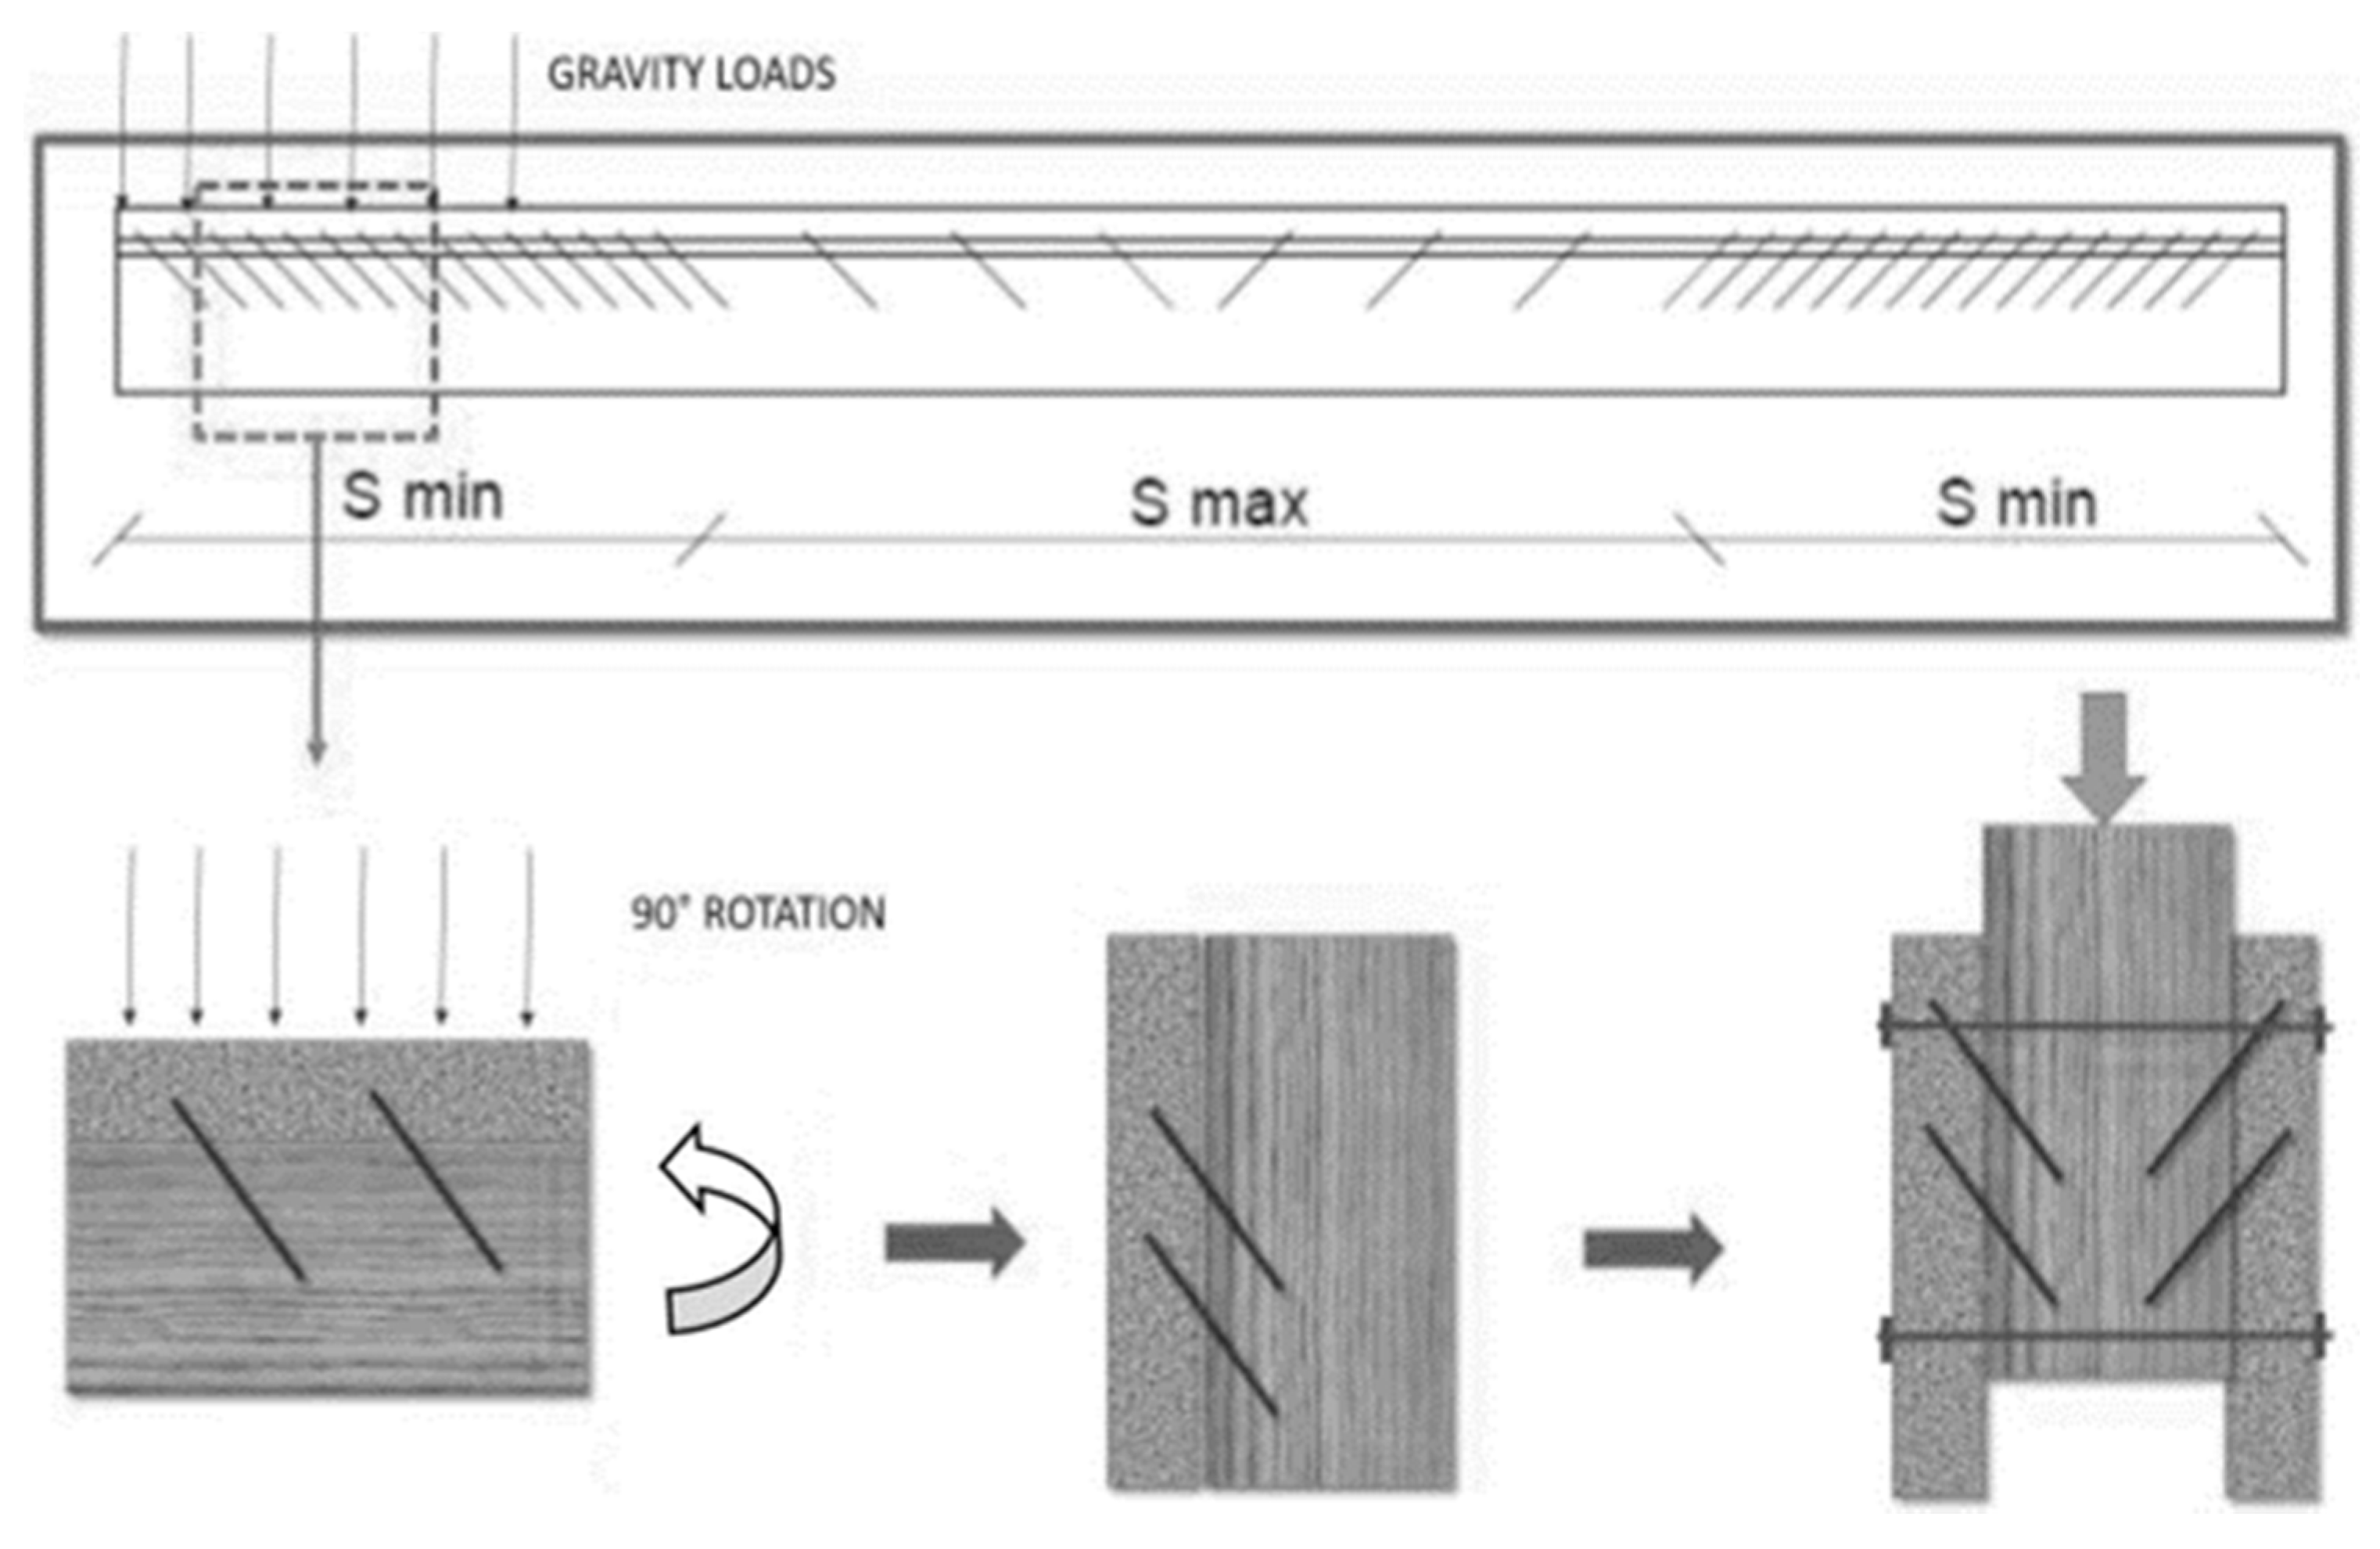
The short-term mechanical performance characterization of connections and joints of typical use for TTC (or TCC) systems according to Figure 2 generally depends on several uncertainties. Most of the parameters that are of primary need for analytical calculations and design are in fact sensitive to several geometrical features and loading conditions, thus affecting the corresponding serviceability stiffness and ultimate resistance values.
Moreover, most of the simplified methods of literature that can be used for TTC joints still lack consideration of several relevant aspects that especially in the case of timber, may have severe effects on the overall structural performance assessment (i.e., crushing or plasticity, time-dependent phenomena in the joint components, occurrence and evolution of local damage mechanisms, etc.). The actual result is thus represented by the need of extensive experimental testing in support of the required stiffness and resistance calculations [22,23]. The loading procedure recommended by the Eurocode 5 for timber structures [5], in this regard, requires for a standard PO test the repetition of 25 load cycles between 5% and 40% of the expected failure load. The specimen is then pushed further to collapse. Moreover, several test repetitions should be carried out for each joint configuration. Finally, a multitude of instruments is recommended to capture and control the specimen performance.
2.2. Selected Push-Out Specimens and Configurations
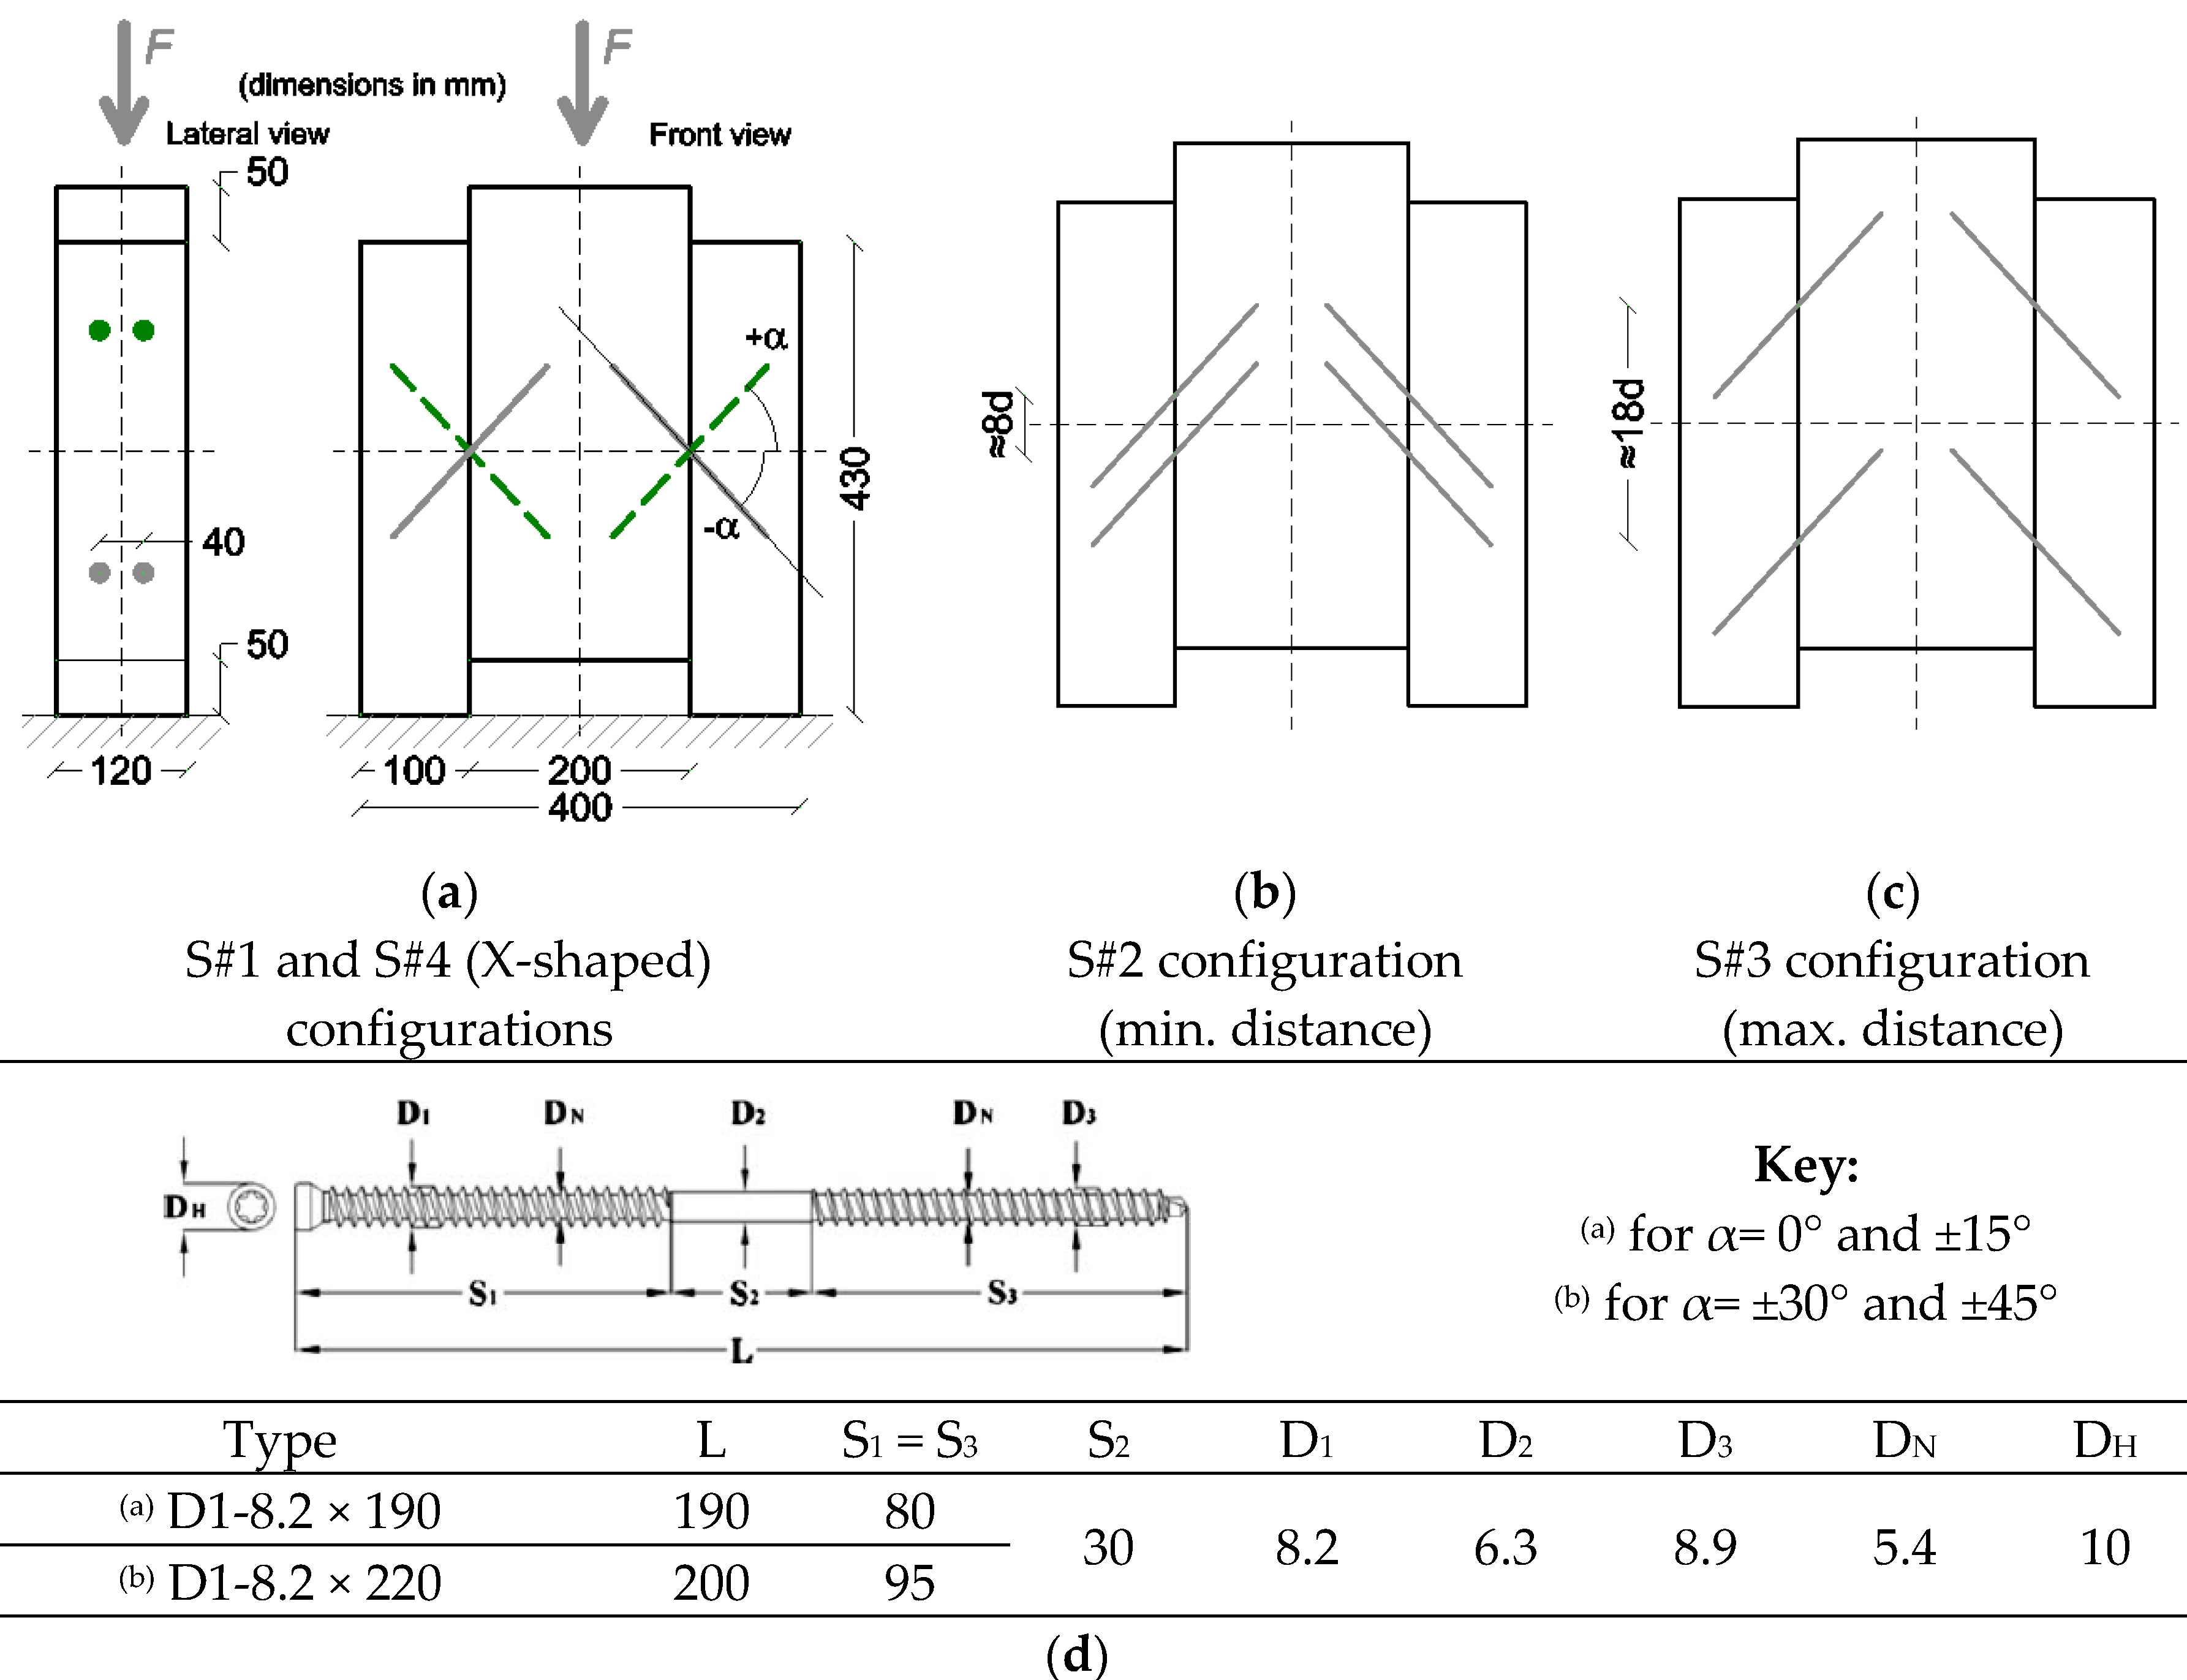
The numerical study discussed herein takes into account a series of TTC joints with inclined STSs characterized by geometrical variations in the inclination, the number and the position of fasteners, the loading direction (i.e., shear-compression (α < 0) and shear-tension (0 < α ≤ 45°)). In accordance with Figure 3a–c, the typical TTC joint consists of three glued laminated timber elements classified as GL24h strength class (EN 1194 [24,25]). The mechanical connection of these spruce members is ensured by double-thread, carbon steel STSs (WT-T-8.2 type [26,27]), with a total length of L=190 mm or 220 mm (Figure 3d). Four joint typologies are thus numerically investigated in this paper (S#1-to-S#4 in Figure 3, with α = var), where [6]:
- S#1 = is a 2 + 2 screwed joint (−45° ≤ α ≤ 45°)
- S#2 = represents a 4 + 4 screwed joint (−45° ≤ α ≤ 45°), with a1 = 70 mm ≈ 8d and d = D3
- S#3 = is a 4 + 4 screwed joint like S#3 (−45° ≤ α ≤ 45°), but a1 = 160 mm ≈ 18d
- S#4 = denotes a 2 + 2, X-shaped screwed joint (0° ≤ α ≤ 45°)
3. Reference Numerical Modelling Approach
A key aspect of the full three dimensional (3D) solid models discussed in this paper is represented by the use of mechanical properties derived from [20,21]. Among others, a “soft layer” with CZM damage interactions is introduced at the interface between the steel STSs and the surrounding timber members. It was shown in [20,21] that the CZM damage modelling technique is particularly suitable for TTC joints with inclined STSs, where the region of fasteners can be sensitive to localized damage phenomena, with consequent relevant effects on the collected load-bearing responses. Compared to other modelling approaches, the CZM technique has well-known intrinsic advantages, since it does not need to pre-define potential cracks, or to introduce complex and computationally expensive adaptive mesh techniques, nor to define a very dense mesh pattern where cracks are expected.
3.1. Solving Strategy and Model Assembly
The numerical simulations are carried out with the ABAQUS/Explicit computer software [18,19], in the form of displacement-controlled, dynamic analyses with quasi-static deformations. All the FE assemblies are subjected to a linearly increasing vertical displacement, on the top face of the central member. The imposed vertical displacement is set in 20 mm, for all the examined configurations. Force-slip characteristic curves, as well as stress distributions and damage mechanisms in the TTC joint components are then monitored throughout the numerical investigation, a set of fixed FE assumptions is repeated for all the TTC joints under a standard PO setup, with major variations represented by trivial geometrical details.
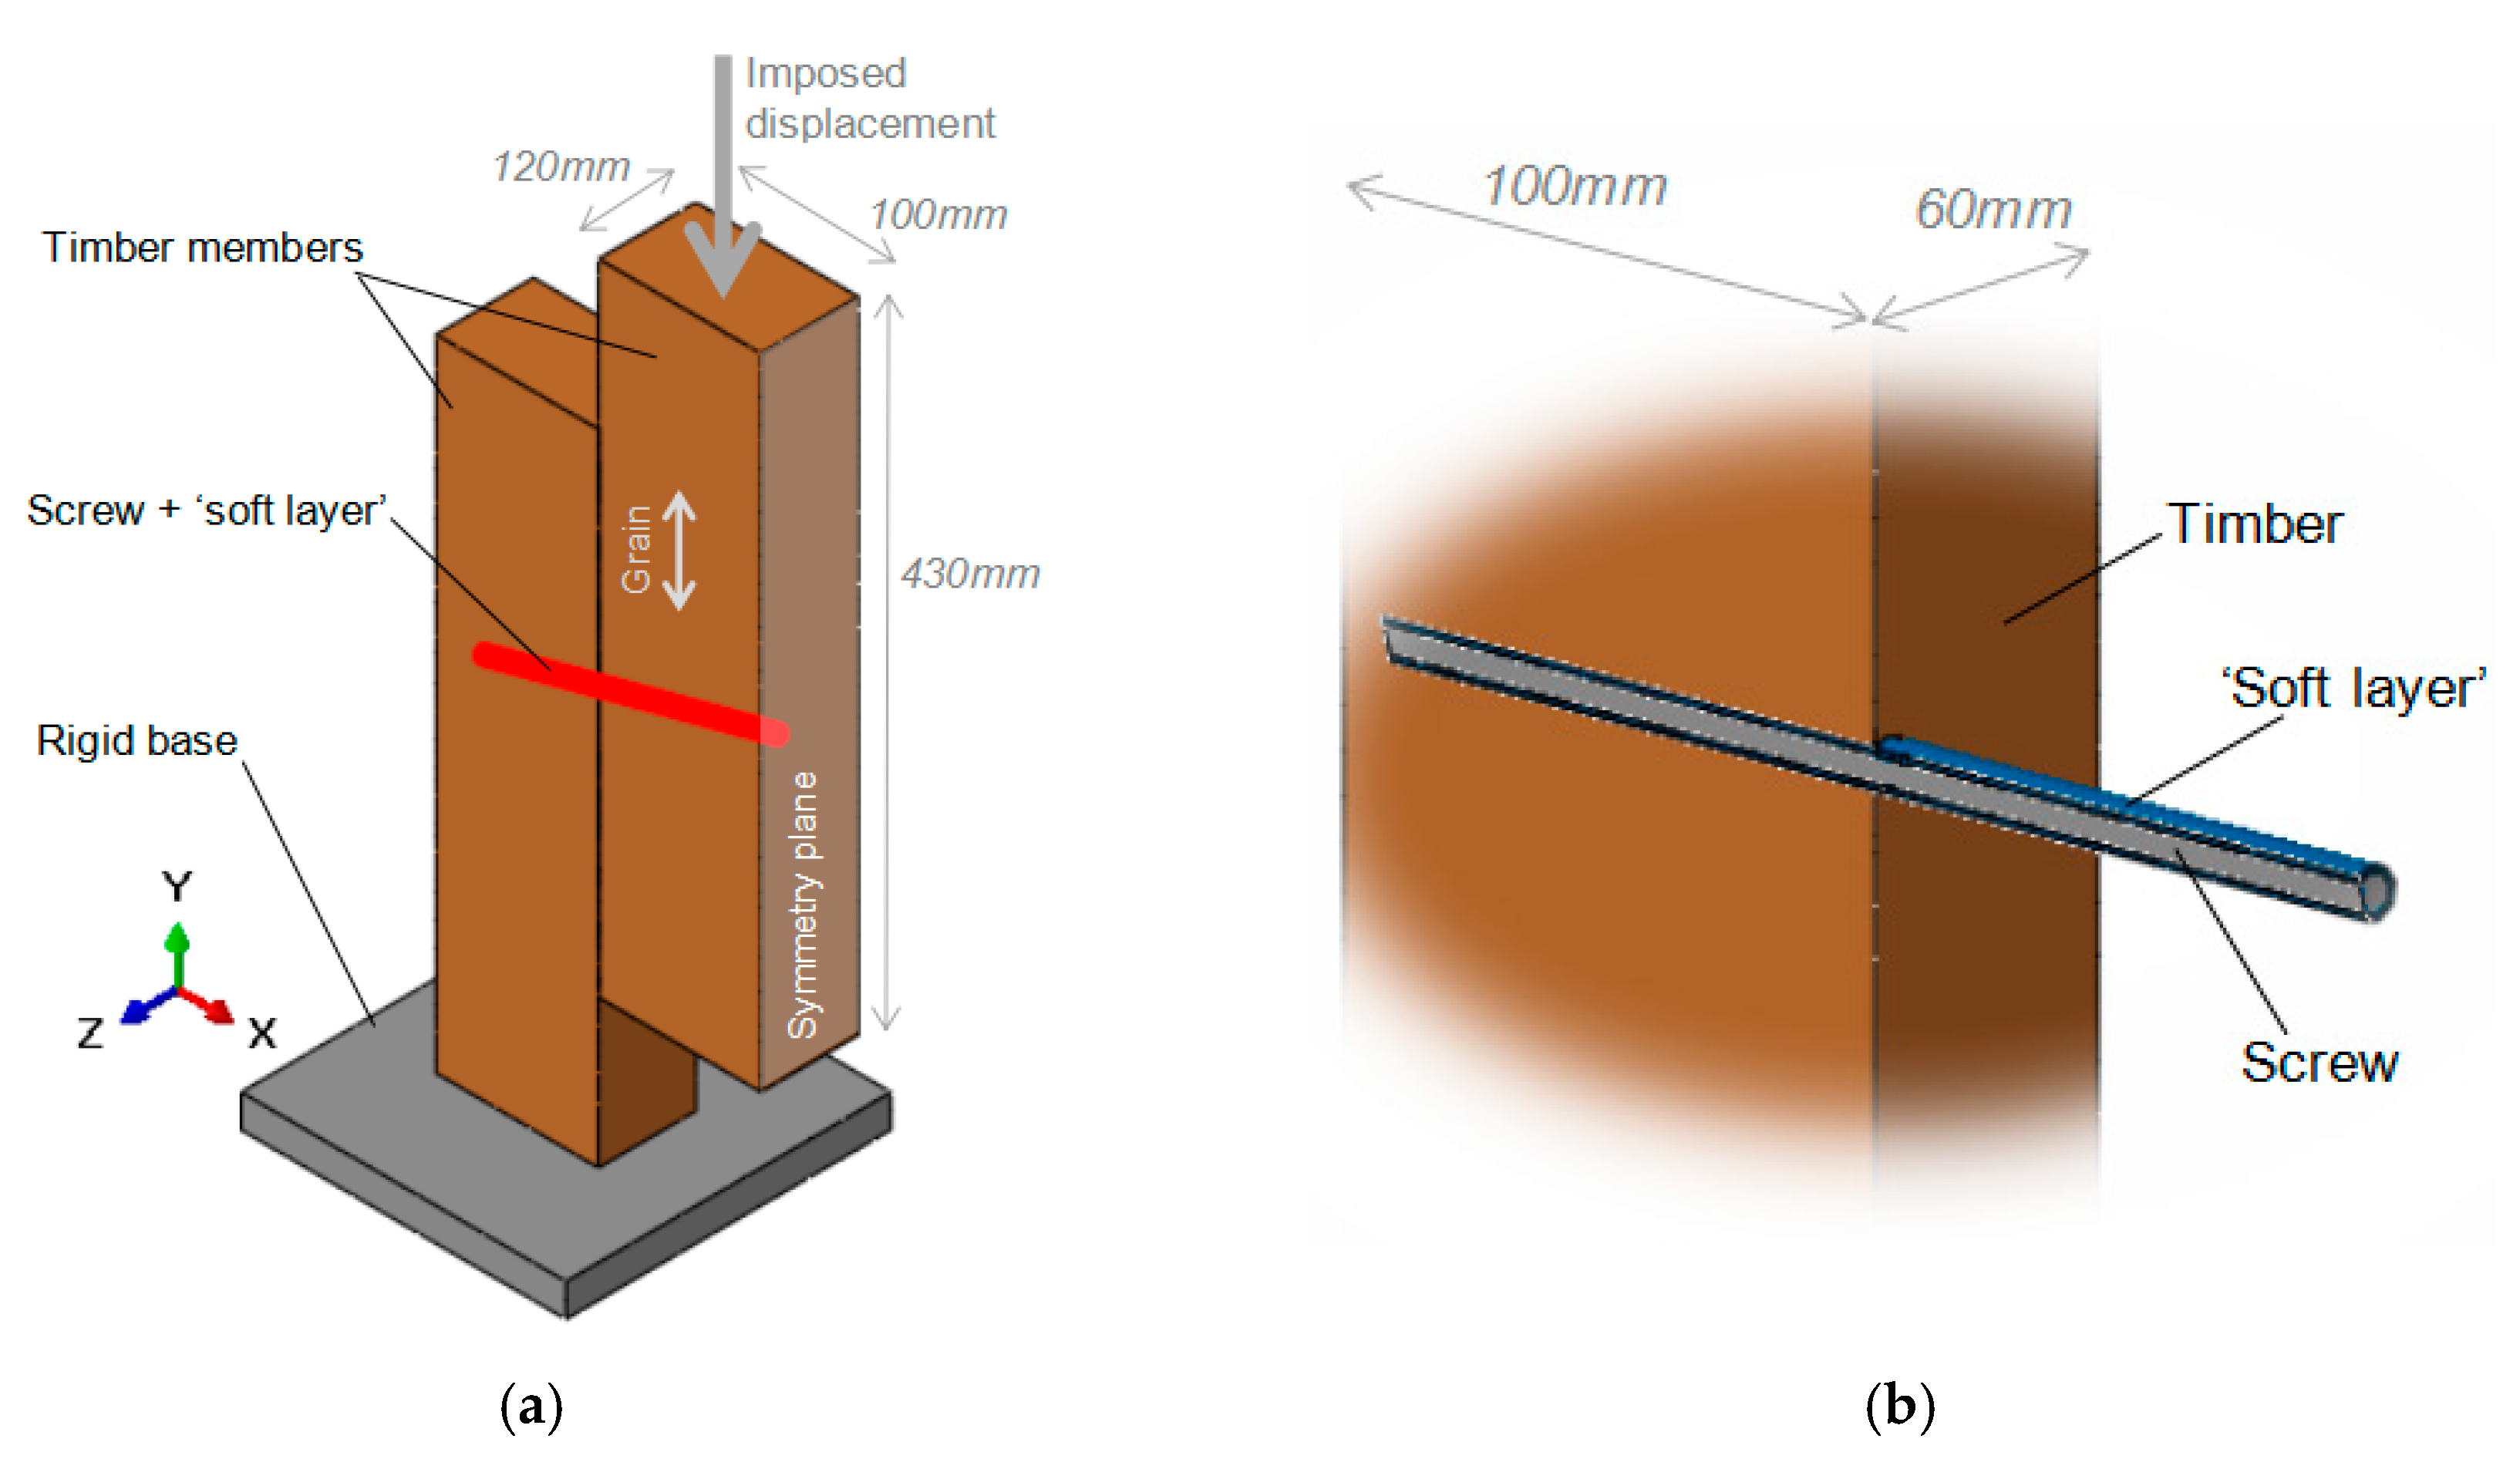
The major simplification regards some basic symmetry considerations, thus 1/4th or 1/2nd the nominal geometry of each TTC specimen is taken into account. 8-node three-dimensional (3D) solid elements, (C3D8R-type) stress-strain bricks with reduced integration from the ABAQUS library are used for all the joint components. The reference FE model of TTC joint includes also a rigid base support made of steel, to allocate the lateral timber member in a standard PO setup. A swept (advancing font) meshing technique is then used to optimize the computational cost of simulations. The average edge size is minimized in the region of the STSs (0.3 mm-to-0.5 mm), and then maximized for the steel rigid base and the lateral portions of timber elements (5 mm-to-8 mm). Figure 4 shows an example of S#1 joint (α = −15°). Based on [20,21], major efforts are then spent for the description of STSs and their mechanical interaction with the surrounding timber elements (Figure 5).
To this aim, each screw consists of an equivalent, circular cross-section with uniform diameter (D2 = 6.3 mm from Figure 3d) and total length L.
A “soft layer” representative of STSs threads and timber fibers is then interposed between each screw and the surrounding timber (D1 = 8.1 mm from Figure 3d).
3.2. Material Properties
The mechanical response of both timber and steel components is described with the support of constitutive laws and material models available in the ABAQUS library. An isotropic, elastic-plastic Von Mises constitutive law is used for carbon steel screws (10.9 the nominal resistance class), with E = 210 GPa and ν = 0.3 as nominal modulus of elasticity (MoE) and Poisson’ ratio. Based on [6], the yielding/ultimate stress values are set in fy = fu = 940.3 MPa. An ultimate strain δu = 0.5% is considered. At the same time, an orthotropic constitutive law is used for spruce [21]. To ensure more realistic behaviours for the timber members, this constitutive law is integrated with a Hill plastic criterion and a brittle failure parameter. The Hill criterion allows to account for different resistance values in the principal directions of timber, and thus for different potential critical mechanisms for the examined PO setup. The additional brittle failure law, moreover, is used to include possible crushing phenomena in the timber close to the fasteners. Once attained the ultimate resistance fc,90, a linear propagation of compressive damage is taken into account for timber. Due to lack of more detailed experimental feedback, this material degradation is set to maximize at a failure deformation of δu = 4mm. This value is adapted from [20], where C24 timber members have been investigated, based on the similarity in the resistance parameters for GL24h spruce. The final input parameters for timber are listed in Table 1, based on the nominal mechanical properties for GL24h strength class [24,25].
3.3. Mechanical Interactions and CZM Properties
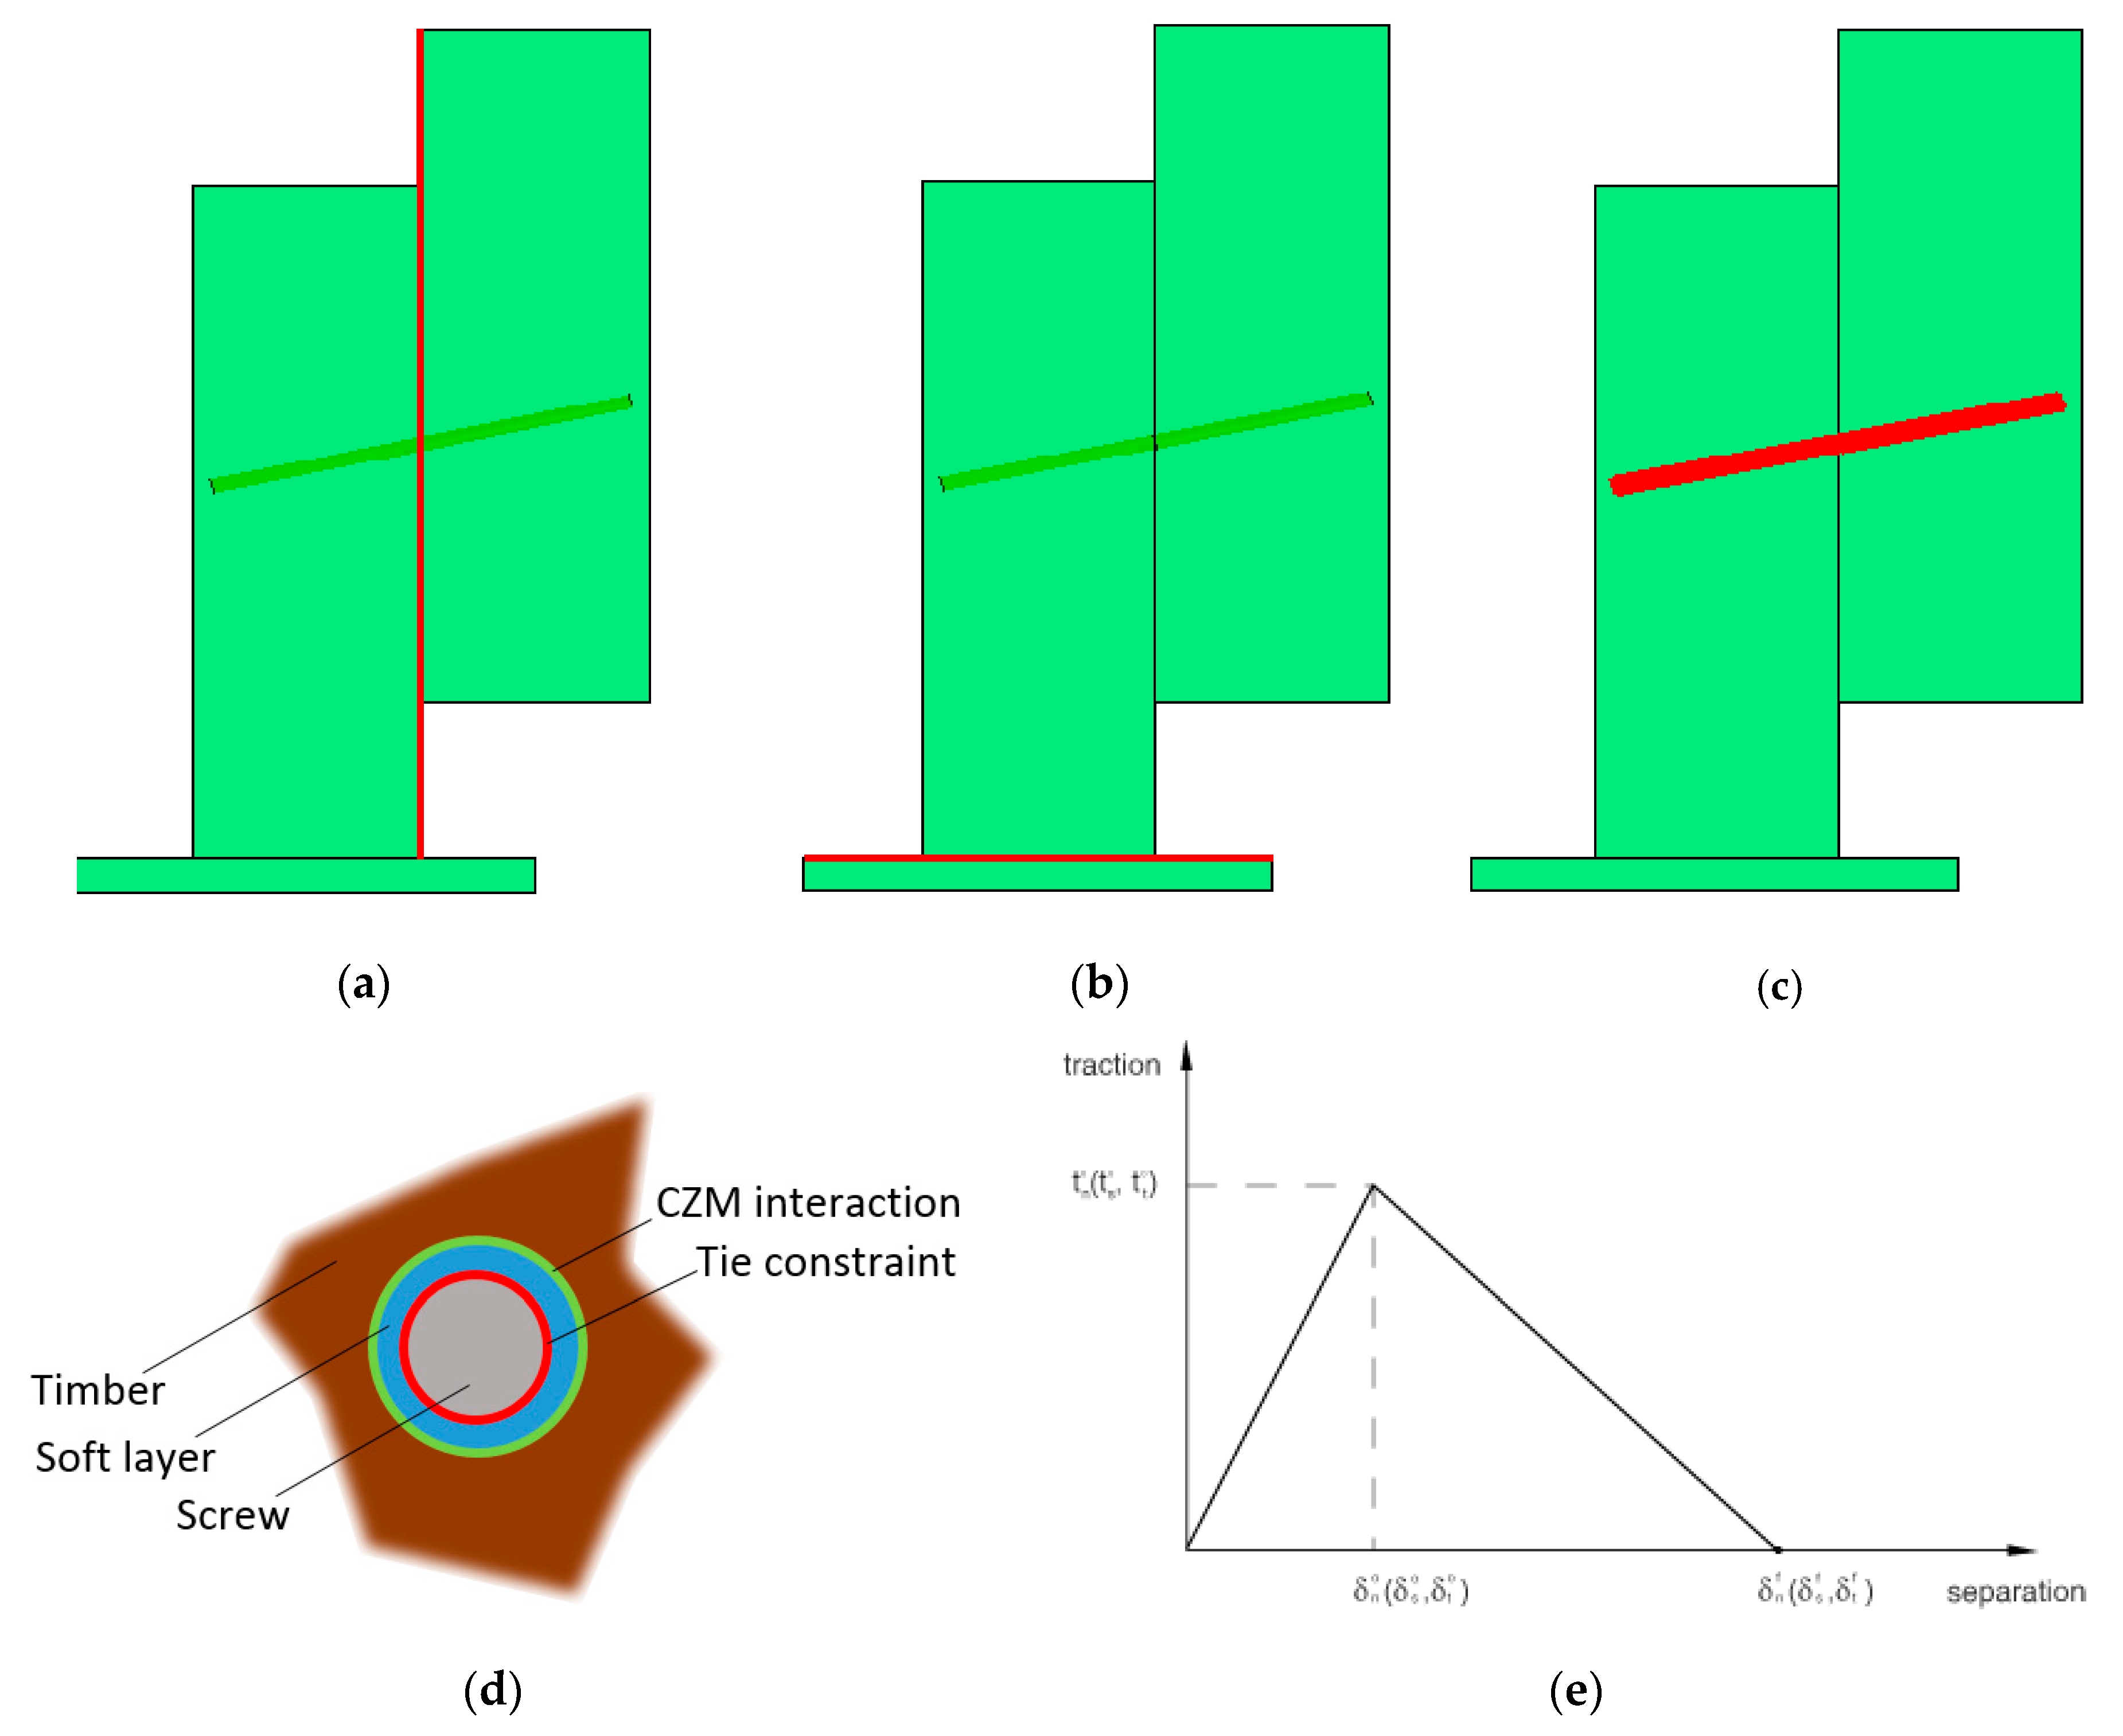
The reliable mechanical performance of TTC numerical models is offered by an accurate calibration of material properties, but especially by the combination of multiple mechanical interactions between the involved load-bearing components (Figure 6).
For the typical FE model in Figure 6a, tangential “penalty” and normal “hard” surface-to-surface behaviors are first defined for the timber surfaces (μtimber = 0.5 [28] the static friction coefficient). A second surface-to-surface contact interaction, see Figure 6b, is introduced between the bottom face of timber (lateral member) and the base steel support (μbase = 0.2 [28]). Finally, see Figure 6c,d, a double restraint is used in the region of the steel fasteners. Each screw is first rigidly connected with the surrounding soft layer via a distributed “tie” constraint, so that relative rotations and displacements among the interested surfaces could be avoided. The external surface of the soft layer and the timber elements are then interconnected by a surface-based CZM behaviour, that is conventionally defined in its basic features (linear elastic traction-separation model (Figure 6e), damage initiation criterion, damage evolution law). In this study, the “default contact enforcement method” of ABAQUS library is used for the definition of the interface stiffness parameters prior to damage onset. The “Damage initiation”, in this regard, is set to coincide with timber failure, based on Table 1 and Table 2. This limit condition is implemented in the form of a maximum nominal stress (MAXS) criterion:
with , and representing the allowable nominal stress peaks corresponding to normal deformations (n) to the bonding interface or in the first (s) or second (t) shear directions (GL24h resistance values). For the examined PO setup, any kind of rate-dependent behaviour for the traction-separation elasticity law is disregarded in this study. The damage evolution is finally set as “linear”, that is:
where D is a scalar damage variable (0 ≤ D ≤ 1) that interrelates the contact stress value t (in any direction), compared to its value predicted by the elastic traction-separation behaviour for the separation without damage. A null residual CZM contact stiffness is thus achieved at the first attainment of an ultimate displacement equal to δu = 4 mm (Table 2).
3.4. Analysis of Force Contributions
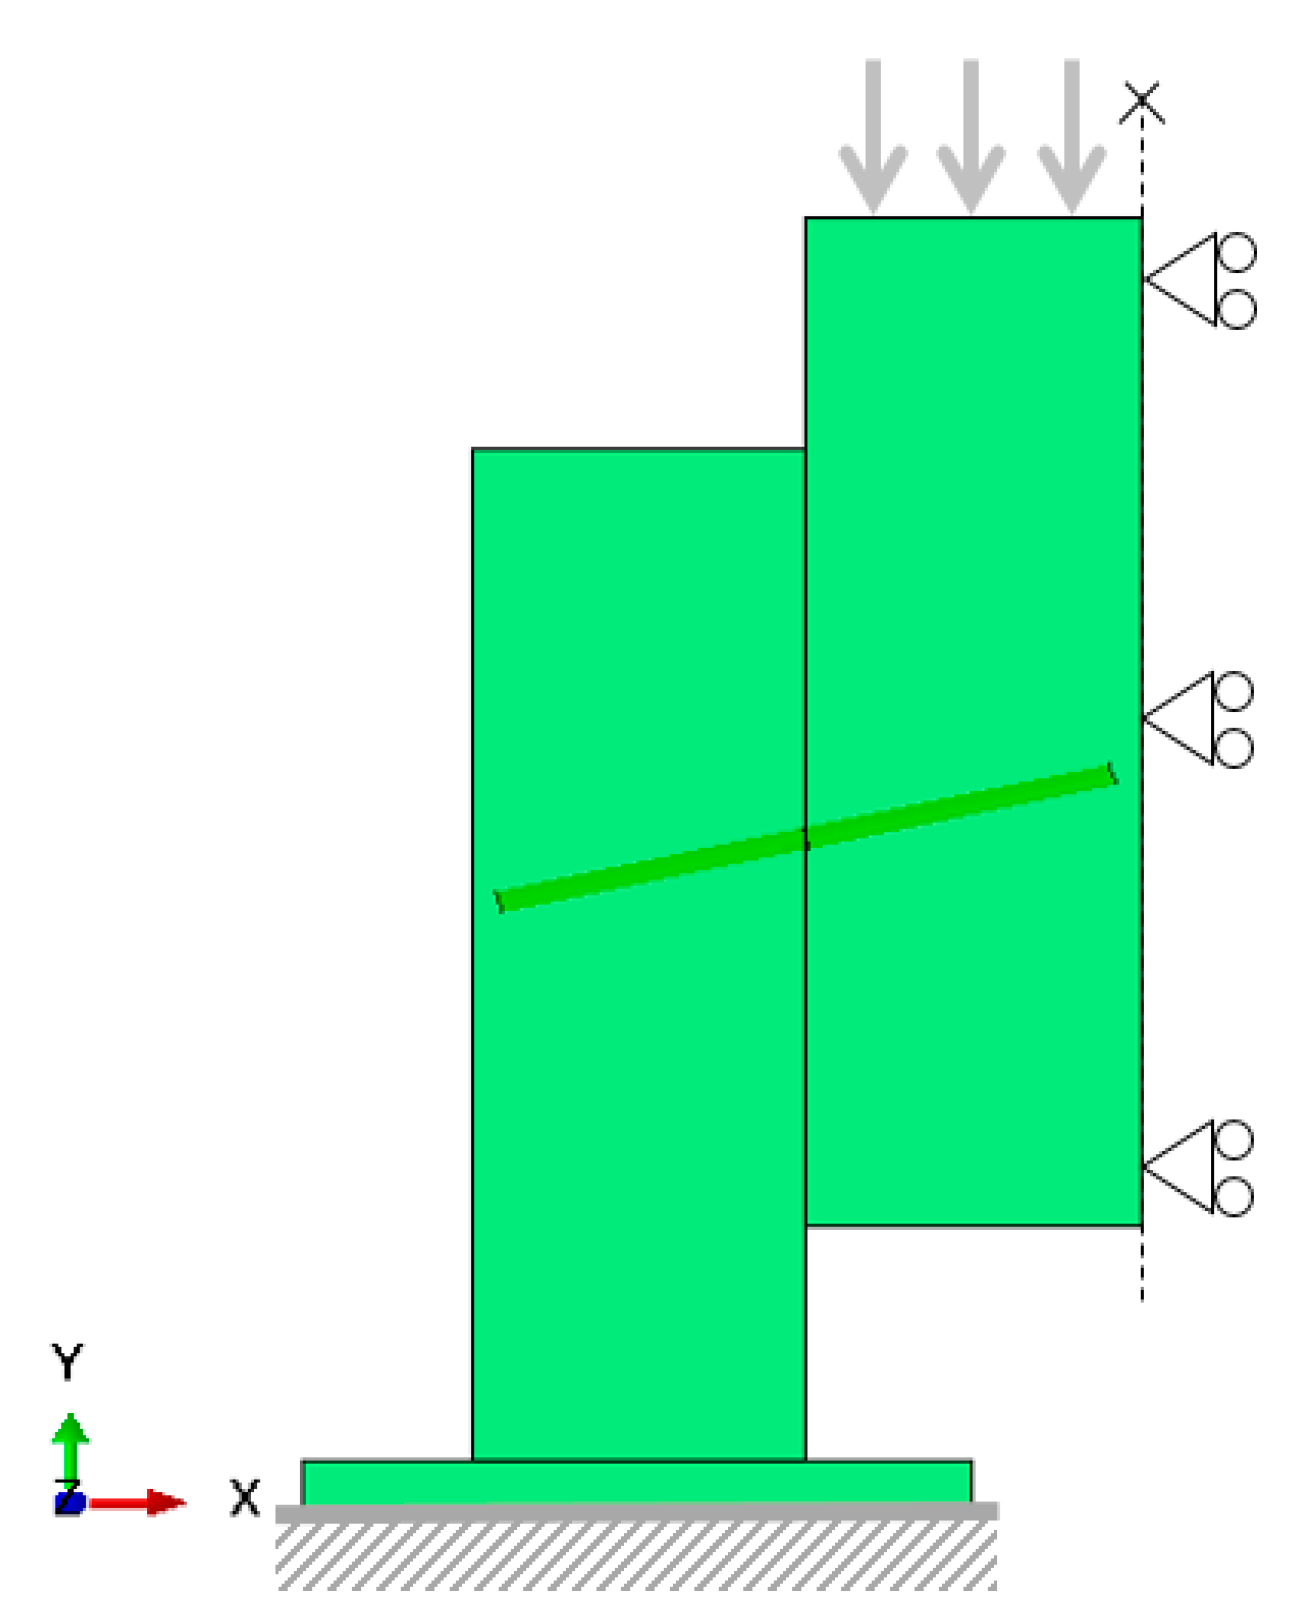
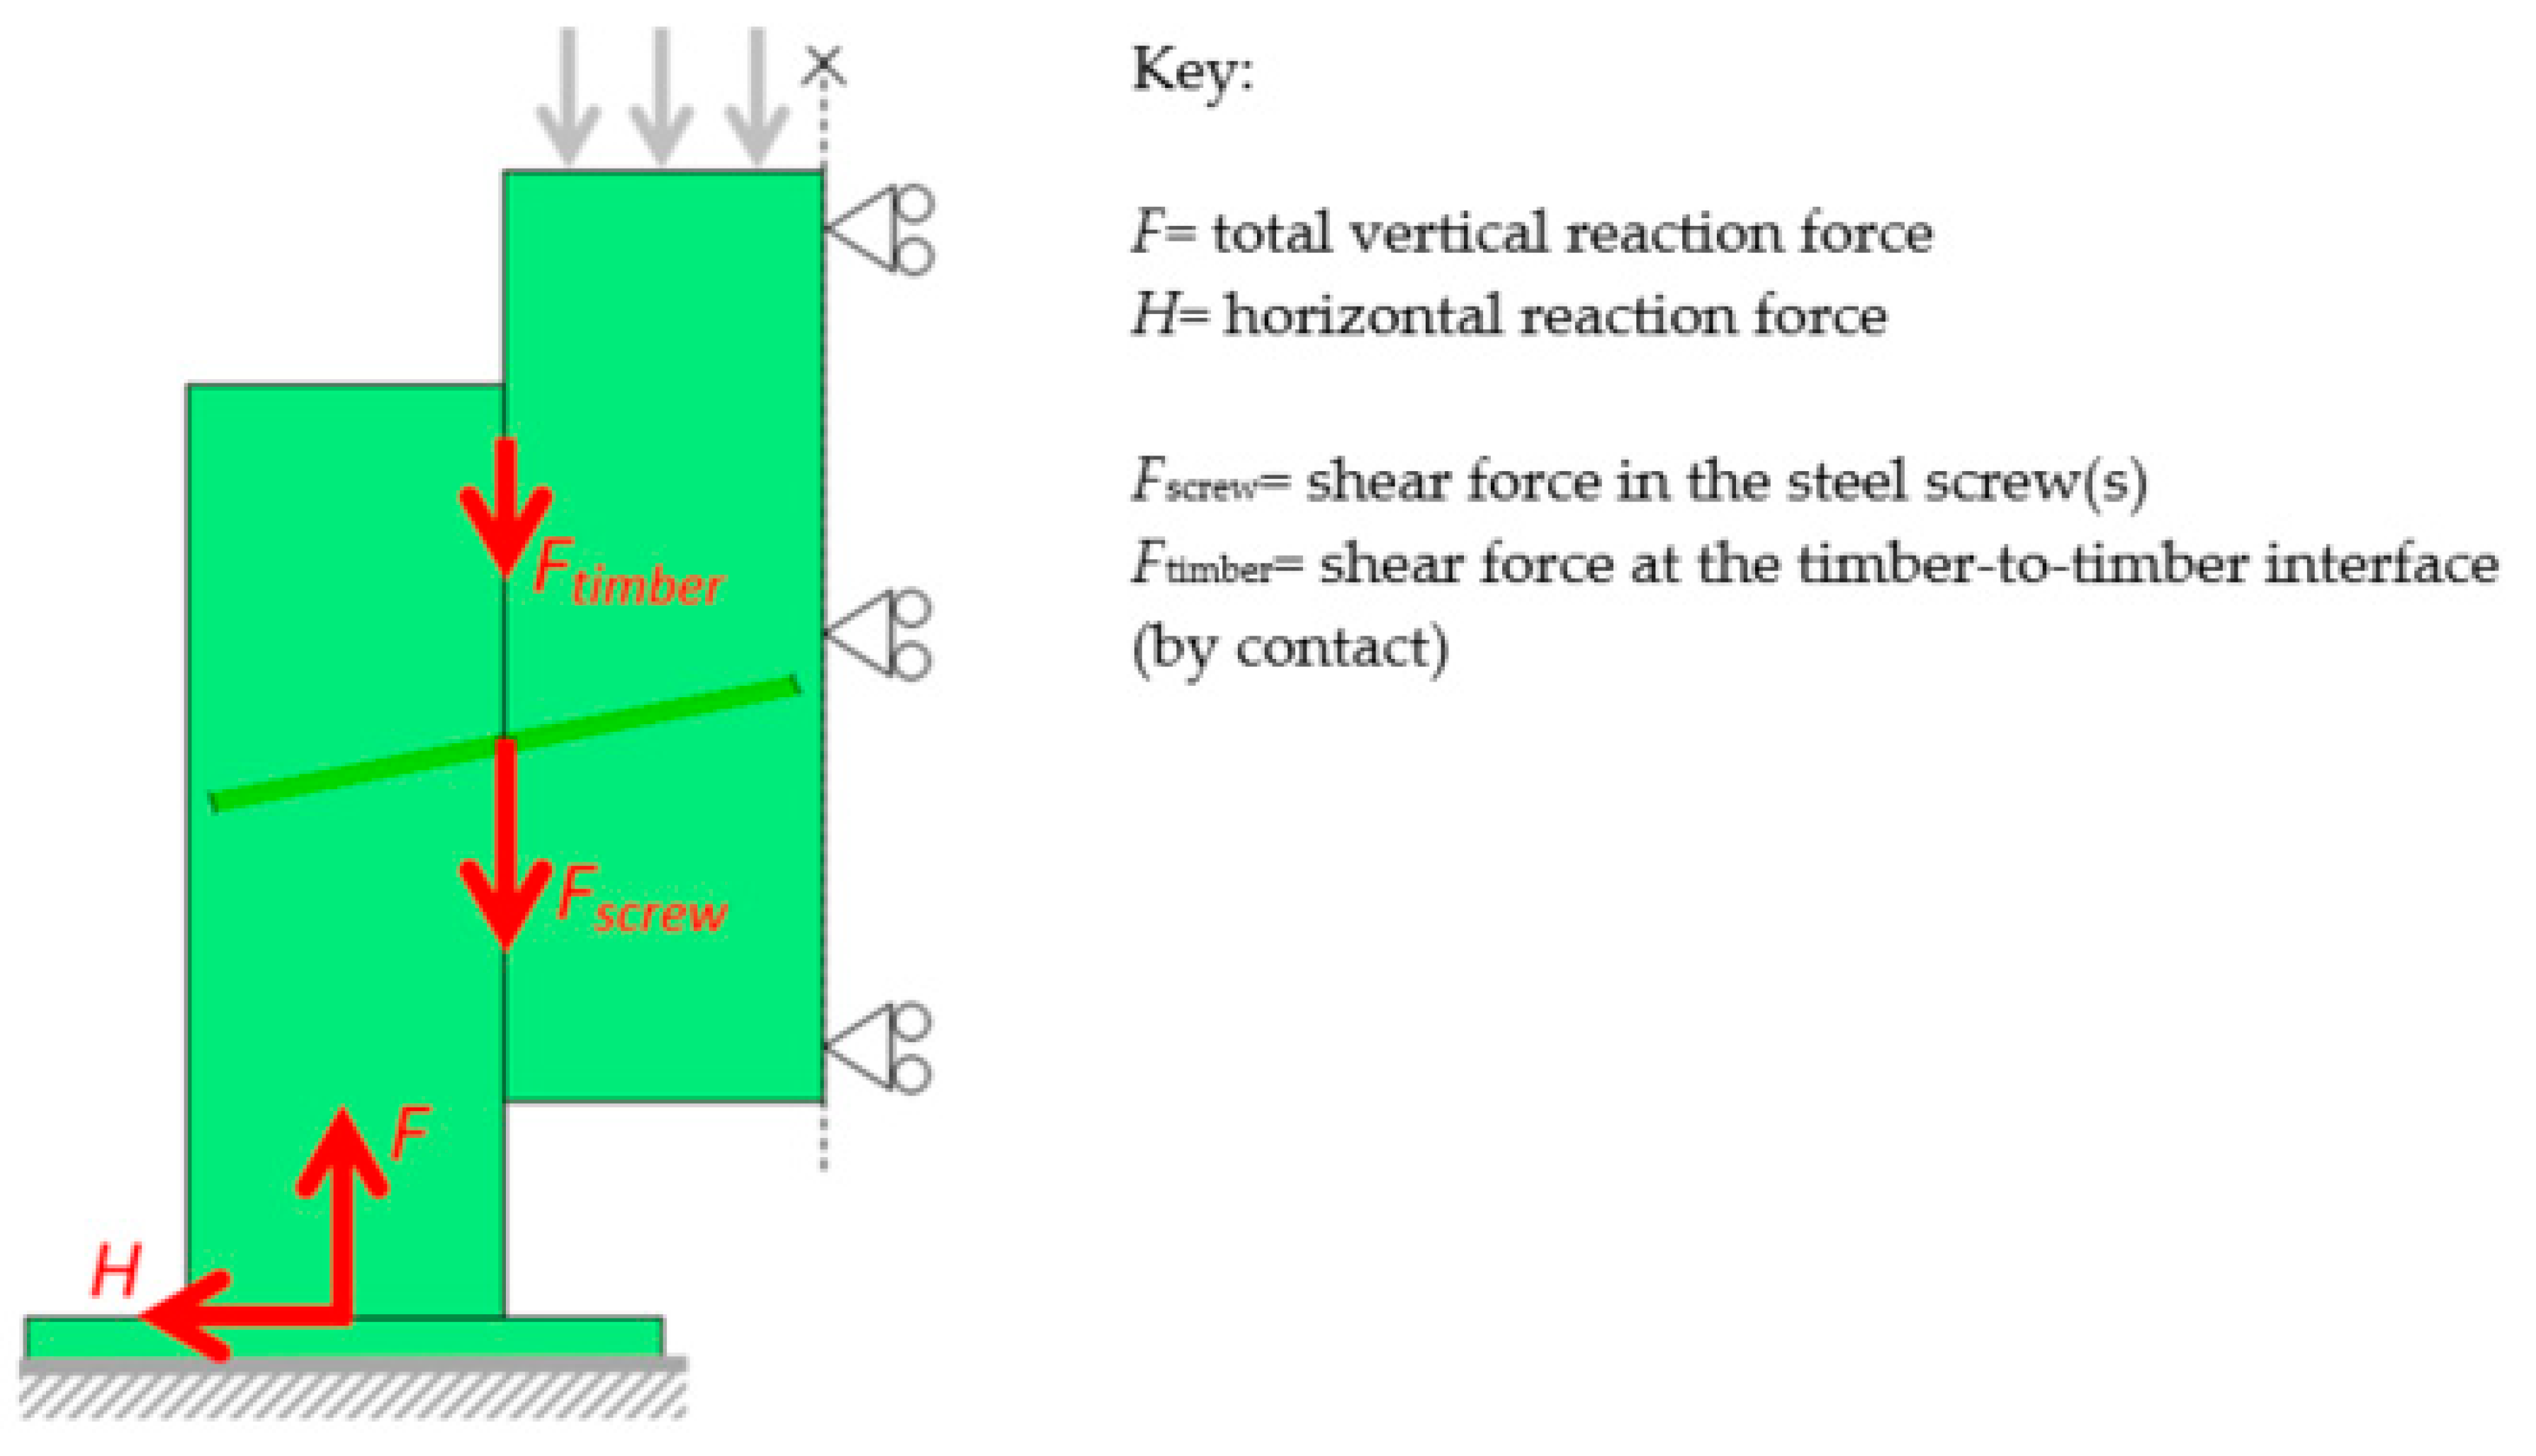
The derivation of relevant FE results is carried out on the basis of the collected numerical force-slip curves, for each one of the examined TTC configurations. More in detail, the attention of the post-processing stage is first focused on the shear force contributions that are sustained by the timber members and in the STSs. According to Figure 7, for an imposed vertical displacement, the total vertical reaction force F and the horizontal reaction force H at the base of each TTC joint are separately monitored. In the case of the vertical reaction F, moreover, the shear force terms sustained by the steel screws or at the timber-to-timber interface (by contact) are separately calculated, given that the overall load-bearing capacity of the TCC joint in the PO setup can be expressed as:
4. Discussion of FE Results
4.1. Force-Slip Curves
Generally, the FE modelling strategy herein presented proved to offer relatively good correlation with the selected literature data, both in quantitative and qualitative terms. For few configurations (especially for the TCC joints characterized by high α values), a major scatter was observed and justified by local damage phenomena that compromised the overall load-bearing performance of the FE assembled components.
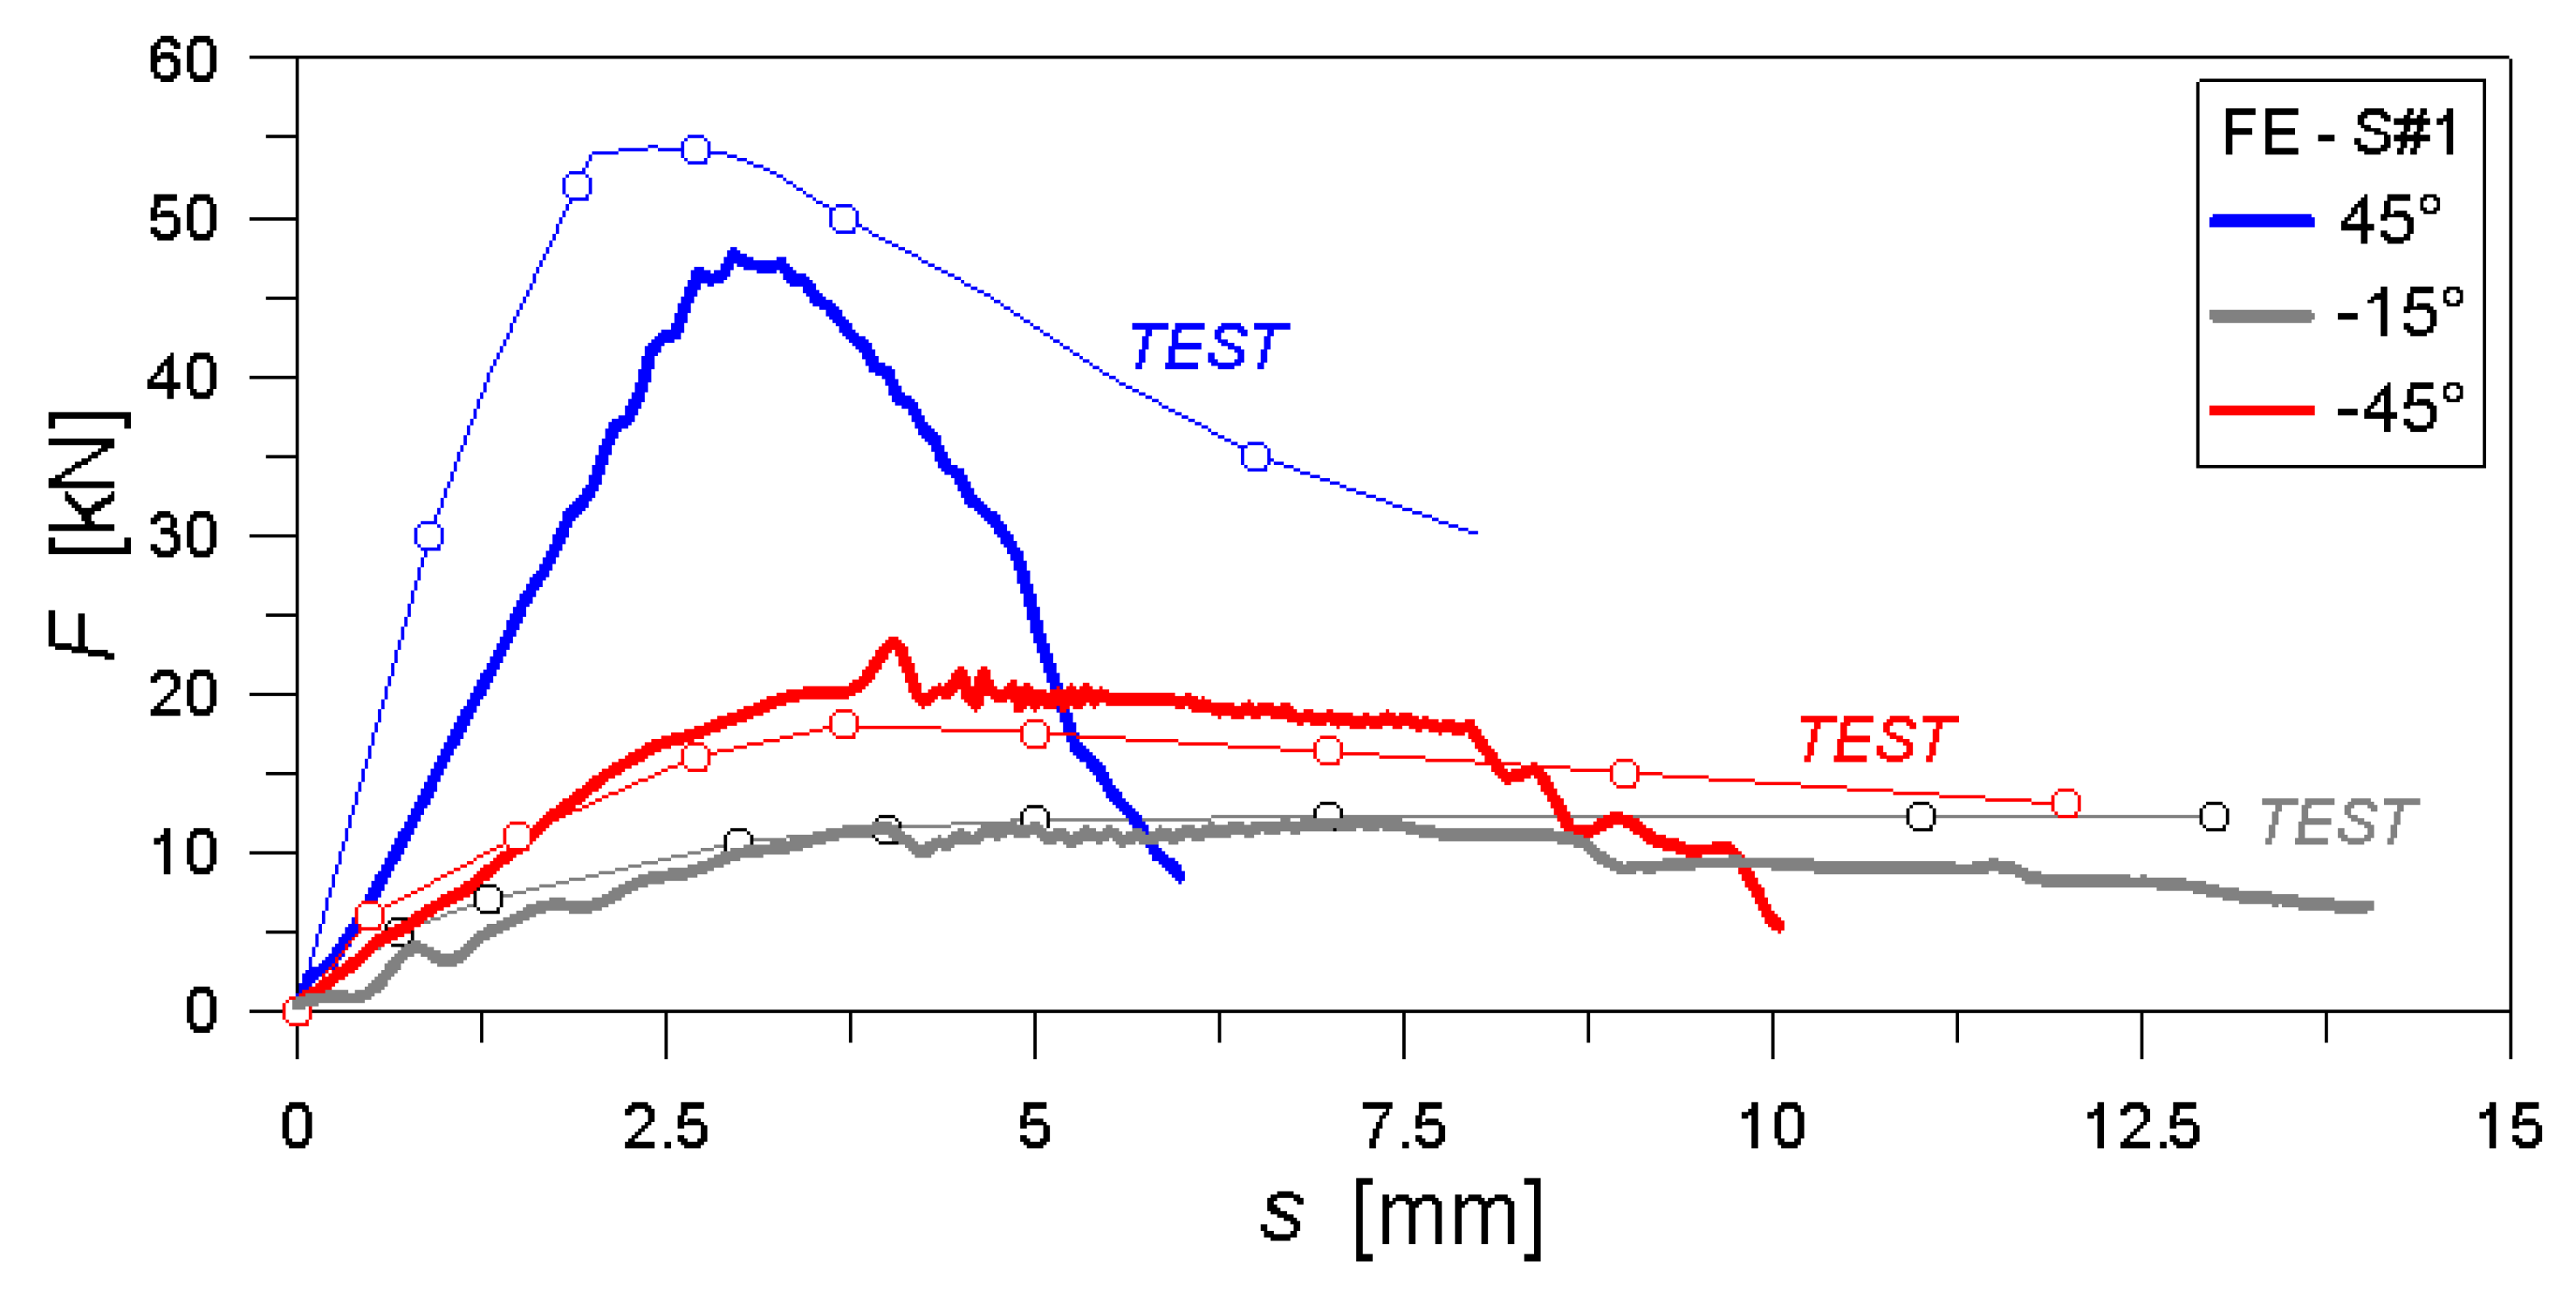
Selected examples are shown in Figure 8 for S#1 specimens and different STS inclinations, while the corresponding test results are derived from [6].
The typical PO analysis was thus stopped due to convergence issues, in the very late damaged stage. In most of the cases, see Figure 8, this ultimate collapse configuration was achieved for relatively small slip amplitudes (s < 10 mm), compared to the imposed displacement of 20 mm. For the FE predictions agreeing with Figure 8, the maximum resistance Fmax can be conventionally detected as the first condition between the attainment of the (a) actual maximum force or (b) a total force corresponding to a joint slip s = 15 mm (if any). The corresponding serviceability stiffness Kser is then given by [22,23]:
with s04 and s01 the measured sliding amplitudes at the 40% and 10% part of the maximum resistance Fmax.
4.2. Damage Mechanism
For the global and local analysis of parametric FE results, a key role is assigned to the detailing of stress peaks distributions and damage initiation/evolution in all the joint components. For the examined TTC configurations, the collapse detection of PO specimens was typically associated to a combination of:
- crushing phenomena in timber (in the region of screws);
- progressive yielding of screws and
- damage of the CZM contact (screw-to-timber interface).
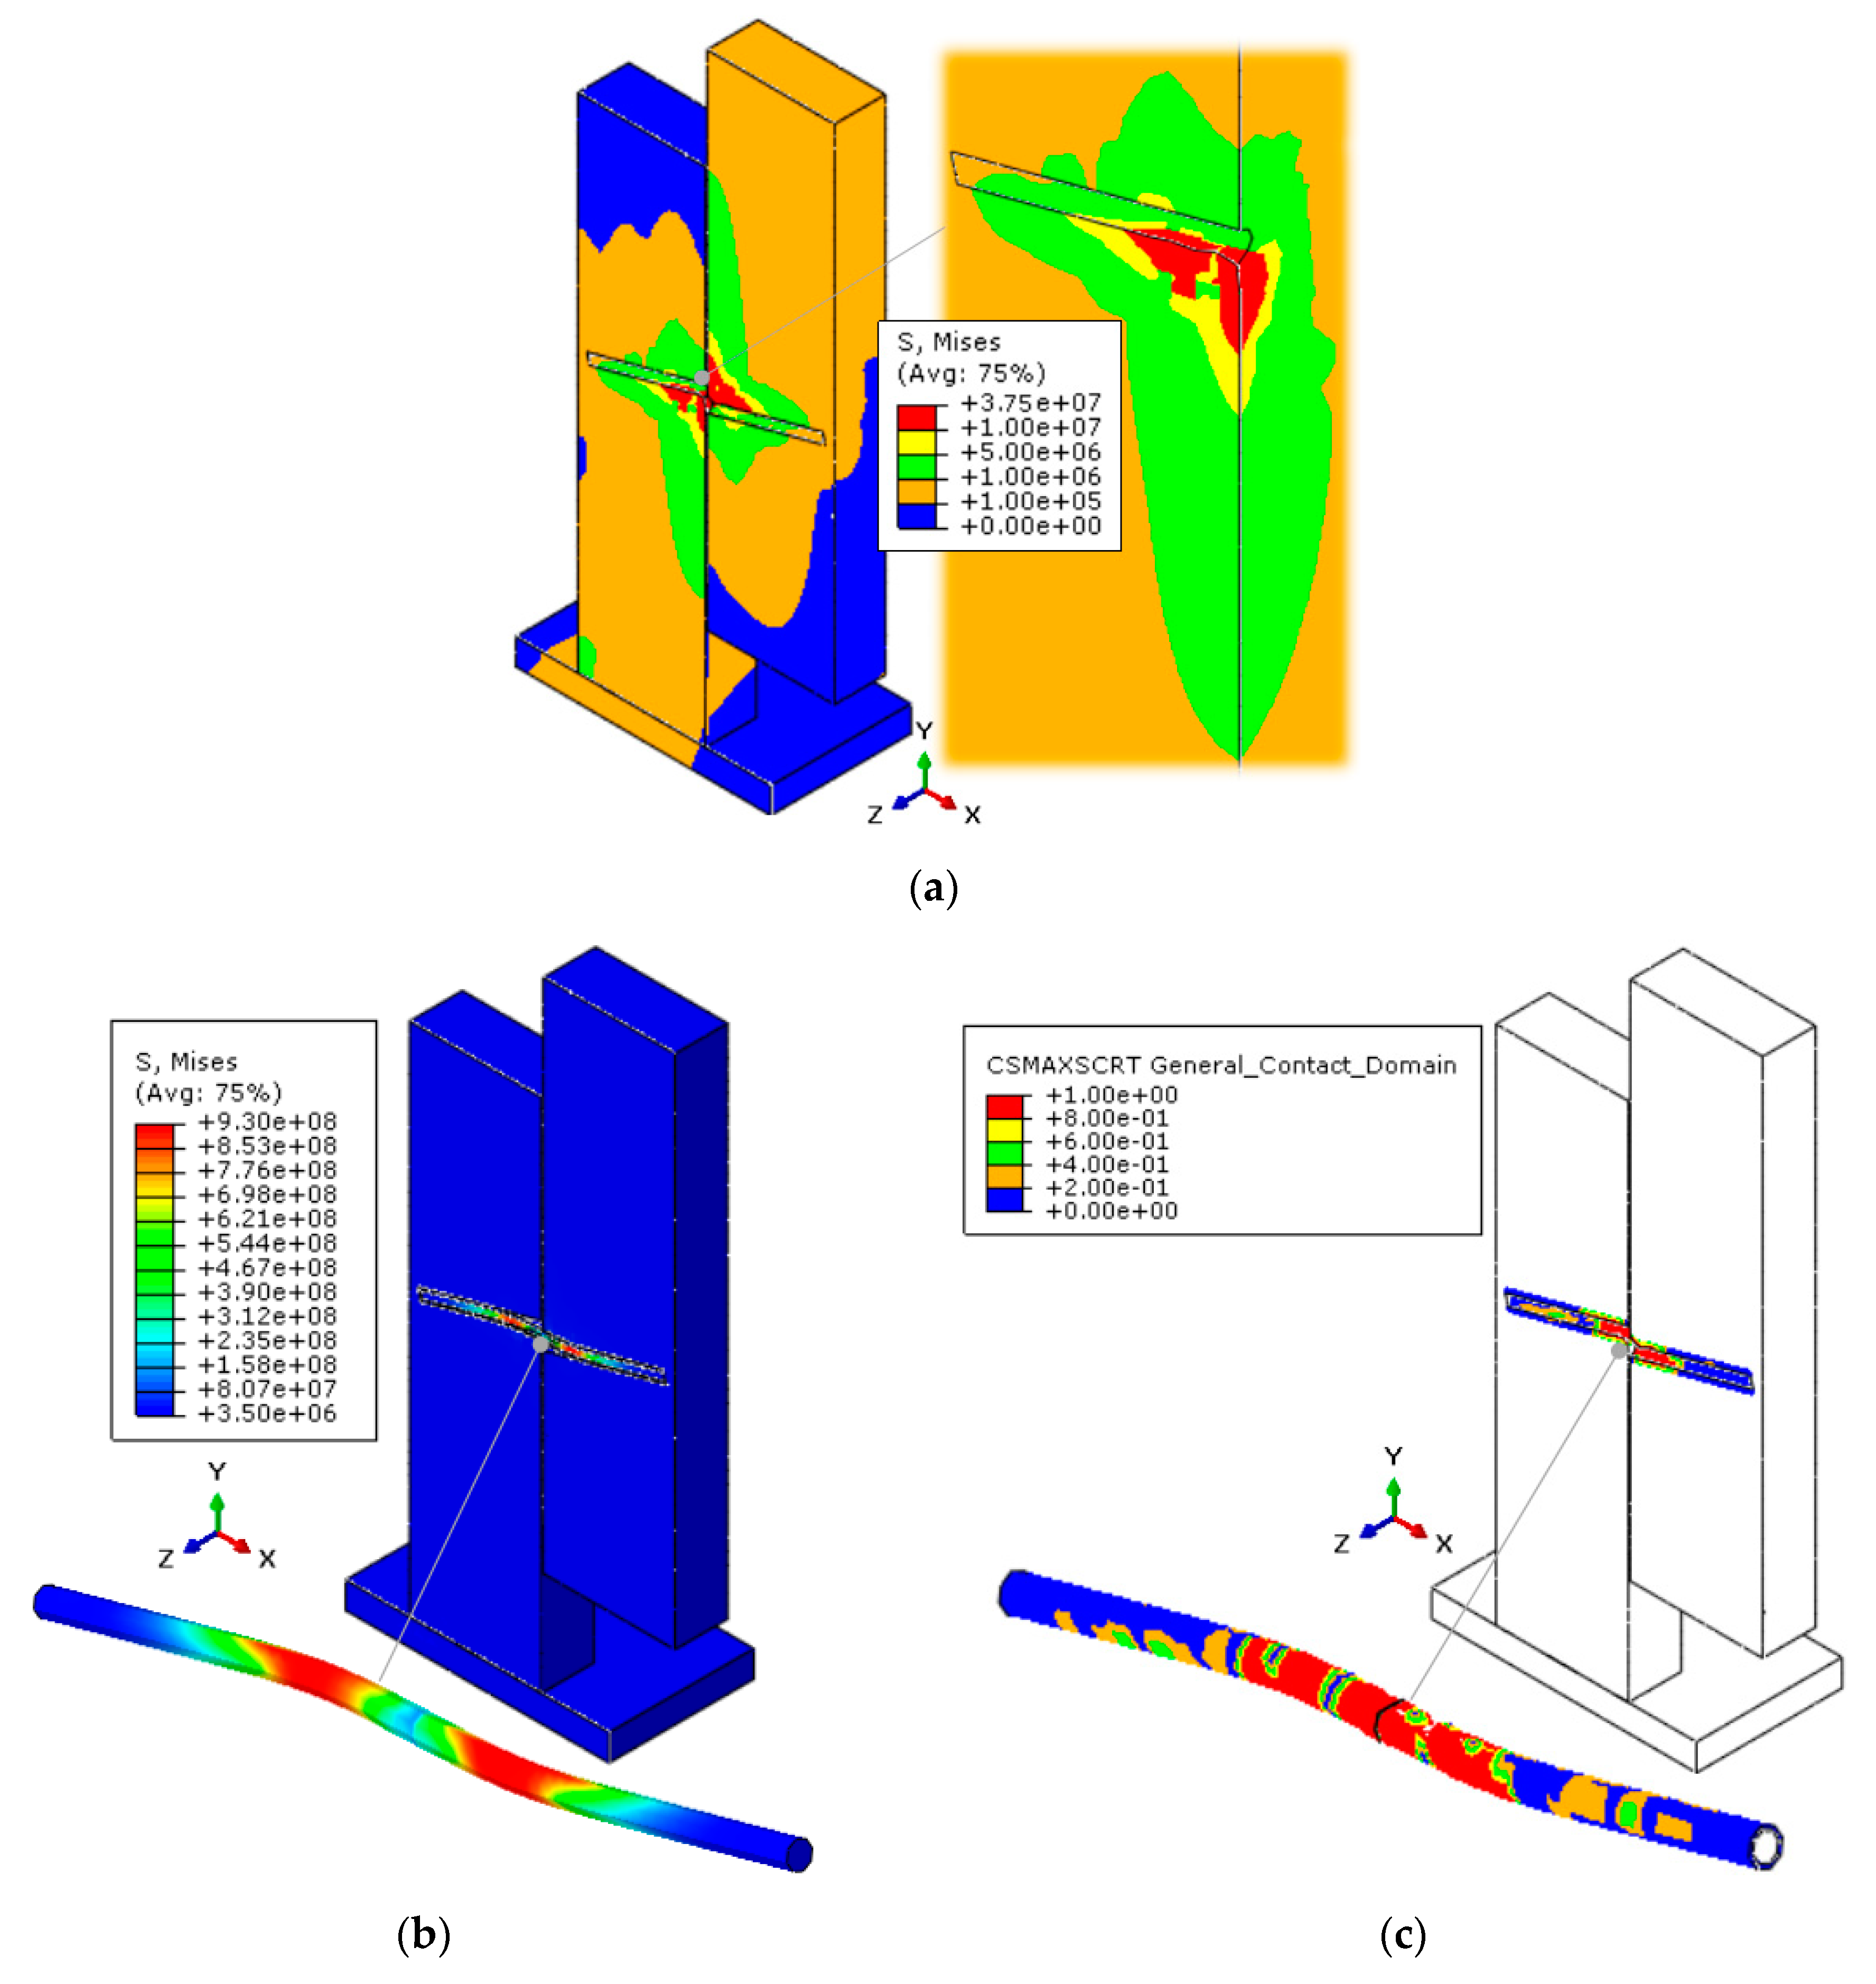
A relevant example is proposed in Figure 9 (S#1 specimen with α = −15°, at an imposed slip s = 12 mm). In the direction of the grain, the wooden fibers were generally subjected to high stresses peaks in a limited region only, when moving far away from the fasteners. This can be noticed in the crushed (red) regions of Figure 9a. The STSs in use, moreover, commonly failed due to the occurrence of two plastic hinges (Figure 9b), and this is in line with the experimental observations reported in [6]. For all the examined TTC joints, finally, a primary role was recognized for the CZM contact, being responsible of the final slope for the collected force-slip curves. In Figure 9c, in this regard, the non-dimensional CSMAXCRT parameter is shown (1 = fully damaged or 0 = undamaged interface). This parameter, for most of the examined joints, was observed to reach its maximum unitary value of failure with an extension up to ≈ 1/3rd the nominal length L for the STSs in use.
5. Mechanical Characterization of TTC Joints
5.1. Experimental Assessment of Maximum Force Predictions (Fmax)
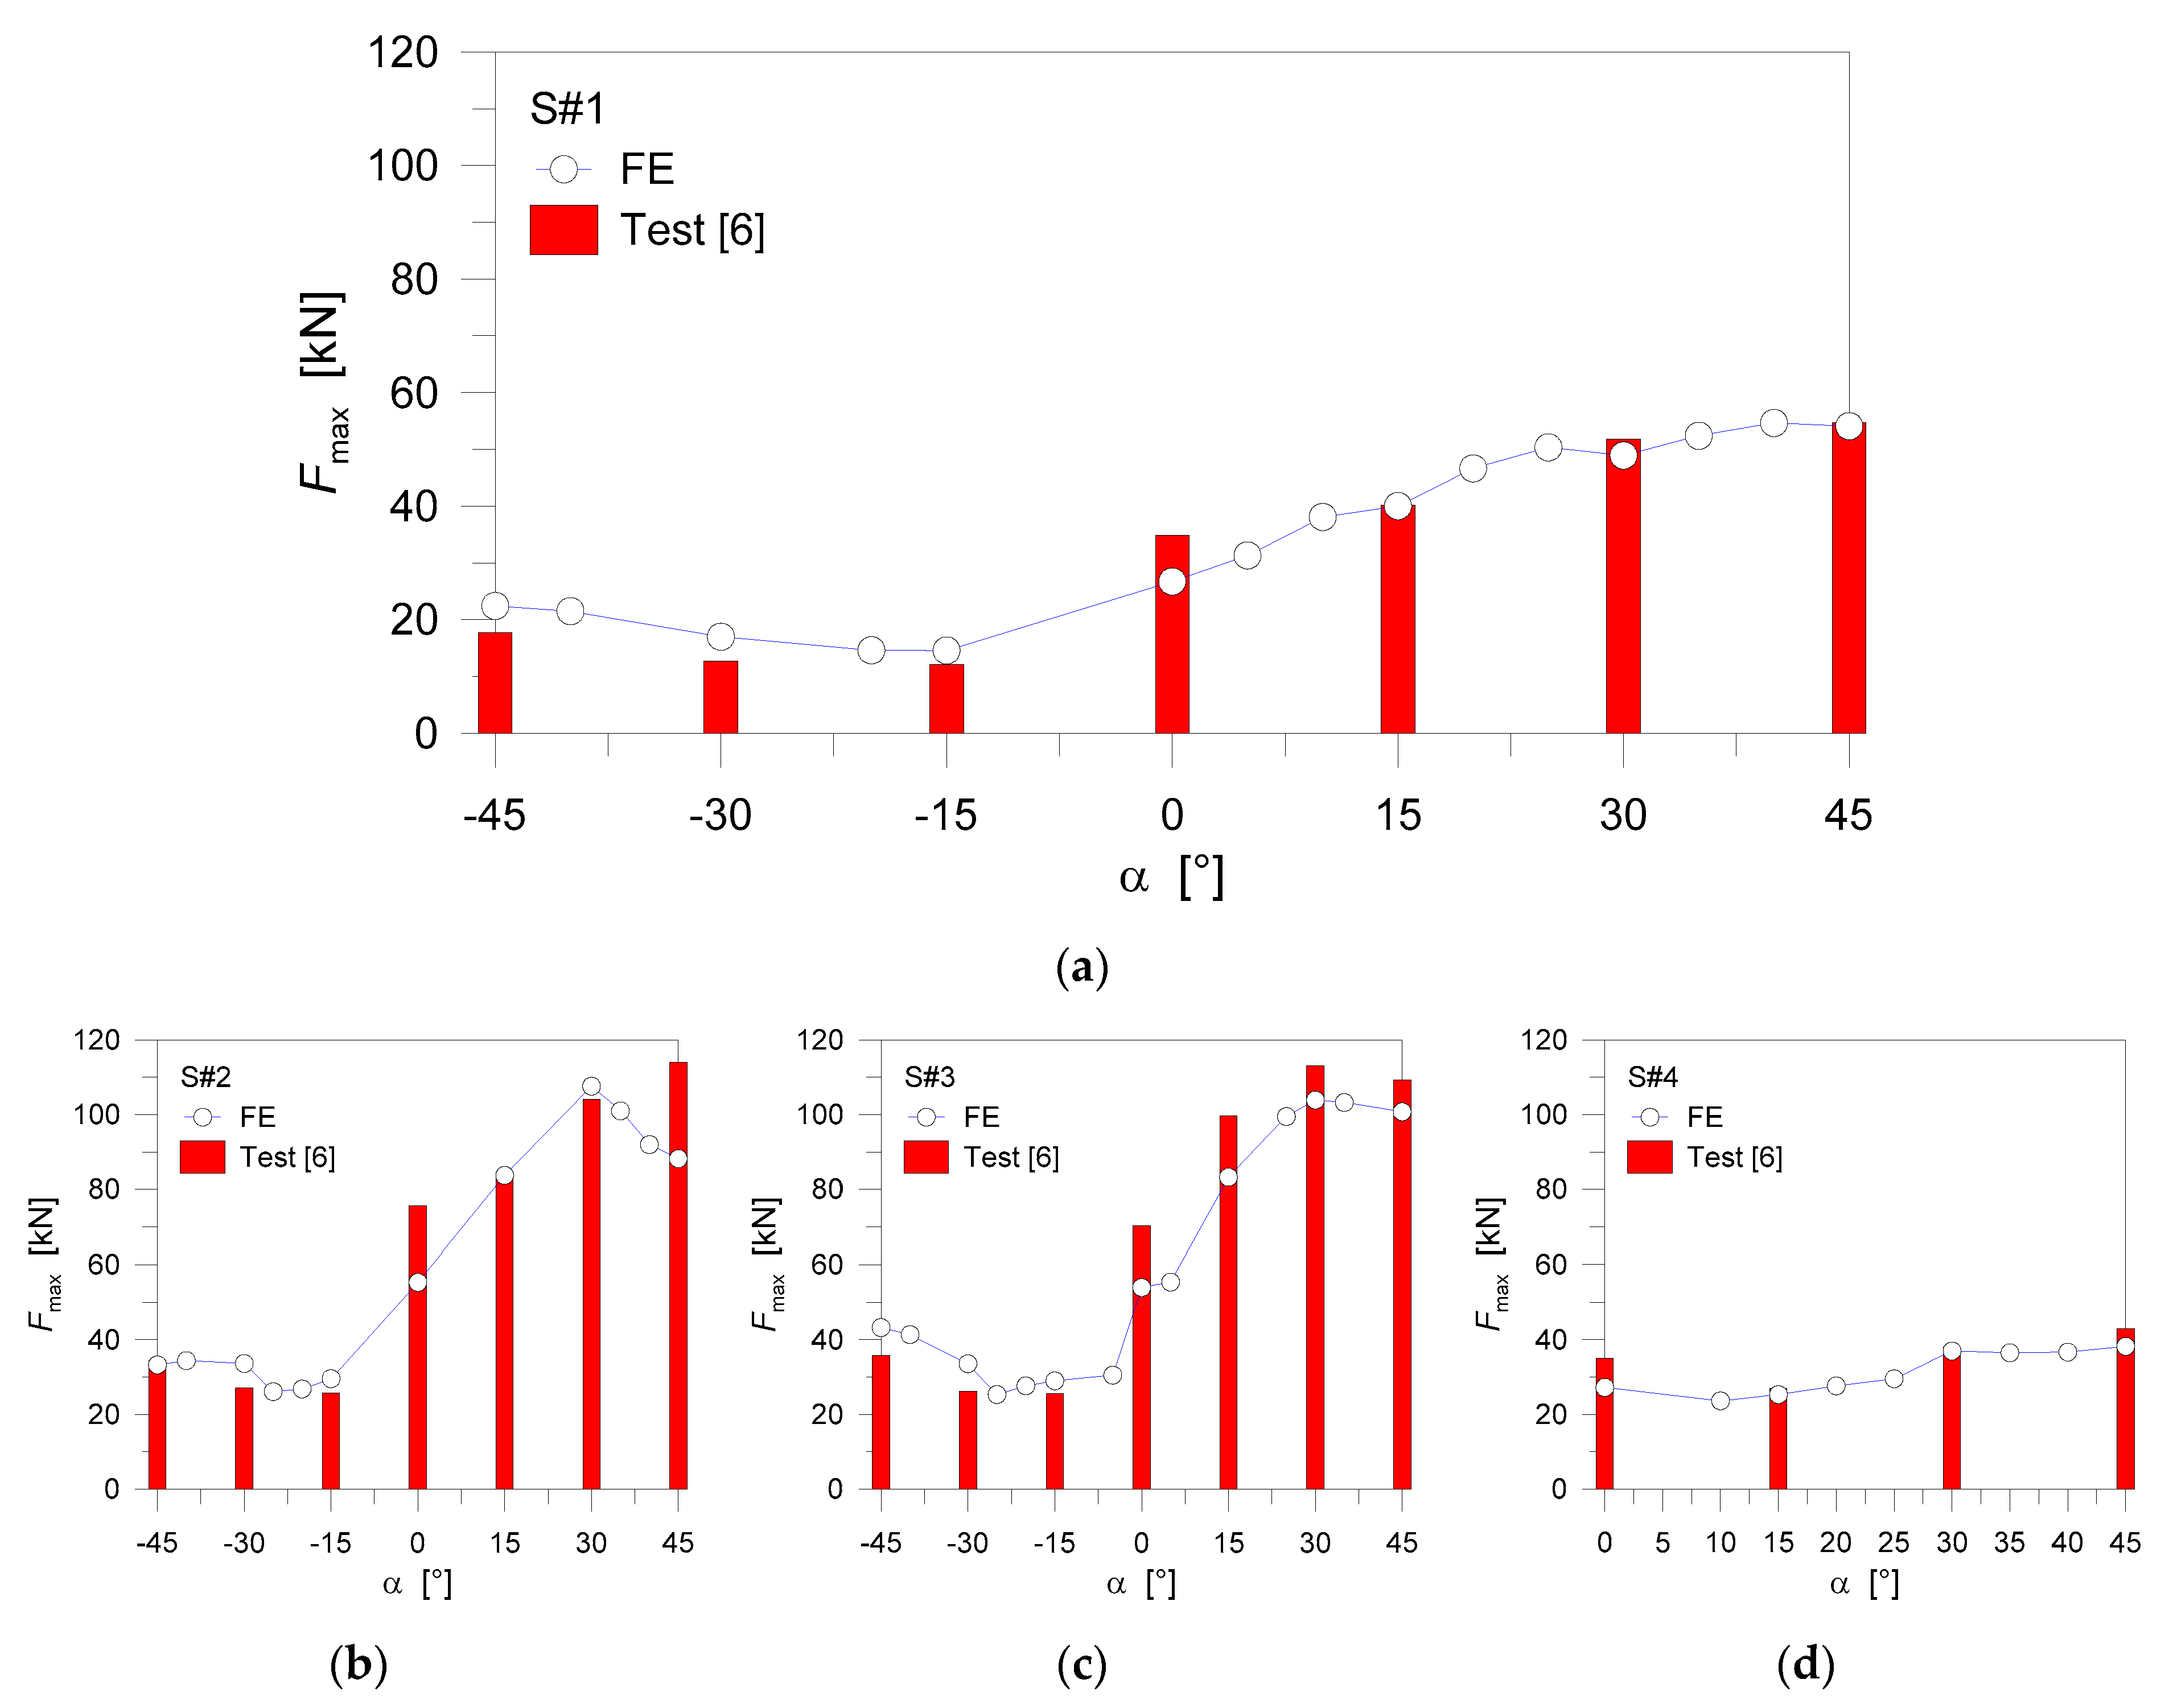
In Figure 10, some comparisons are proposed in terms of maximum resistance values for the S#1-to-S#4 TTC joints, grouped by series of specimens, with the support of experimental data from [6]. As a general outcome of the overall parametric numerical simulations, the FE models generally gave evidence of a mostly stable variation of the estimated Fmax values with. Despite such a stable numerical dependency of Fmax estimations on α, however, in some cases the scatter between numerical and past experimental predictions was found to be in the order of ±30%. The numerical results were in fact found to either underestimate or overestimate the corresponding experiments, depending on the number and inclination of STSs. For the majority of the examined TTC joints, the FE results proved to be non-conservative especially for the specimens under shear-tensile loads (0 < α ≤ 45°).
A possible motivation of such a kind of comparative outcomes could lie in localized numerical issues (i.e., numerical singularities, local damage phenomena), and this is especially the case of TTC joints with STSs characterized by high inclination values. In any case, given also the lack of a detailed experimental characterization for the mechanical properties of the material in use, the FE modelling approach herein discussed proves to offer reasonable estimations for the expected maximum force of TTC joints with inclined STSs, and thus to represent a valid support for design.
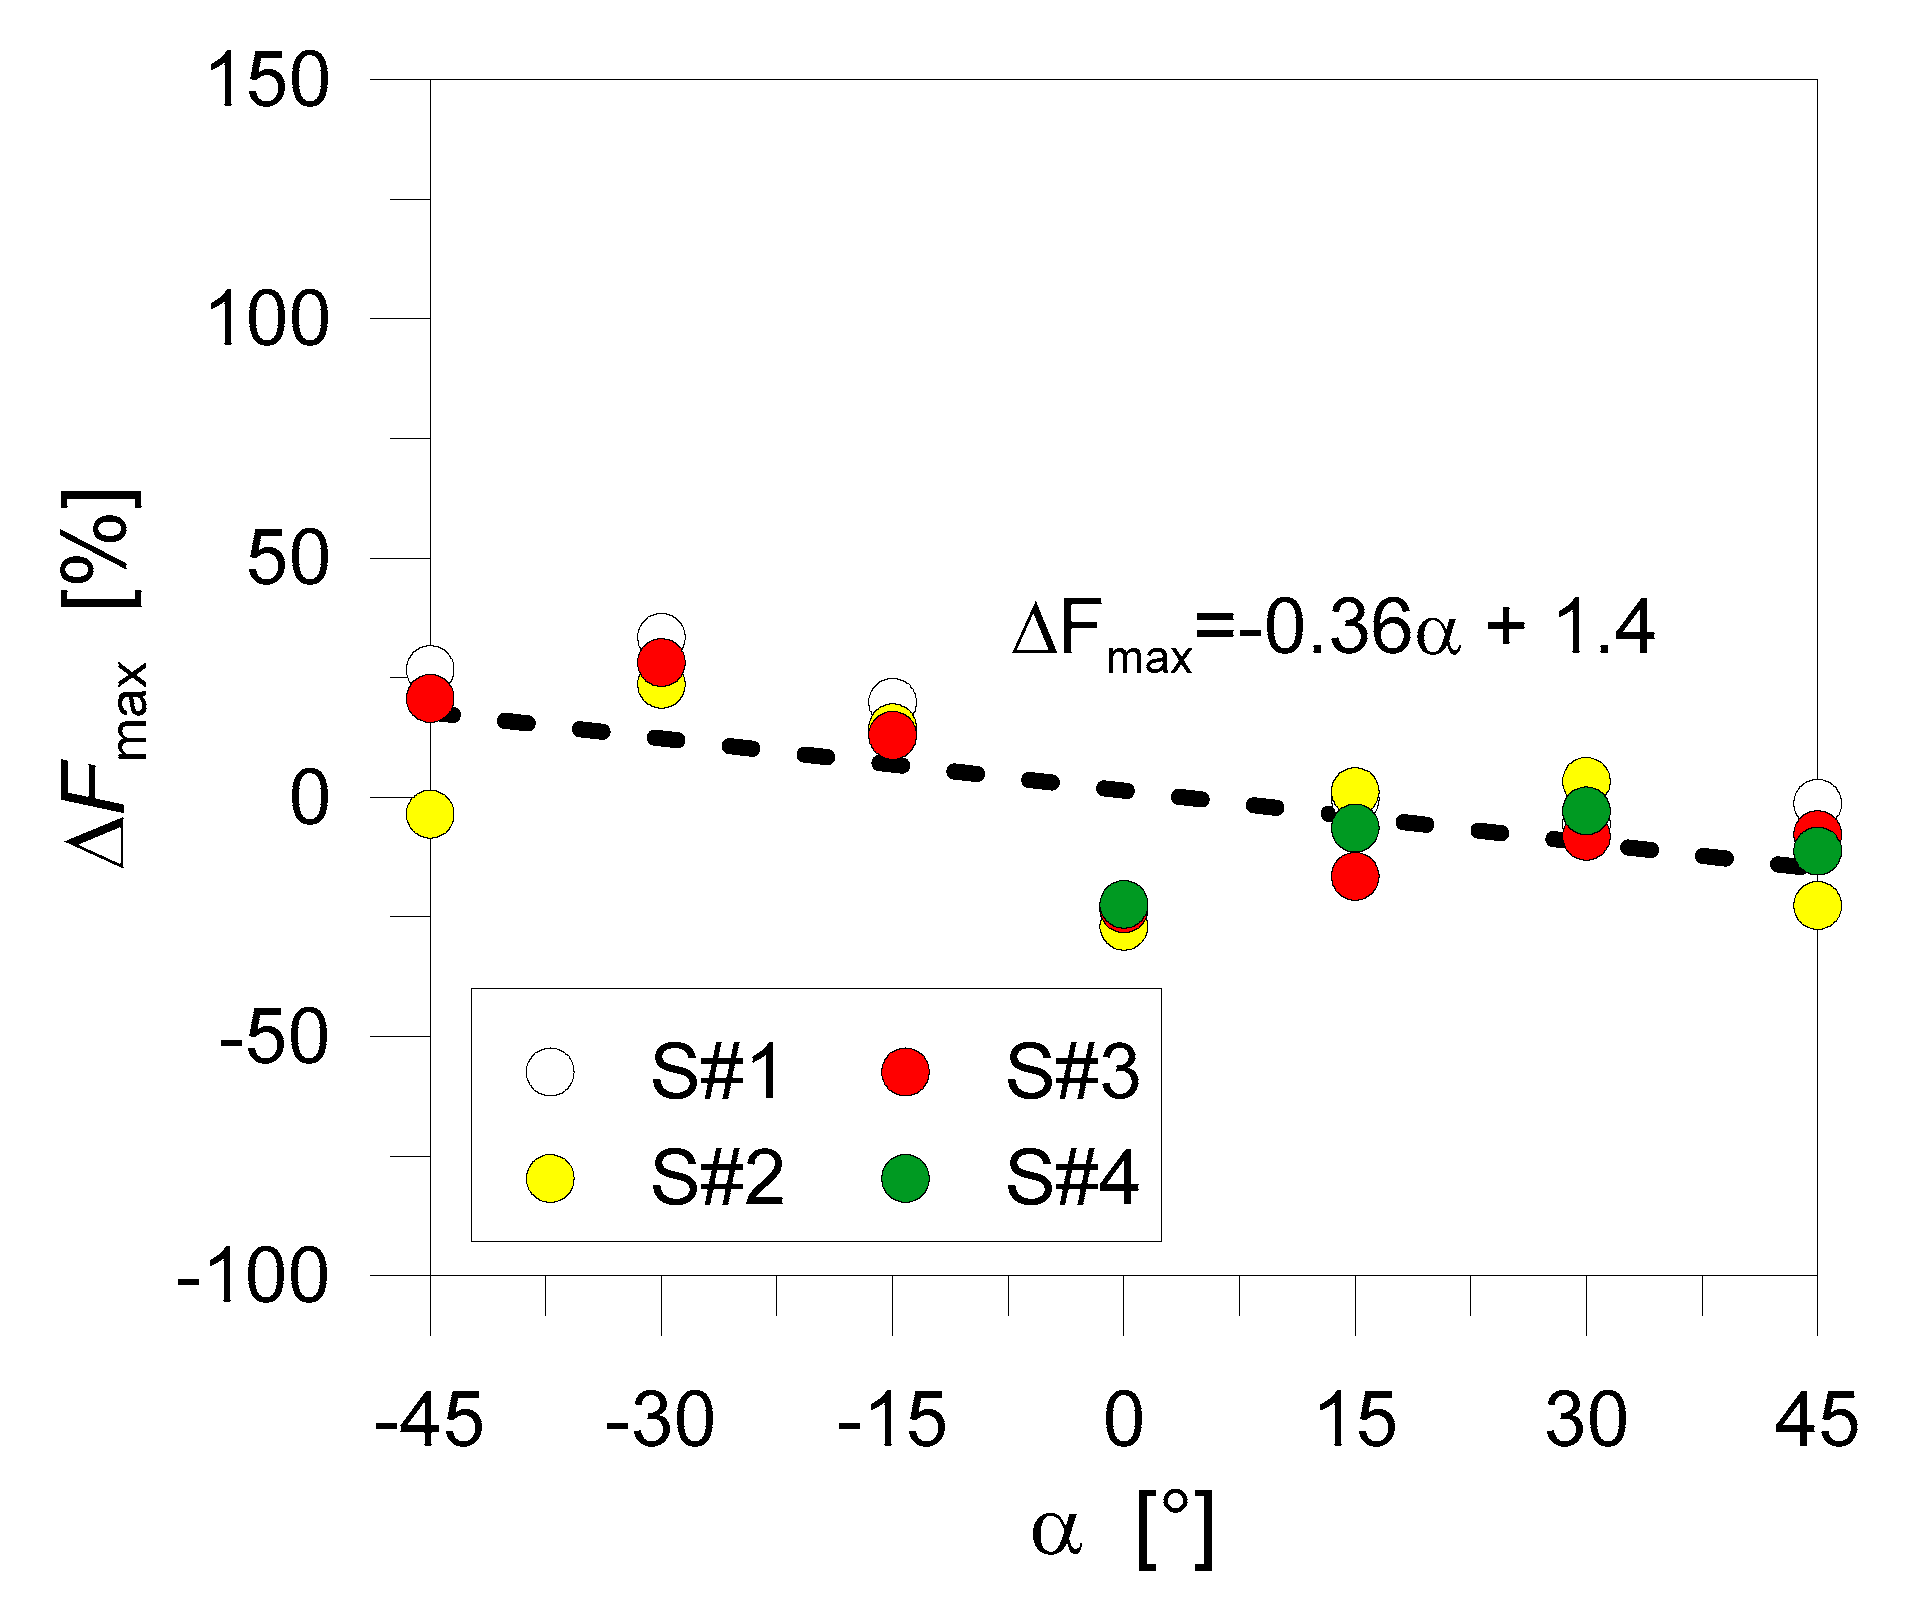
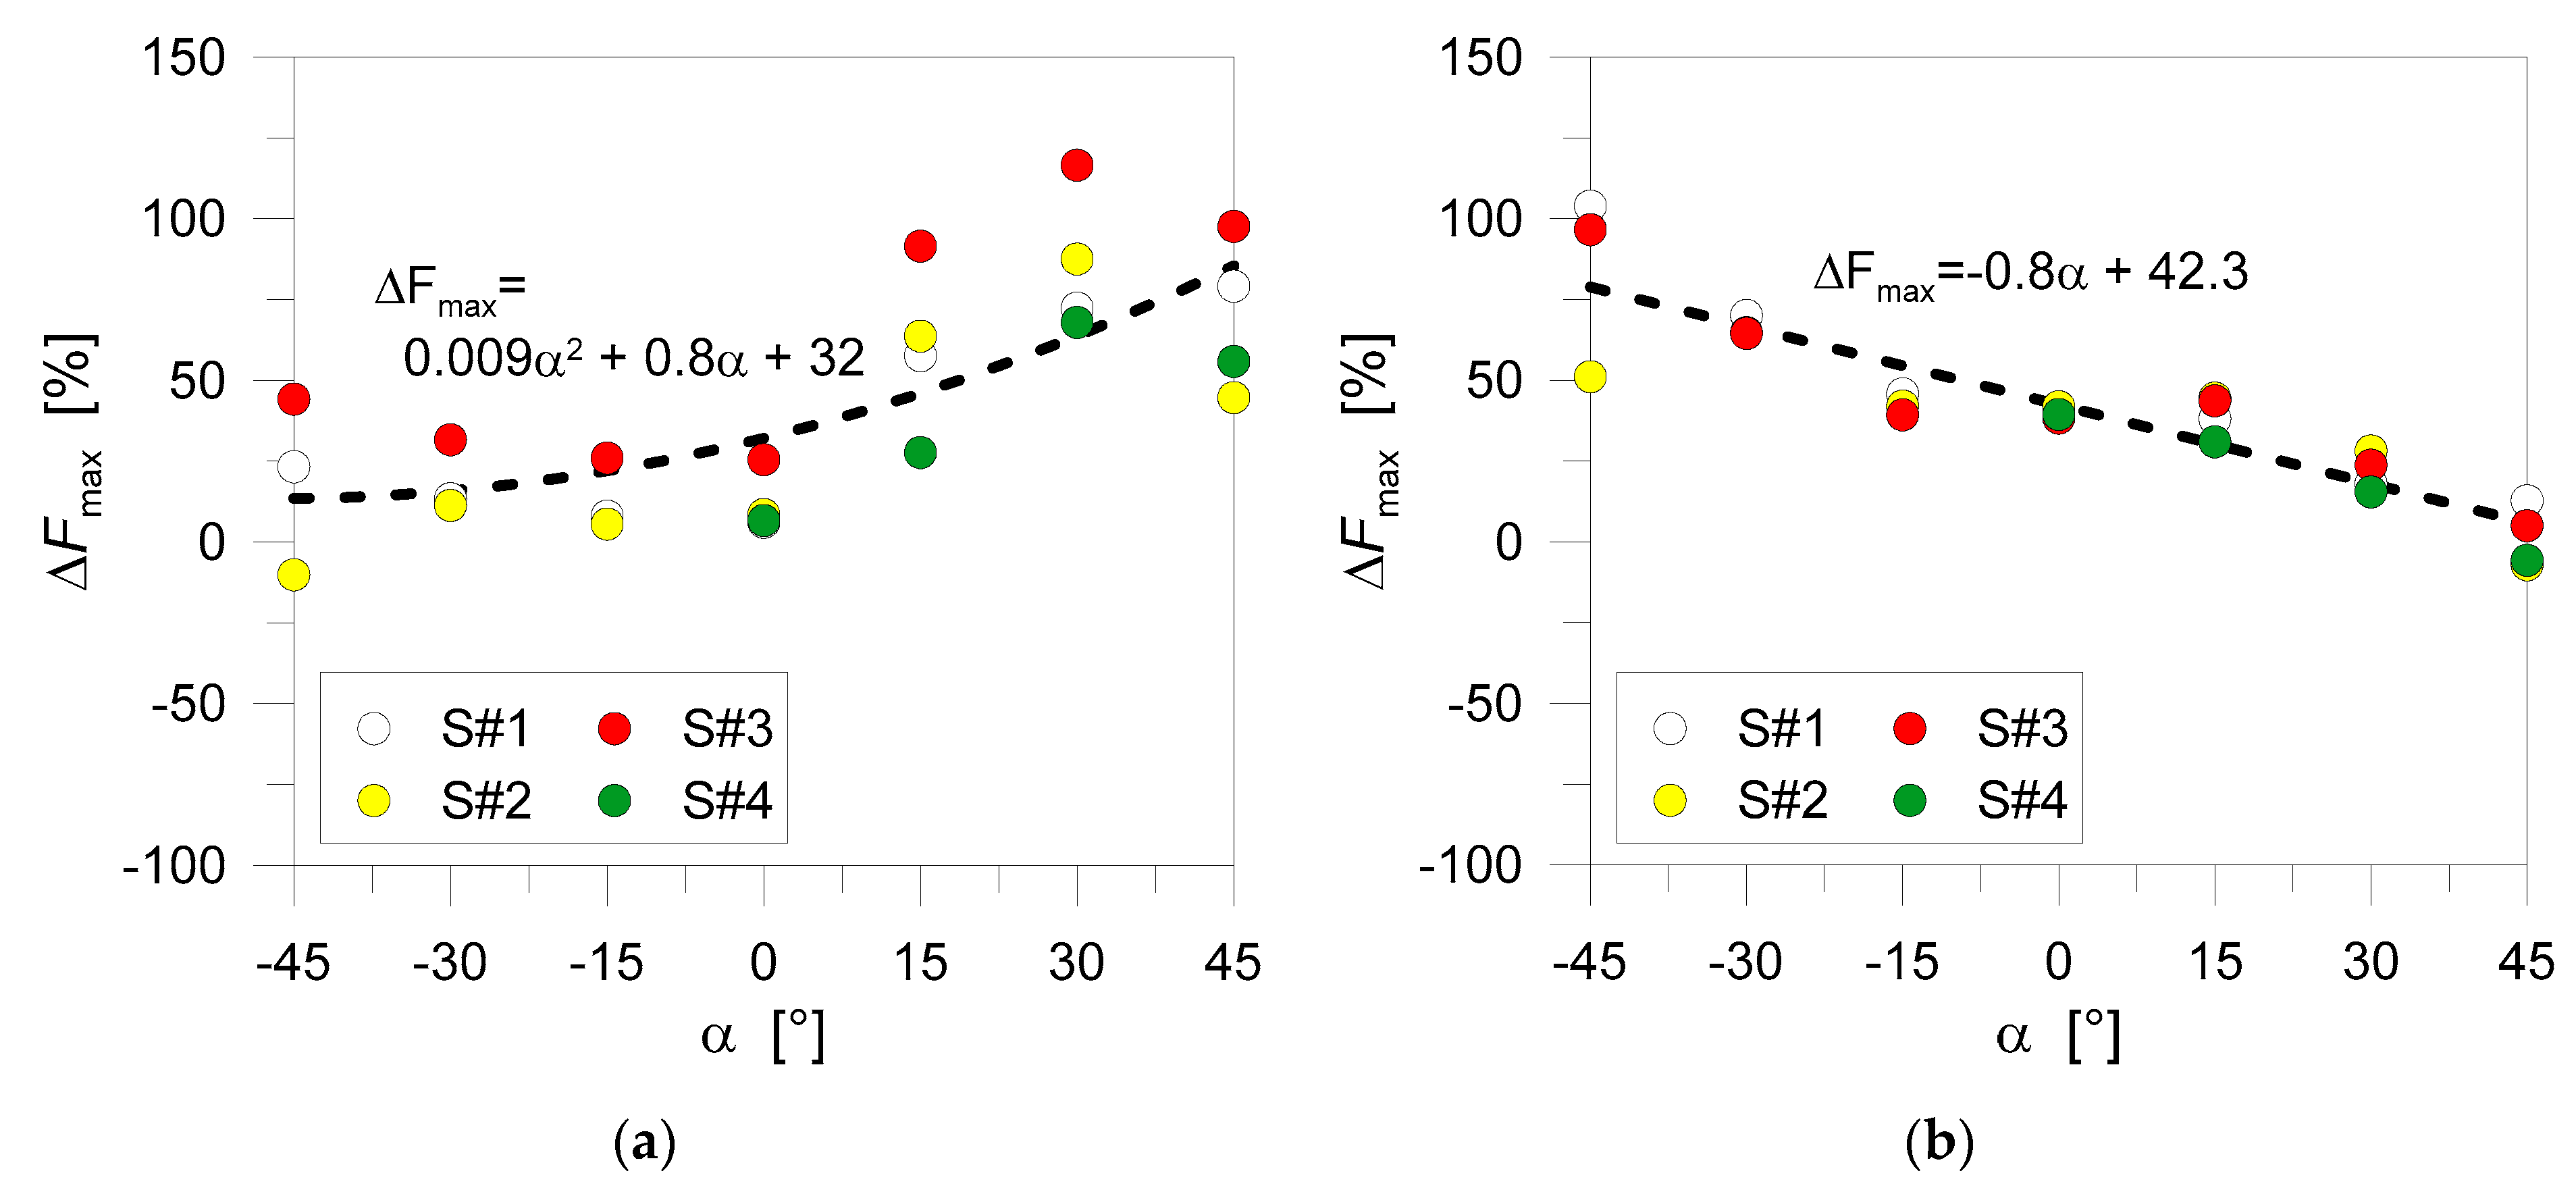
Worth of interest in Figure 11, in this regard, is the general trend of the calculated percentage scatter for the so-derived maximum force values Fmax. In the figure, the scatter Fmax is calculated as:
where xFE denotes the numerical force peak for each FE analysis and x the corresponding experimental average value (for each test series), as derived from [6].
It is thus possible to notice that as far as the number and arrangement of the STSs in use modifies, the calculated Fmax is mostly regular, for all the examined series of TTC specimens. This can be also perceived by the linear fitting curve that is proposed in Figure 11, as a function of the screw inclination α.
5.2. Analytical Assessment of Maximum Force Predictions (Fmax)
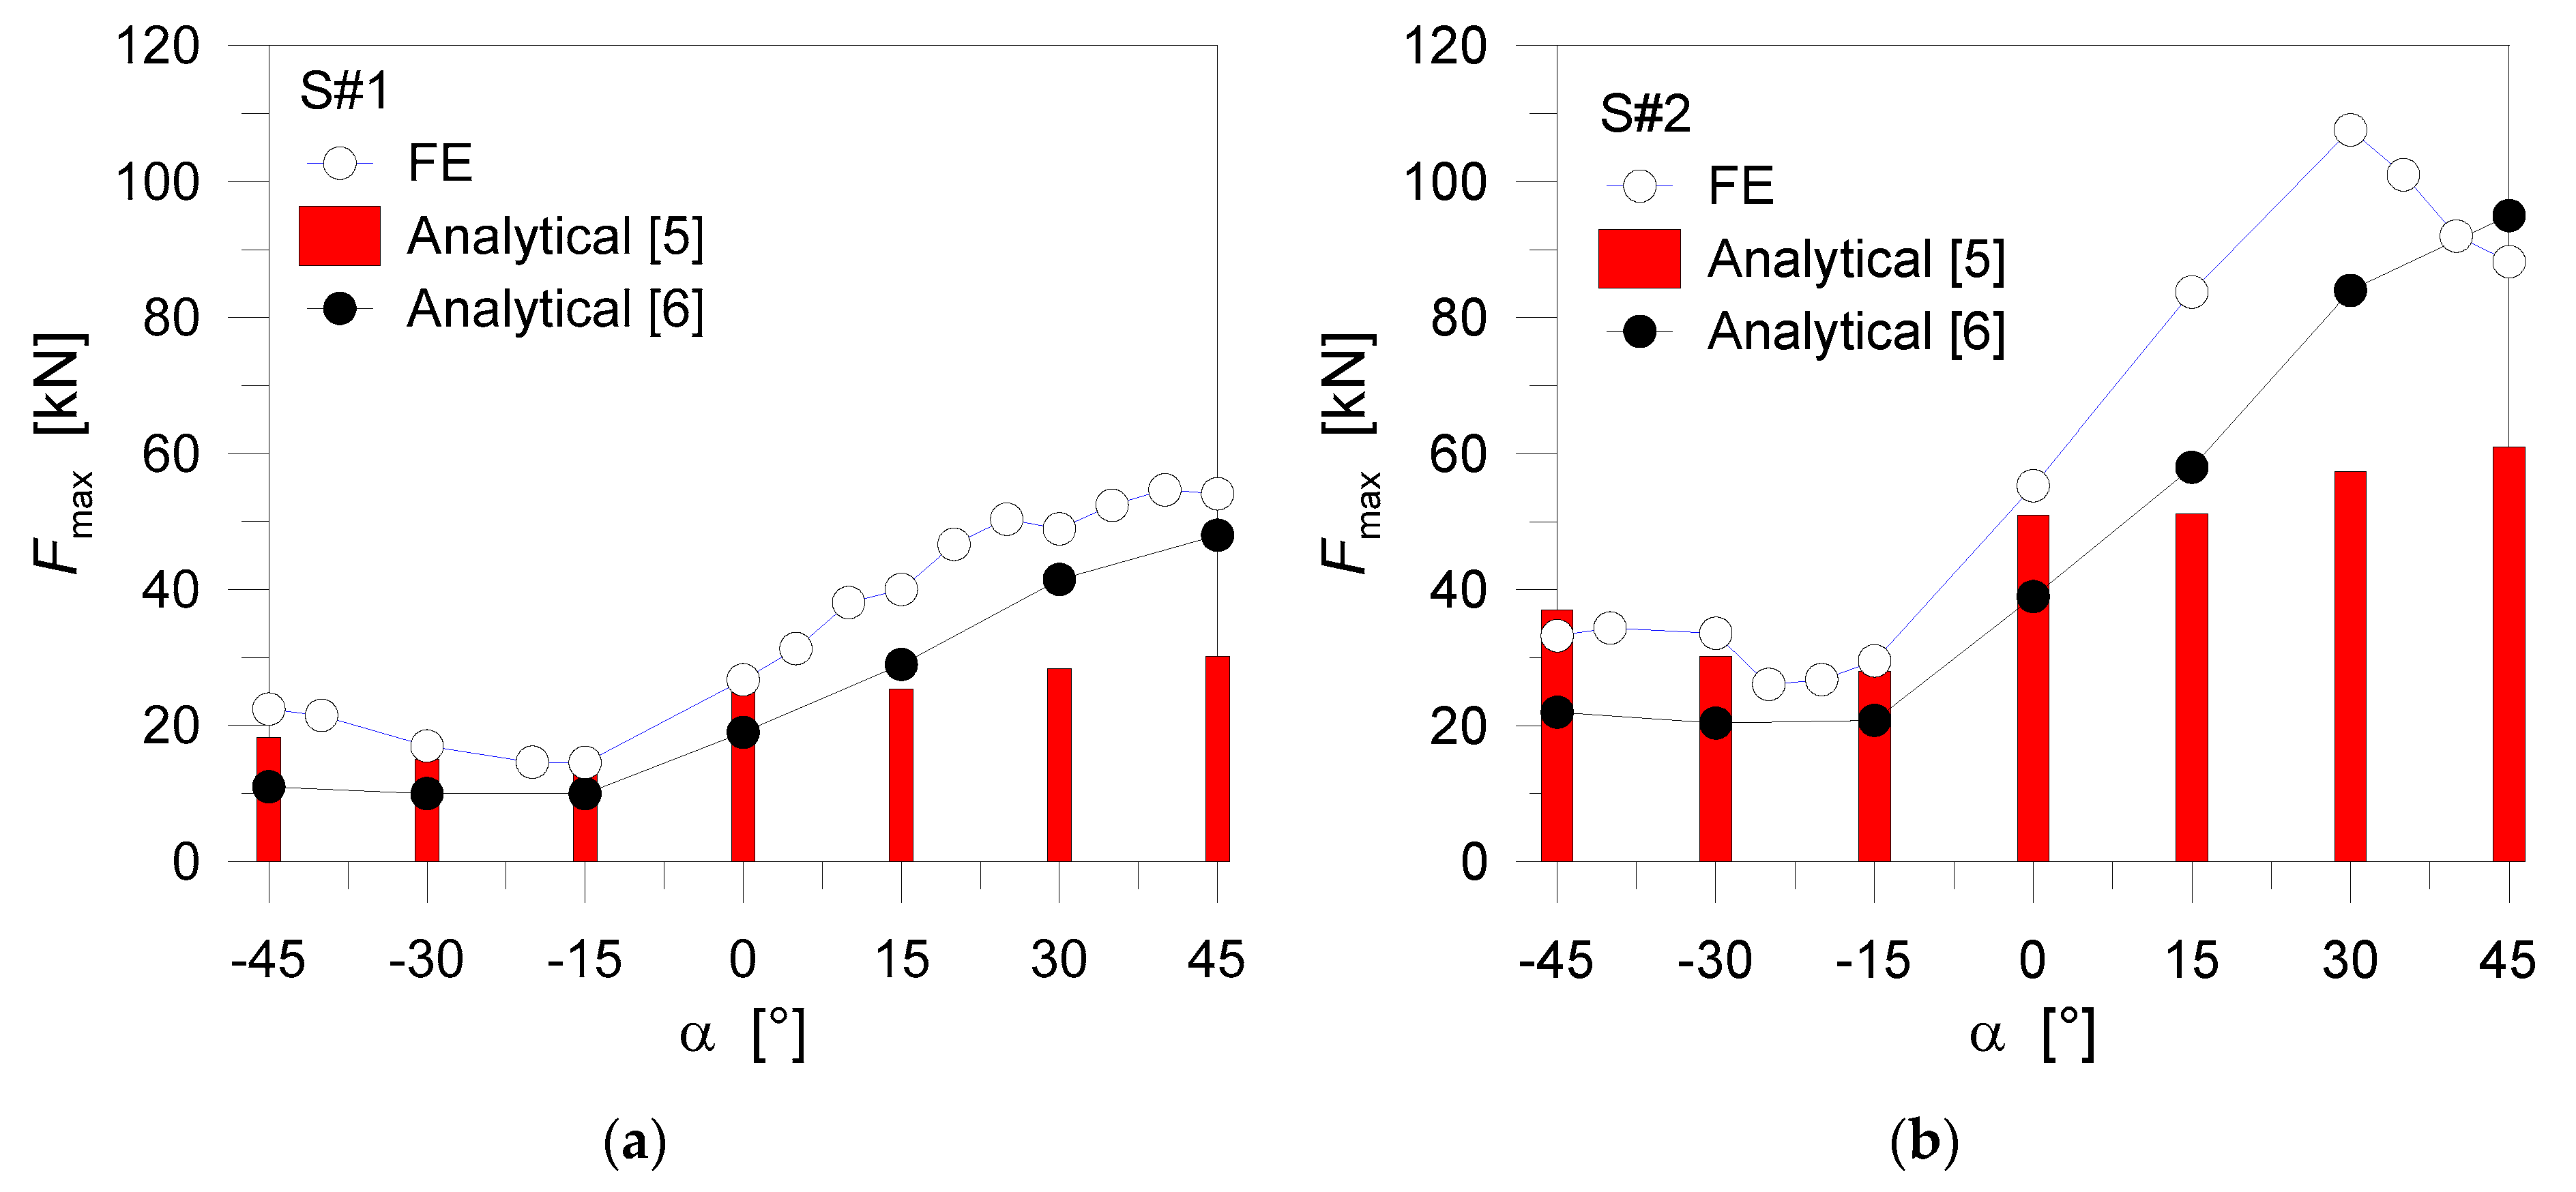
A further assessment of the collected FE numerical results can be carried out with the support of two suitable analytical models of literature, namely the Eurocode 5 provisions [5] or the enhanced analytical model proposed by in [6] by Tomasi et al. Figure 12 presents the so-collected comparative data, grouped by series of TTC joints. Disregarding the joint configuration and the number/inclination of STSs, the Eurocode 5 generally manifests a weak reliability of maximum force estimates. On the other side, Figure 12 shows an improved correlation between the analytical model from [6] and the FE numerical predictions discussed herein.
As far as the percentage scatter in Equation (5) is taken into account for the analytical assessment of numerical output data, the typical result takes the form of Figure 13. For most of the examined TTC configurations, it is important to notice that the FE models in use typically manifested a marked overestimation of the analytical predictions. Following the experimental validation in Section 5.1, this suggests that both the Eurocode 5 analytical approach and the enhanced analytical model in [6] are able to only roughly capture the complex mechanical behaviour of TTC joints with inclined STSs. In any case, Figure 13 shows that the calculated percentage scatter is generally less pronounced and regular for the FE numerical results towards the analytical formulation in [6], thus confirming the weakness of the Eurocode 5 approach.
5.3. Experimental and Analytical Assessment of Serviceability Stiffness Predictions (Kser)
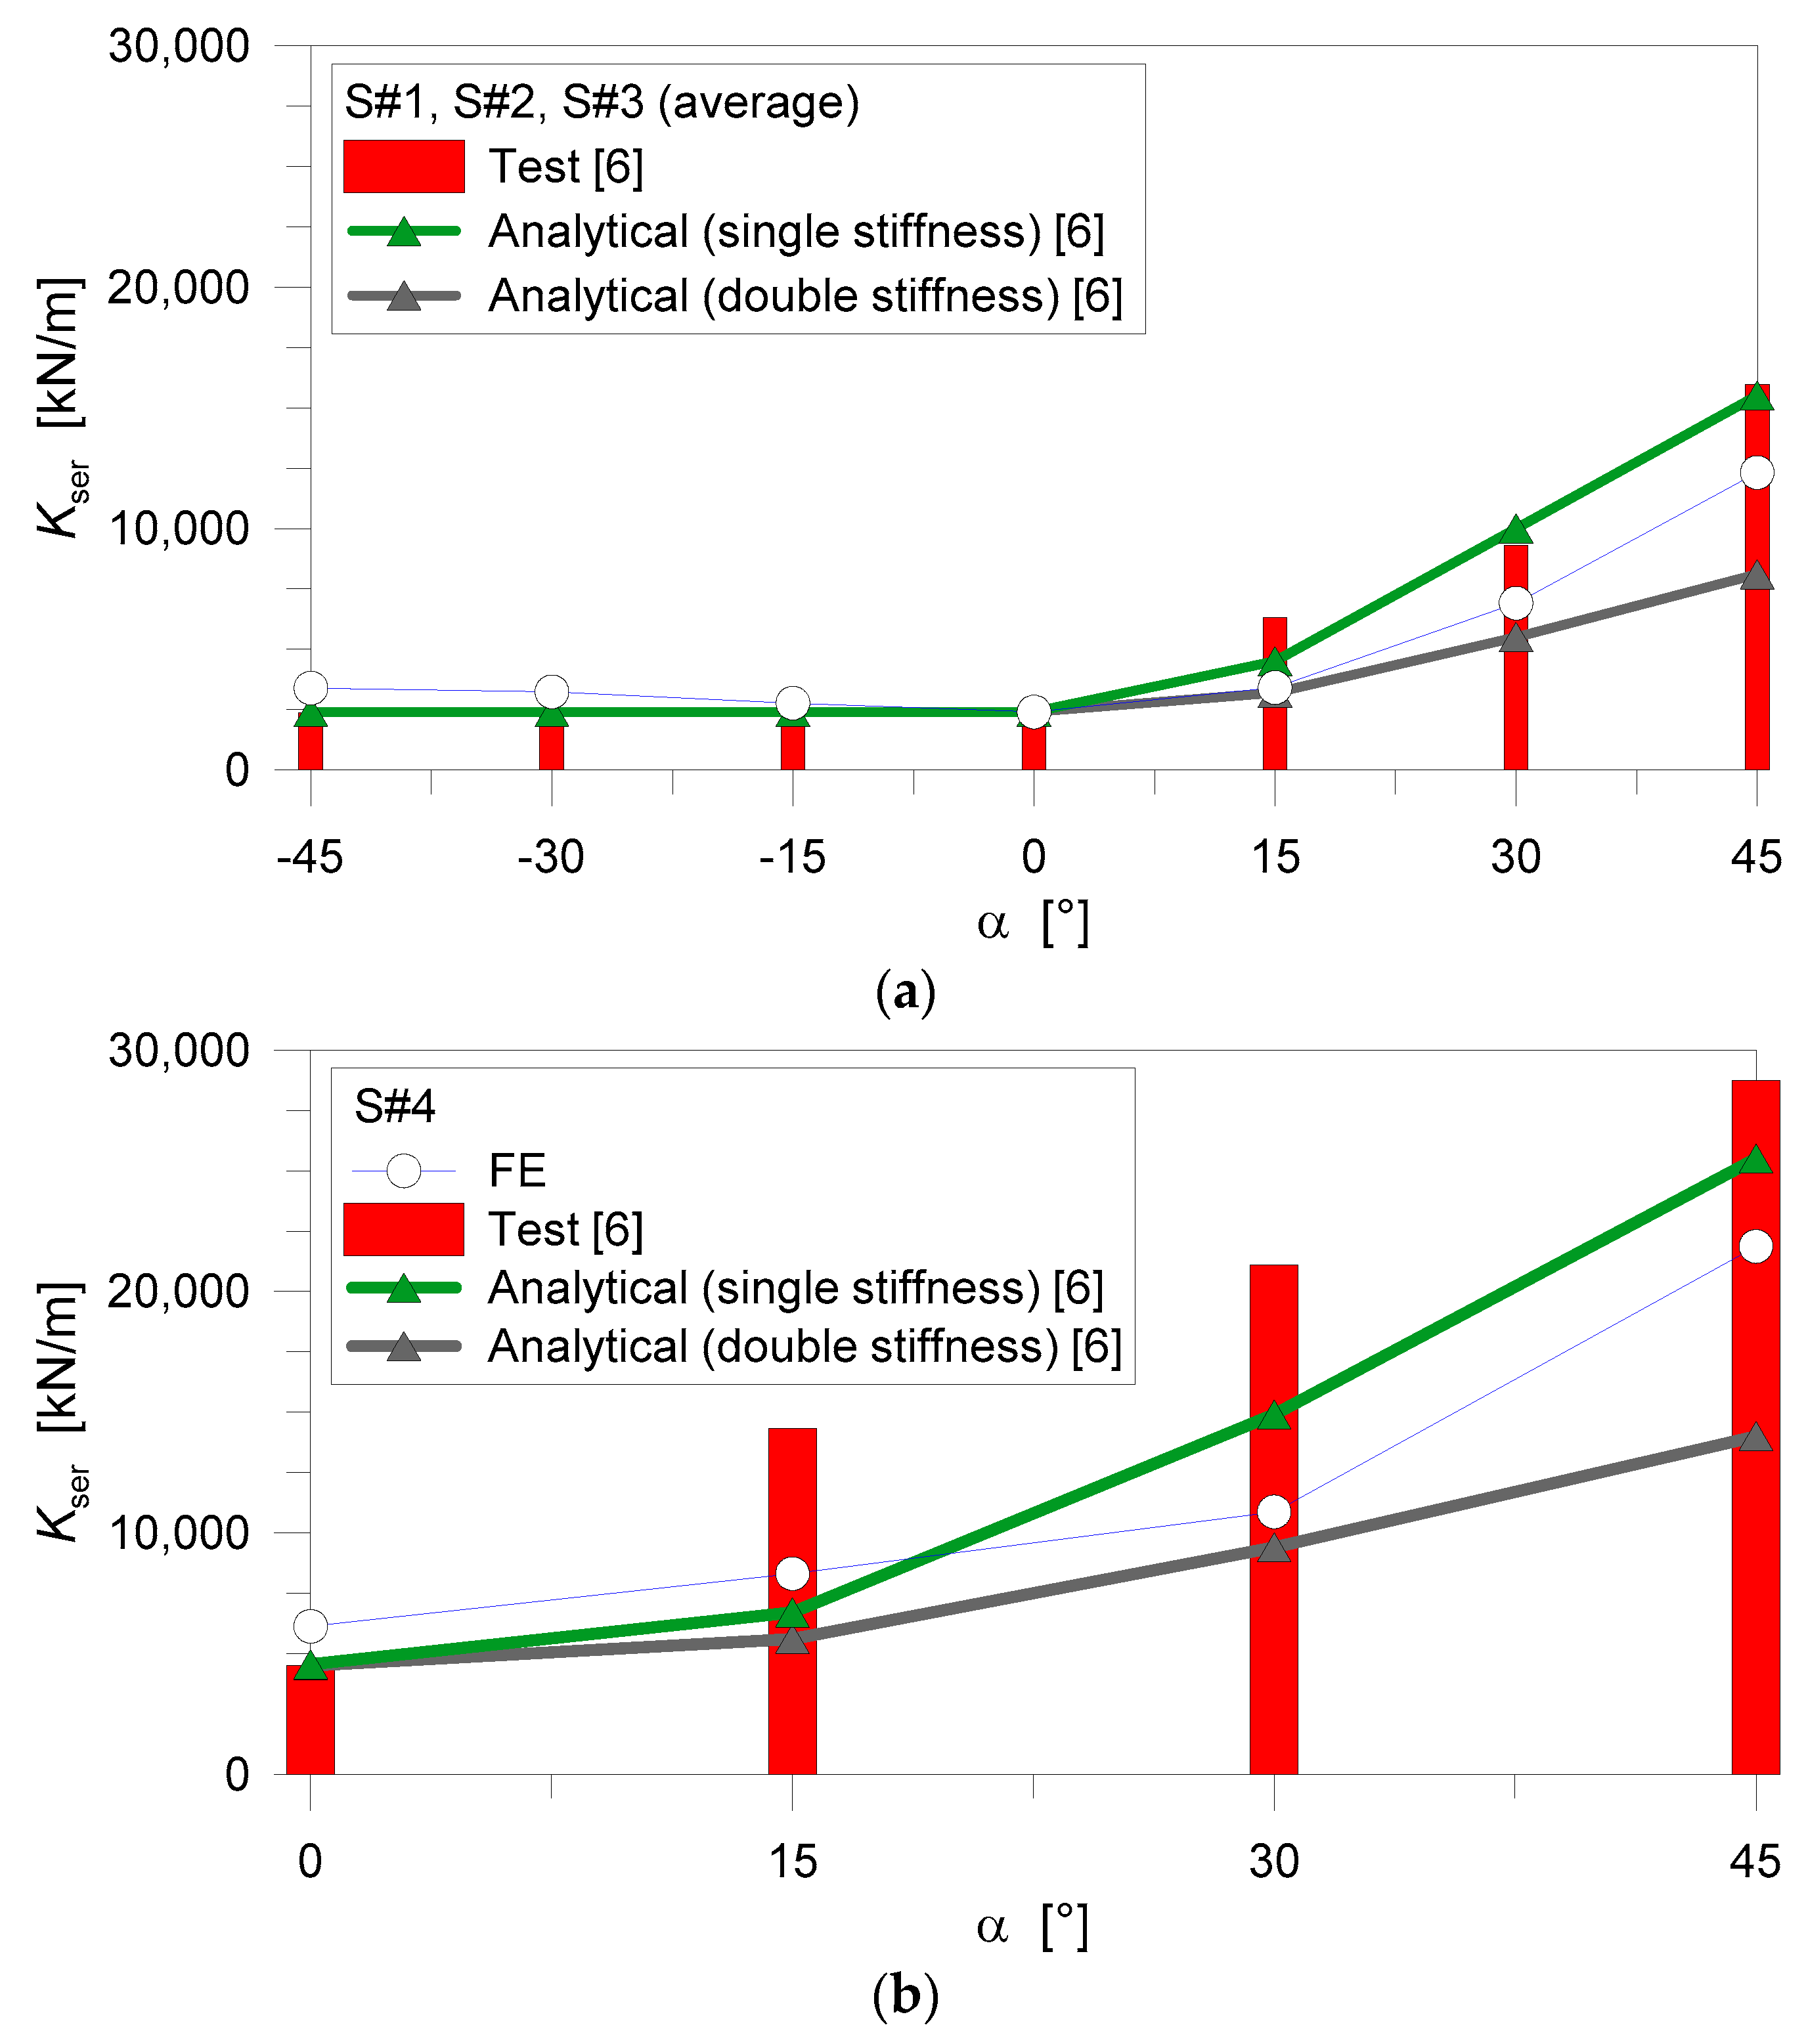
The elastic stiffness Kser is then estimated for the examined TTC joints, based on Equation (3) and the collected numerical force-slip curves. In Figure 14, the FE stiffness values are reported for the S#1-to-S#3 type (average) or S#4 type of specimens, as a function of α. Comparisons are proposed towards the past experimental data from [6], as well as the enhanced analytical formulation proposed in [6].
In general, a rather close correlation can be observed for the stiffness trend of most of the S#1, S#2 and S#3 configurations in Figure 14. However, major scatter of the FE predictions to the experiments can be still observed especially for high α values, both for shear-tension and shear-compression loading conditions. In the case of X-shaped joints, even a more pronounced sensitivity can be observed in terms of stiffness estimations as a function of α, compared to the S#1-to-S#3 joints and the respective experimental data from [6]. In terms of analytical assessment, finally, the same numerical predictions in Figure 14 are comprised, for the majority of joint configurations, between the single/double stiffness predictions derived from [6].
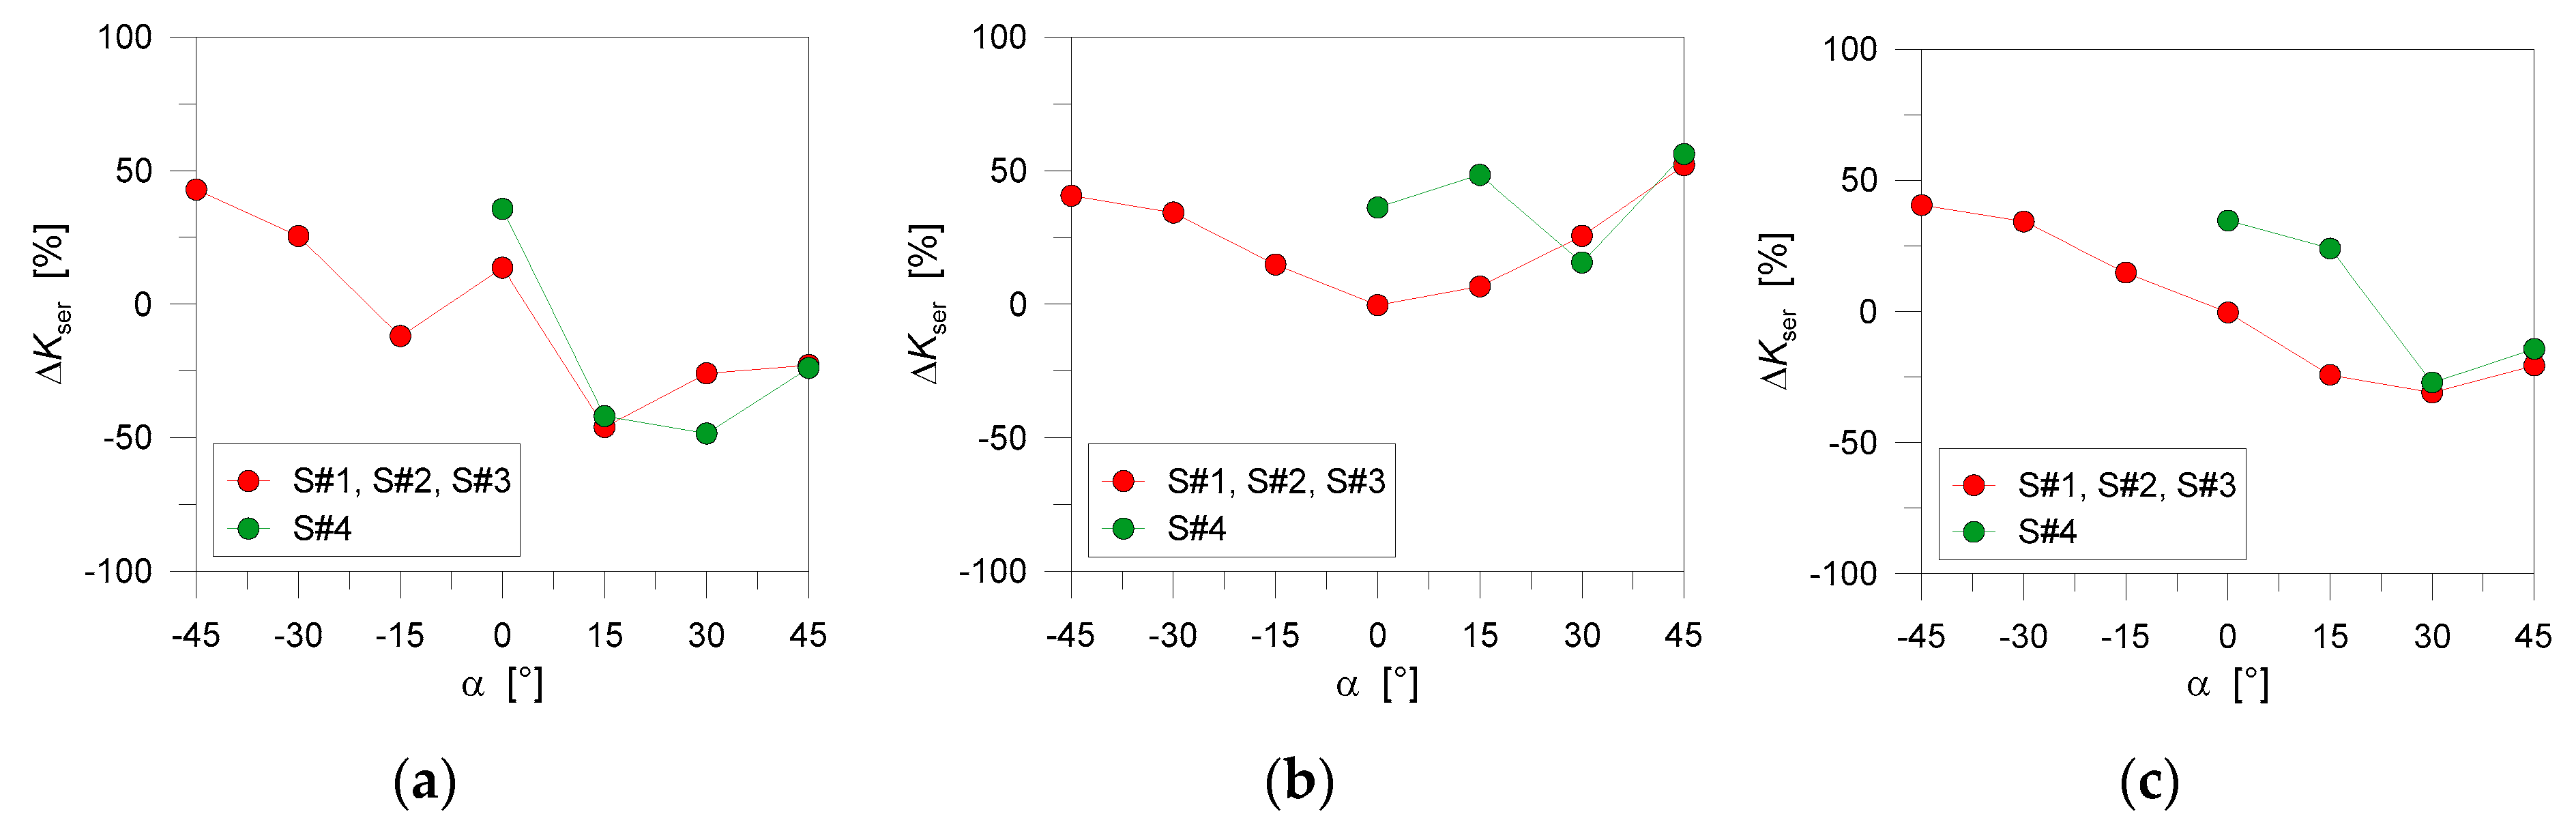
As far as the percentage scatter is calculated from Equation (5), it is interesting to notice in Figure 15 that such a variation is less regular than in the case of maximum force predictions, when the inclination α modifies. For the experimental data in Figure 15a, the scatter trend is mostly regular for all the S#n joints, thus suggesting a certain stability of material properties and mechanical assumptions for the FE models in use. Major sensitivity can be perceived in Figure 15b,c, as far as the single stiffness or double stiffness analytical model from [6] is taken into account.
6. Parametric FE Investigation
Besides the rather close correlation in Section 5 for the FE predictions and the experimental and analytical results of literature, the sensitivity of the modelling technique to some influencing properties was further assessed. As a reference configuration, the typical FE model herein considered is thus characterized by input properties according to Section 3.
6.1. Mechanical Interactions and CZM Damage Parameters
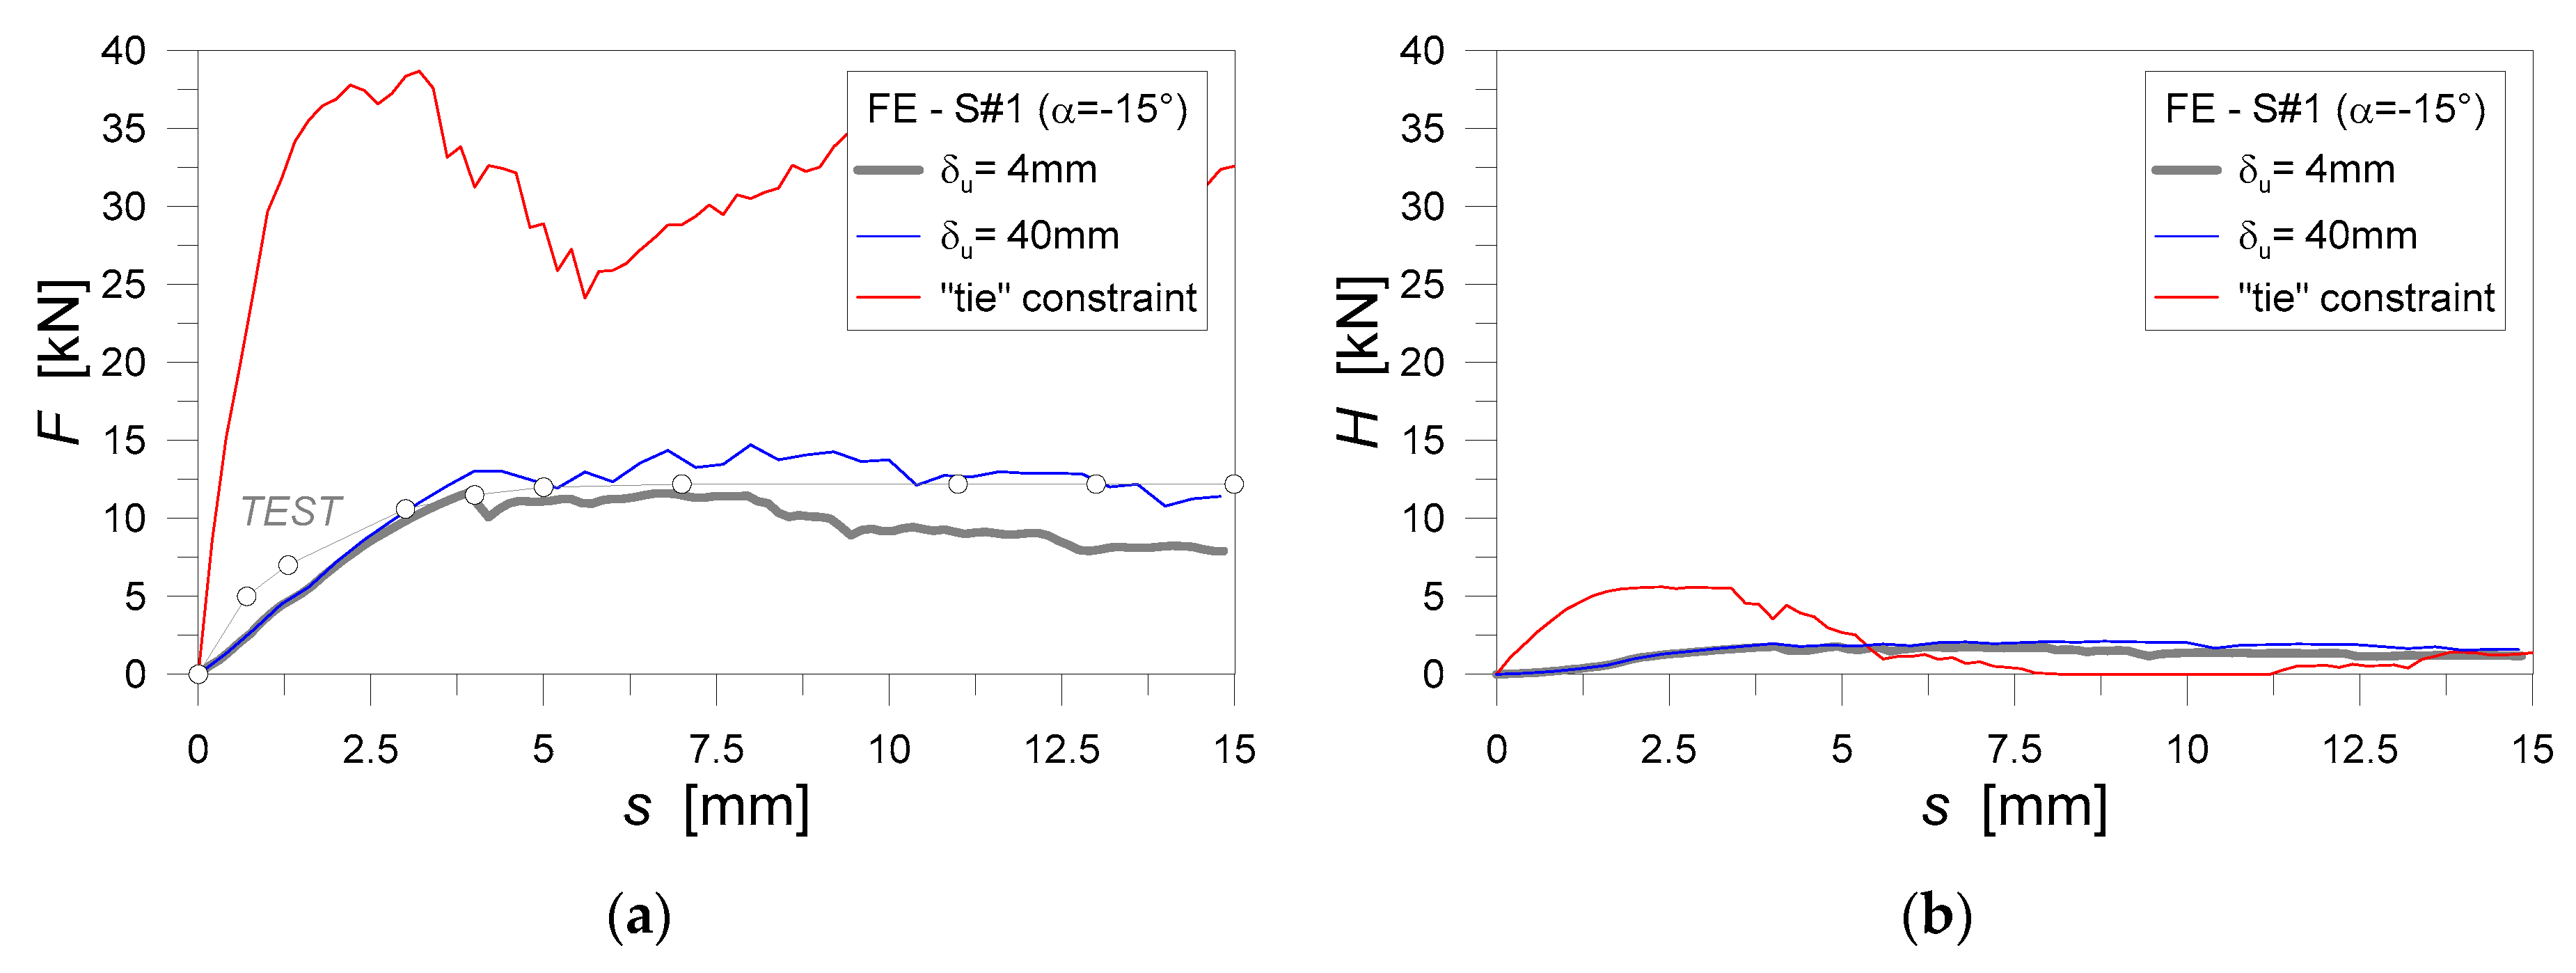
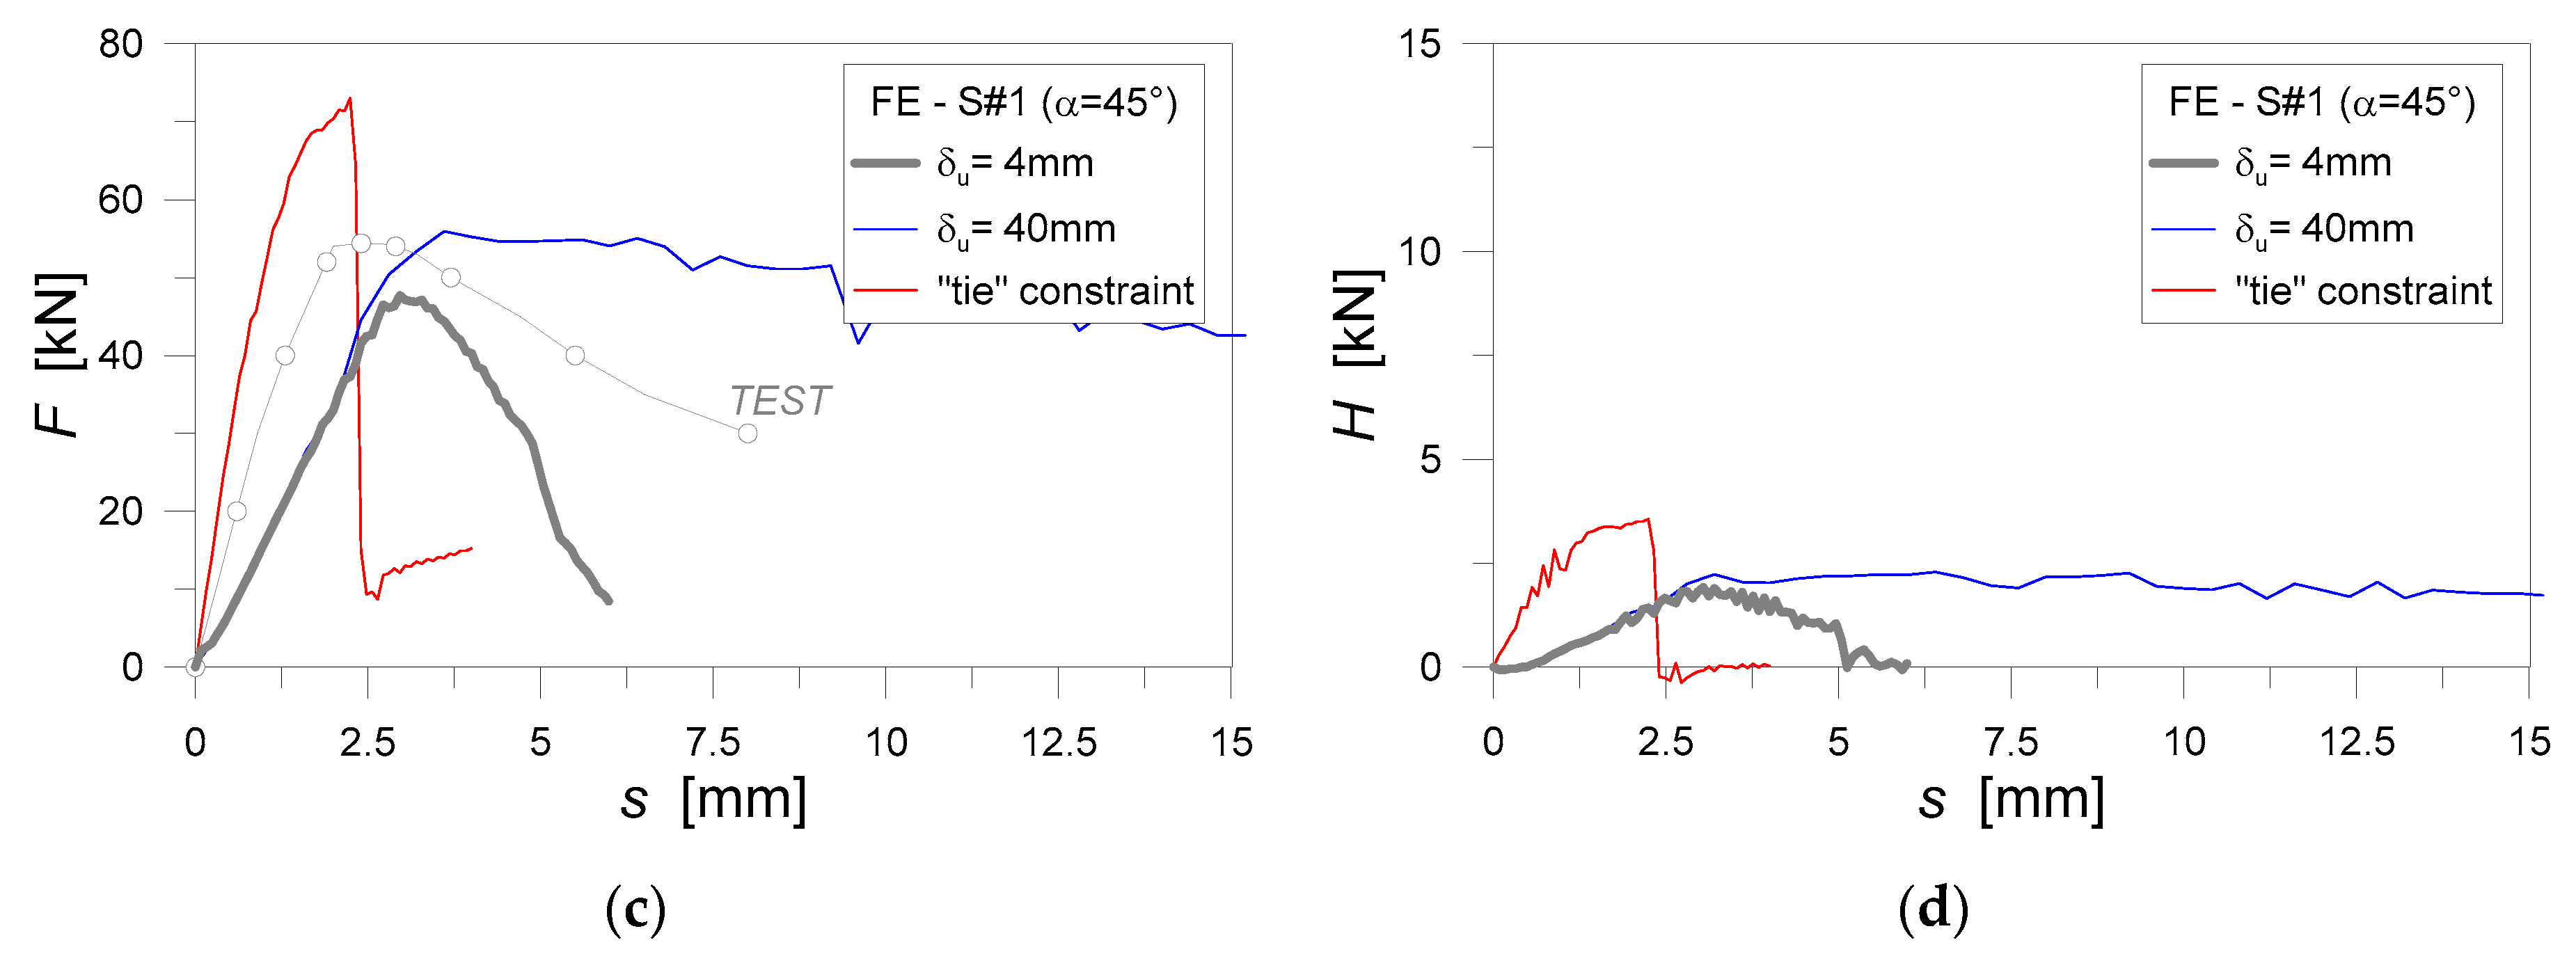
A first insight is dedicated to the effects of mechanical interactions, with a special care of the STSs in use. It was shown in Section 3 the key role of the soft layer with the CZM contact interaction, as well as of reliable material property definitions. In this sense, the “upper limit condition” for the parametric study is assumed as a “tie” rigid constraint that is used to replace the CZM interaction for the soft layer (Figure 6). In other words, any kind of possible damage propagation in the region of screws (with the exception of possible material degradation in the timber and steel components) is fully disregarded. The “lower limit condition”, at the same time, is set to coincide with the CZM formulation in Section 3 (with δu = 4 mm, Table 2). Among these two conditions, further FE analyses are carried out with the CZM input parameters of Section 3 (Table 2), but progressively increasing the reference failure displacement δu in the range from 4mm to a maximum of 10 × 4 = 40 mm. From a practical point of view, such a variation in δu represents a residual capacity of the soft-layer to provide a certain mechanical interaction between each STS and the surrounding timber. Such an input value was in fact magnified so as to reproduce an ideal bonding condition with a weak mechanical degradation for the soft-layer interface, even under large slip amplitudes (Figure 6e). Selected numerical results are proposed in Figure 16 for two different screw arrangements (S#1 joints), in terms of measured vertical (F) and horizontal (H) base reaction forces as a function of the measured slip s.
Major variations between the comparative plots are represented by the screw inclination, with α = −15° and +45°.
The use of CZM interfaces, as also expected, proved to have a key effect on the collected mechanical responses for the selected STS configurations. This was observed especially towards the “upper limit condition” characterized by the use of rigid “tie” constraint. In the latter case, the FE outcomes were in fact typically associated to unreliable local and global effects for the examined TTC joints, with a consequent marked increase of both the calculated serviceability stiffness Kser and ultimate resistance Fmax. Such a combination of phenomena, finally, was also found associated to a remarkable modification of the measured reaction forces (see for example Figure 16b–d).
Regarding the CZM interaction and failure, on the other side, major issues were represented by the accurate calibration of input parameters for damage initiation and evolution. While the nominal resistance values of timber (Table 1) can be reasonably taken into account for the CZM damage initiation, the characterization of its damage law would in fact necessarily require dedicated studies at the component level, and possibly the support of small-scale experiments.
Under the assumption of Table 2, the modification in δu was commonly associated to a rather constant elastic response for the examined TTC joints, but to a marked decrease of residual resistance and stiffness for most of the tested configurations. Such an effect can be notice in Figure 16. As far as the critical displacement δu for the CZM interaction increases, a reduced slope can be observed for the descending arm of the collected force-slip curves. Compared to the available experimental data from [6], a reliable fitting of degreasing arms for the comparative force-slip curves was observed in the range of δu = 6–7mm. This fitting value δu, however, results from a numerical calibration in which the nominal mechanical properties of timber are taken into account (Table 1 and Table 2). Accordingly, further refined, multi-objective and multi-parameter calculations should be carried out in this direction. Moreover, given that the CZM failure data were found to do not affect the initial stage of the collected force-slip curves (and thus the calculated serviceability stiffness and ultimate resistance for the examined joints), the reference value δu = 4mm could be taken into account for preliminary conservative calculations on timber members with similar mechanical properties/class.
6.2. Base Restraints
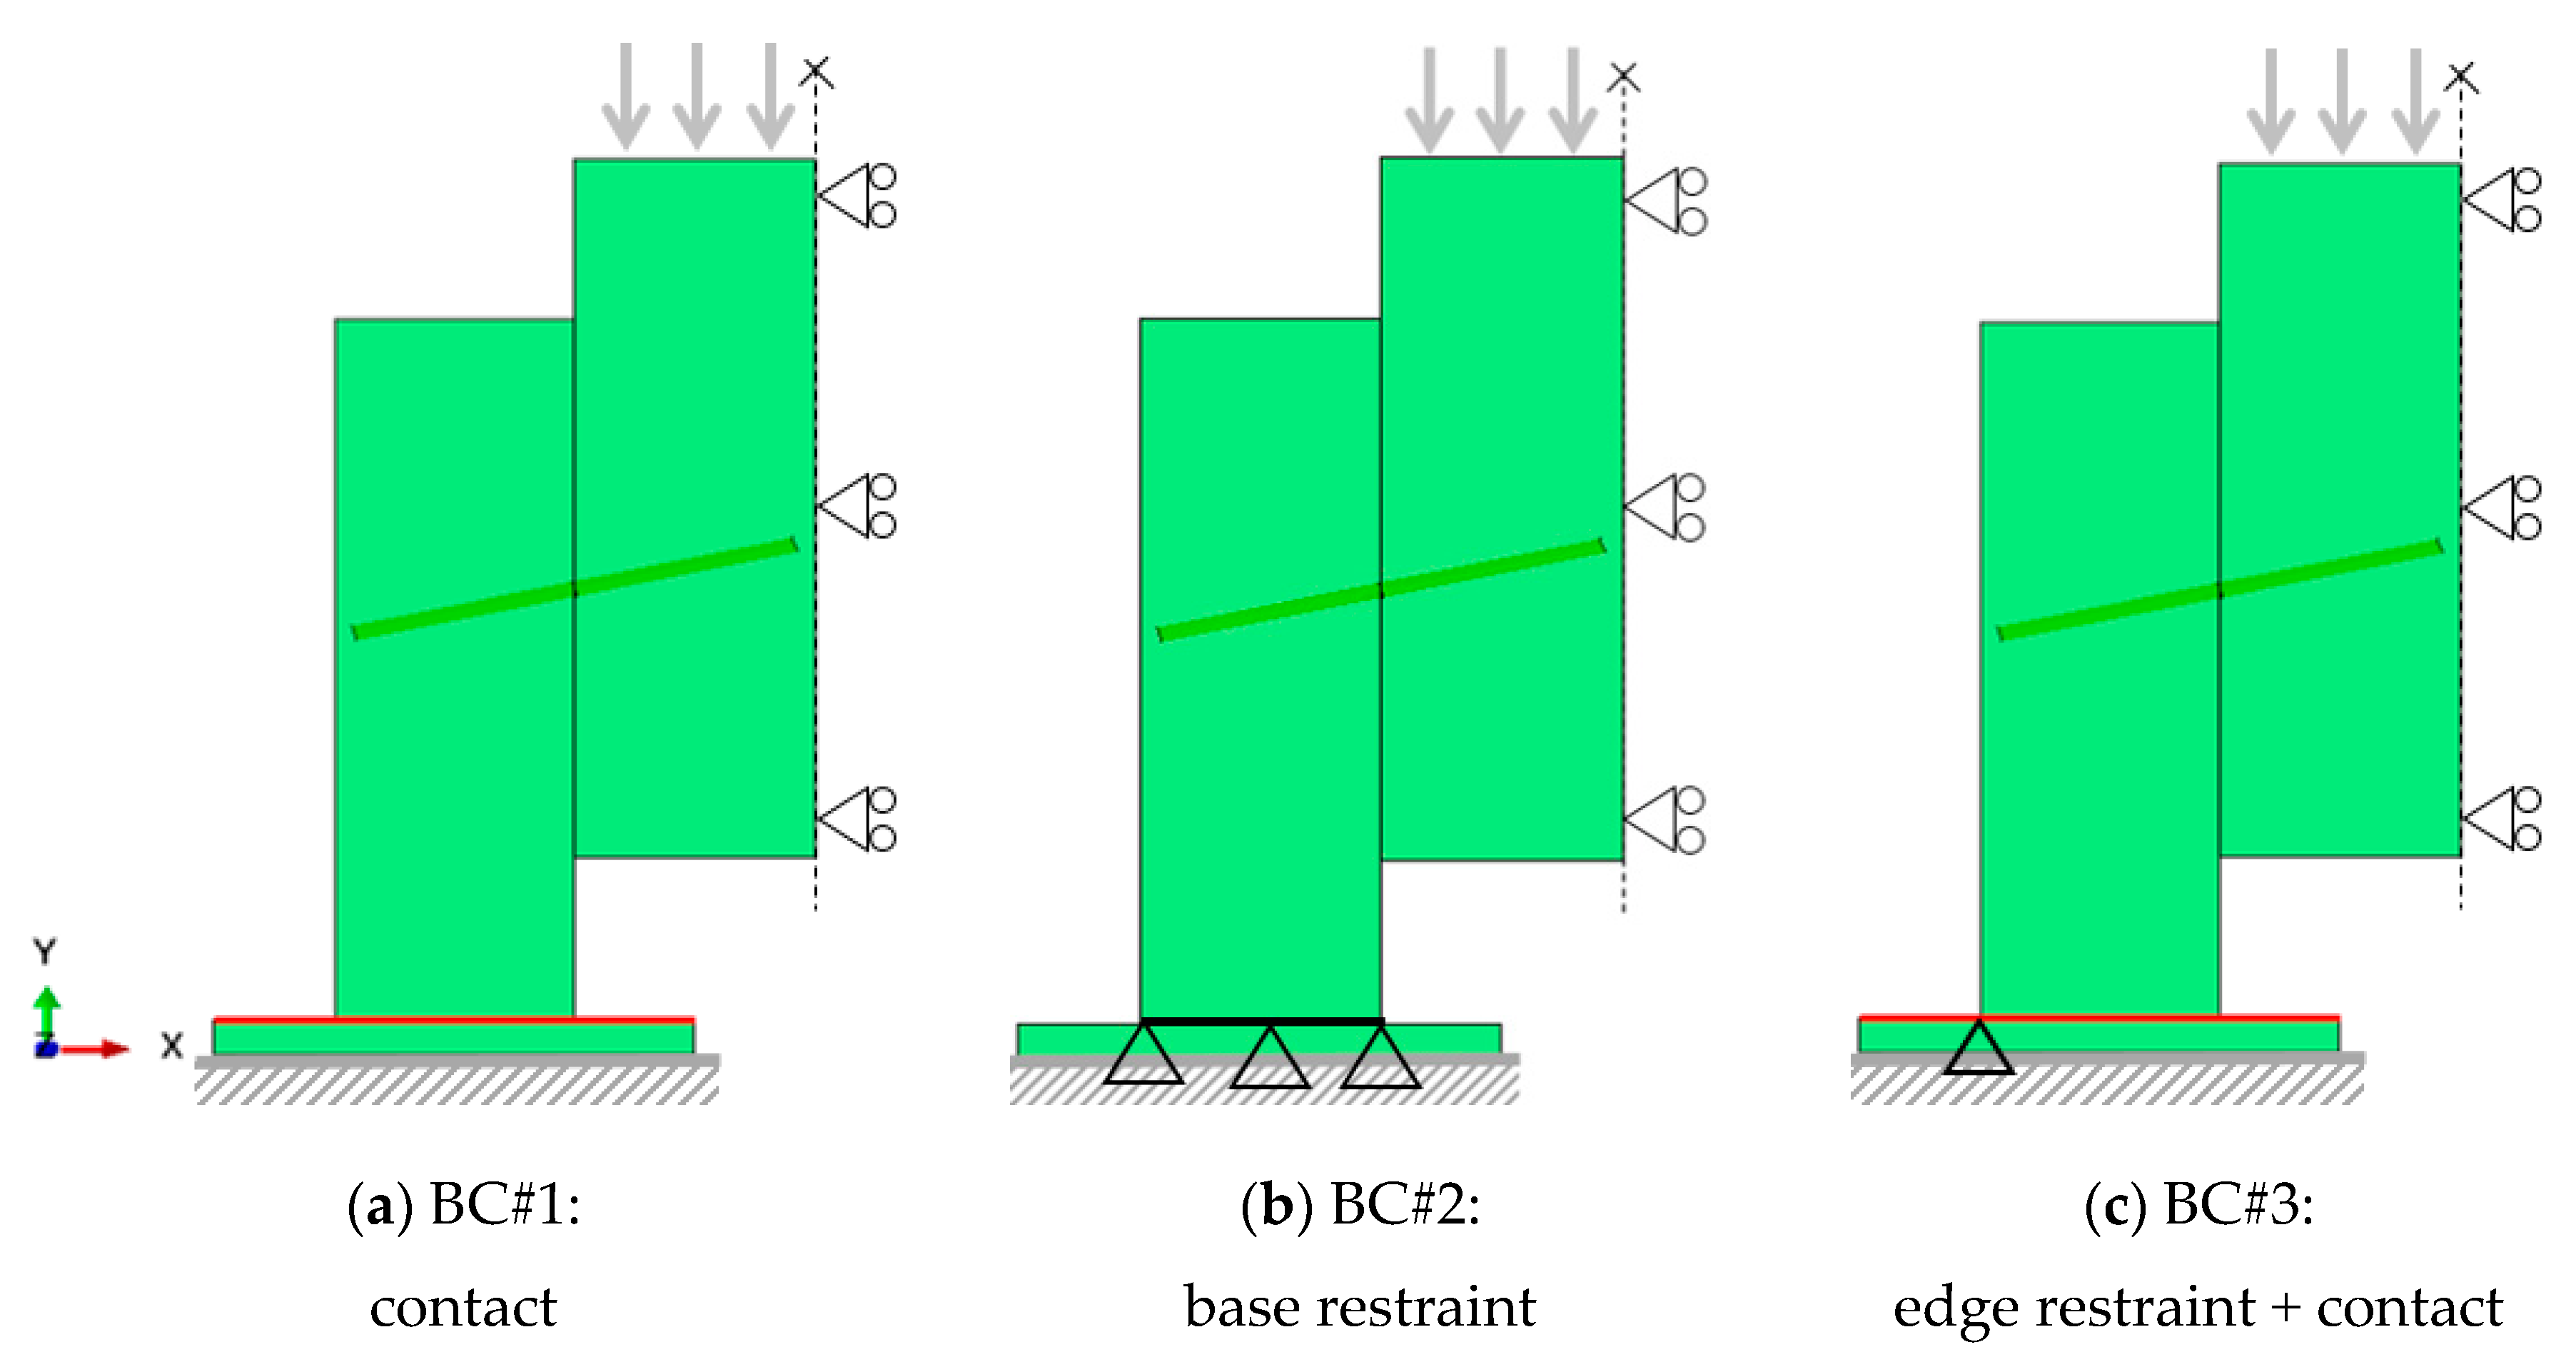
The actual boundary condition of timber members (and in particular the base restraint of the lateral members for the PO setup in Figure 3) represents, in the same way of mechanical interactions, a relevant influencing parameter for the examined joints. In this paper, three different boundary conditions are thus taken into account for the typical TTC specimen, including:
- BC#2: a distributed, rigid restraint at the base of the lateral timber members (Figure 17b); and
- BC#3: a mixed restraint, as obtained with a surface contact interaction between the timber member and the rigid base (to avoid possible compenetration) and an additional linear simply support (external edge of the timber member, see Figure 17c).
The BC#1 model, in this sense, coincides with the reference modelling strategy described in Section 3 and validated in Section 4. Variations for the BC#2 and BC#3 models are then represented by the restraint detailing only, with identical material properties and contact formulations.
In Figure 18, selected FE results are proposed for a given joint under different boundary conditions. According to Section 6.2, no relevant variations were observed for the elastic stage of the collected force-slip curves of Figure 18a, as well as for most of the examined joint configurations. However, depending on the arrangement of STSs in use, variations in the vertical reaction force were numerically predicted with up to a +30% increase of the BC#1 value, for the BC#2 and BC#3 conditions.
In addition, major variations were observed especially in terms of reaction forces in the horizontal direction for the BC#2 restraint, due to the use of unreliable boundary conditions for the standard PO setup (see Figure 18b).
6.3. Friction Coefficient
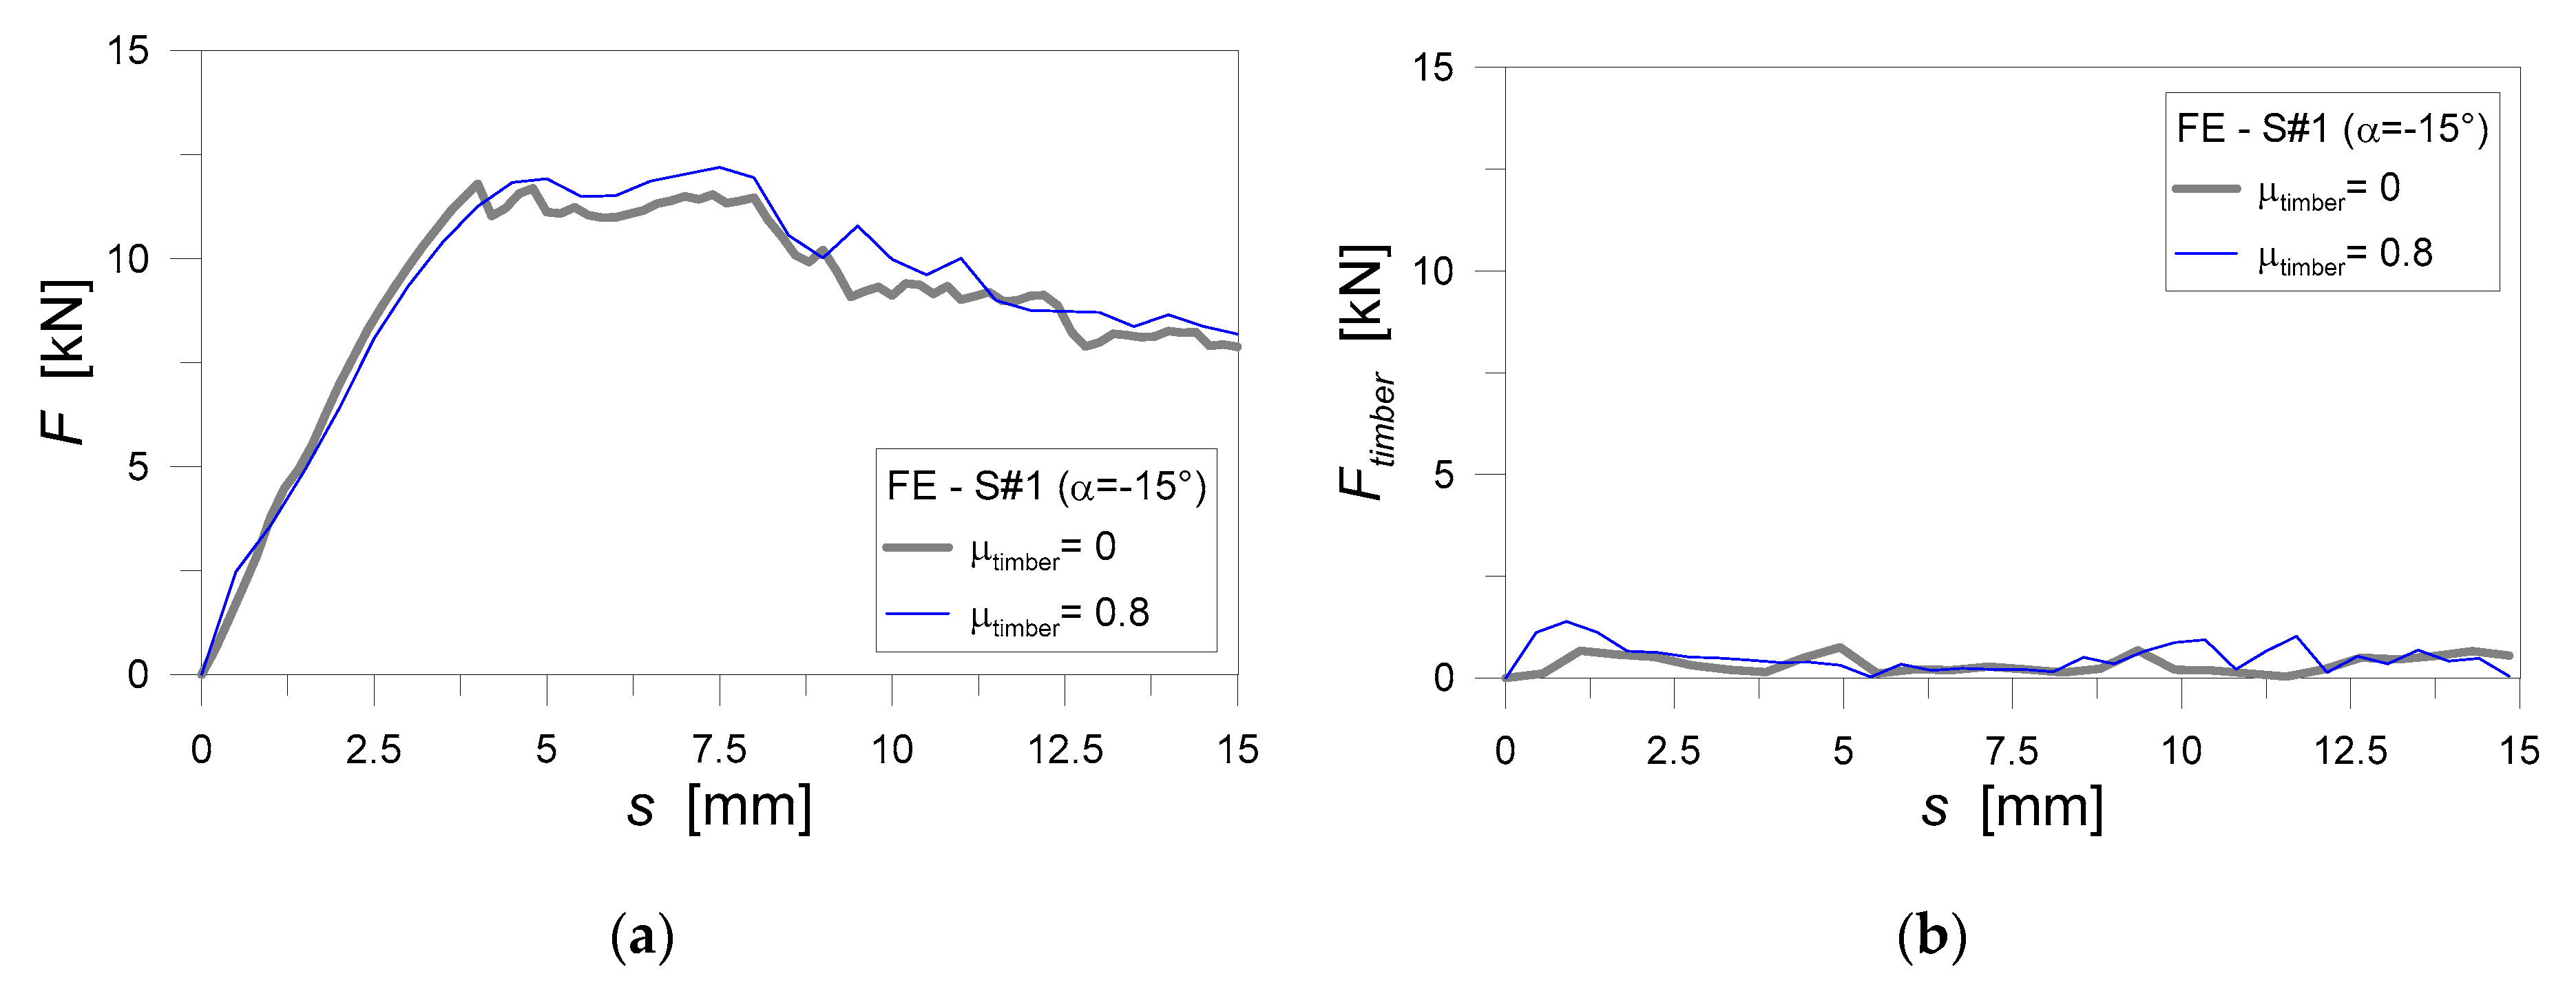
At a final stage of this concise sensitivity study, the effects of friction phenomena are explored, with a particular attention for the timber-to-timber interface (Figure 6a). To this aim, the reference FE models in Section 3 are still taken into account, while the static friction coefficient for the mechanical contacts in use are progressively modified. According to [5], it is in fact known that friction at the timber interfaces should be considered for screws subjected to shear-tension stresses only (i.e., TTC joints with positive inclination α for the STSs, based on the convention of this paper). On the other side, any friction mechanism should be disregarded for STSs under shear-compression stresses (STSs with negative α). In this case, the central and lateral timber members of the PO setup are in fact expected to separate from each other, and thus enabling the development of possible attritive interactions.
Following Figure 7 and Equation (2), the force contributions are thus separately analyzed in this paper, for the examined TTC joints. For comparative purposes, more in detail, the input value for μtimber is progressively modified in the range from 0 and 0.8.
As expected, major variations of μtimber for TTC joints with an imposed shear-compression stress regime (α < 0) were found to have negligible effects on the collected force-slip contributions, given that:
with:
Figure 19 presents an example of the so-measured force-slip curves, with a focus on the S#1 joint with α = −15°. As shown in Figure 19a, minimum variations can be observed in the collected curves, even in presence of marked modifications for μtimber. Regarding the force contribution Ftimber sustained by the timber members, see Figure 19b, this is estimated as a limited part of the total F, thus agreeing with Equations (6) and (7).
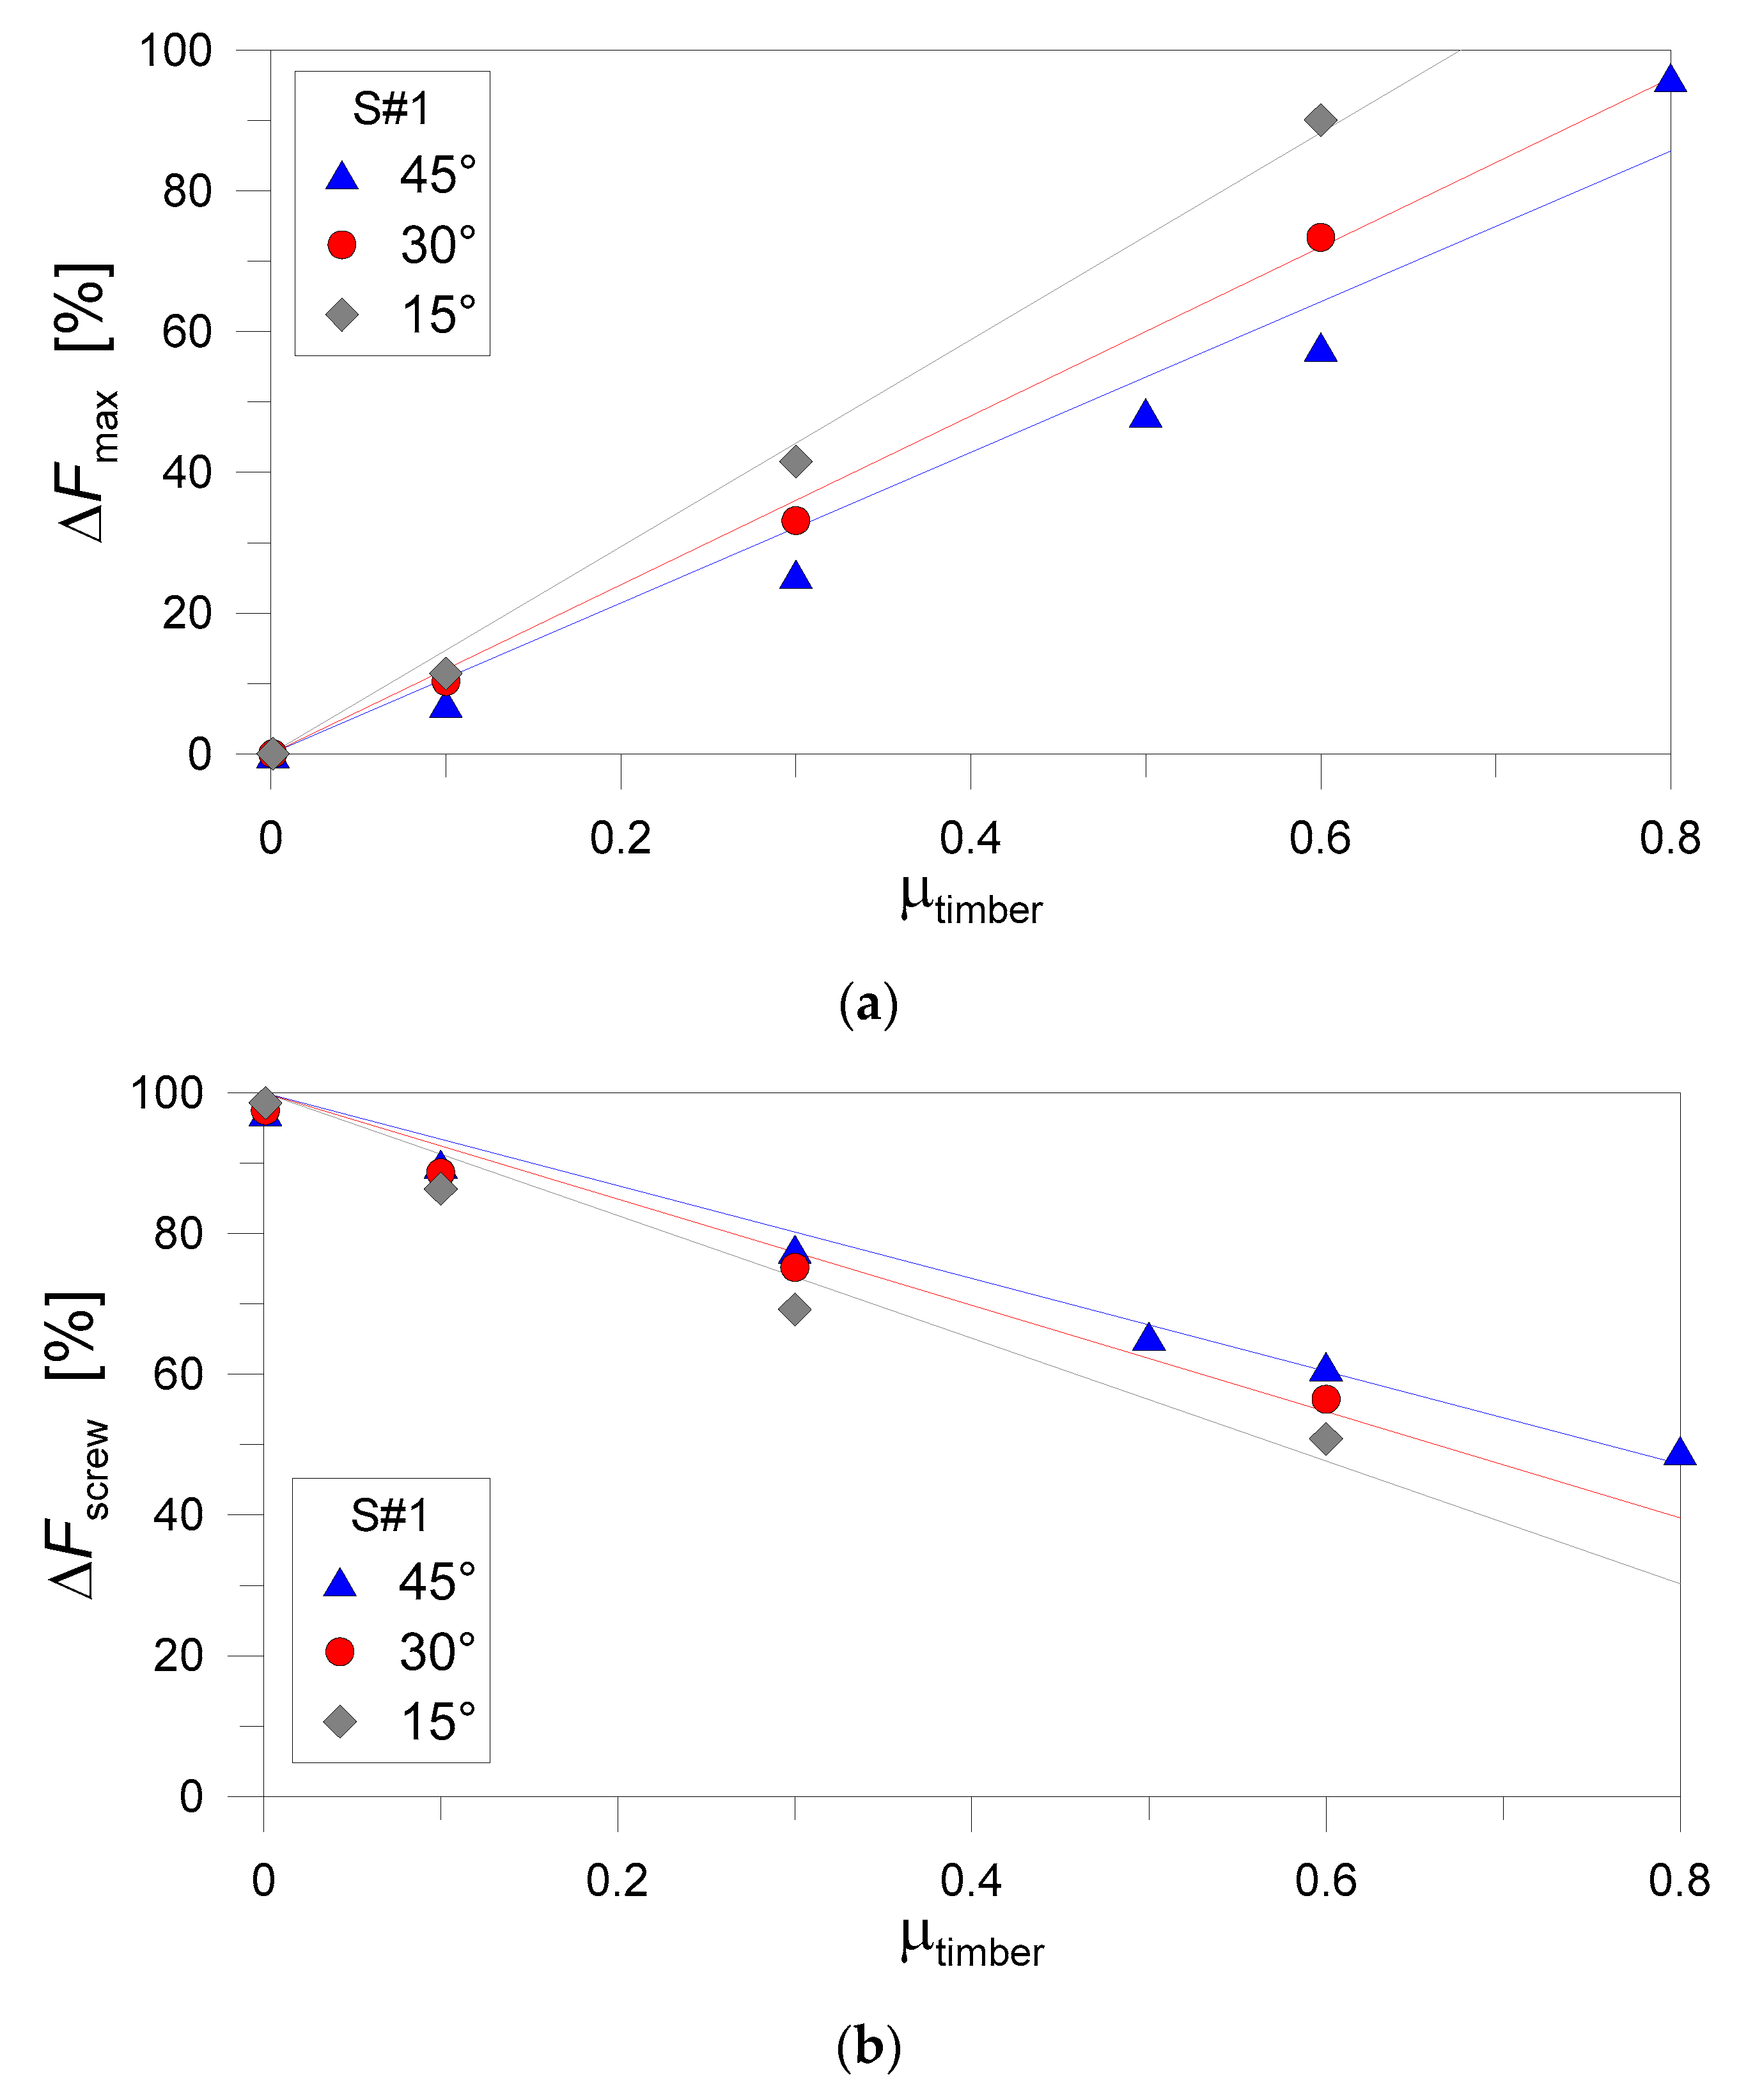
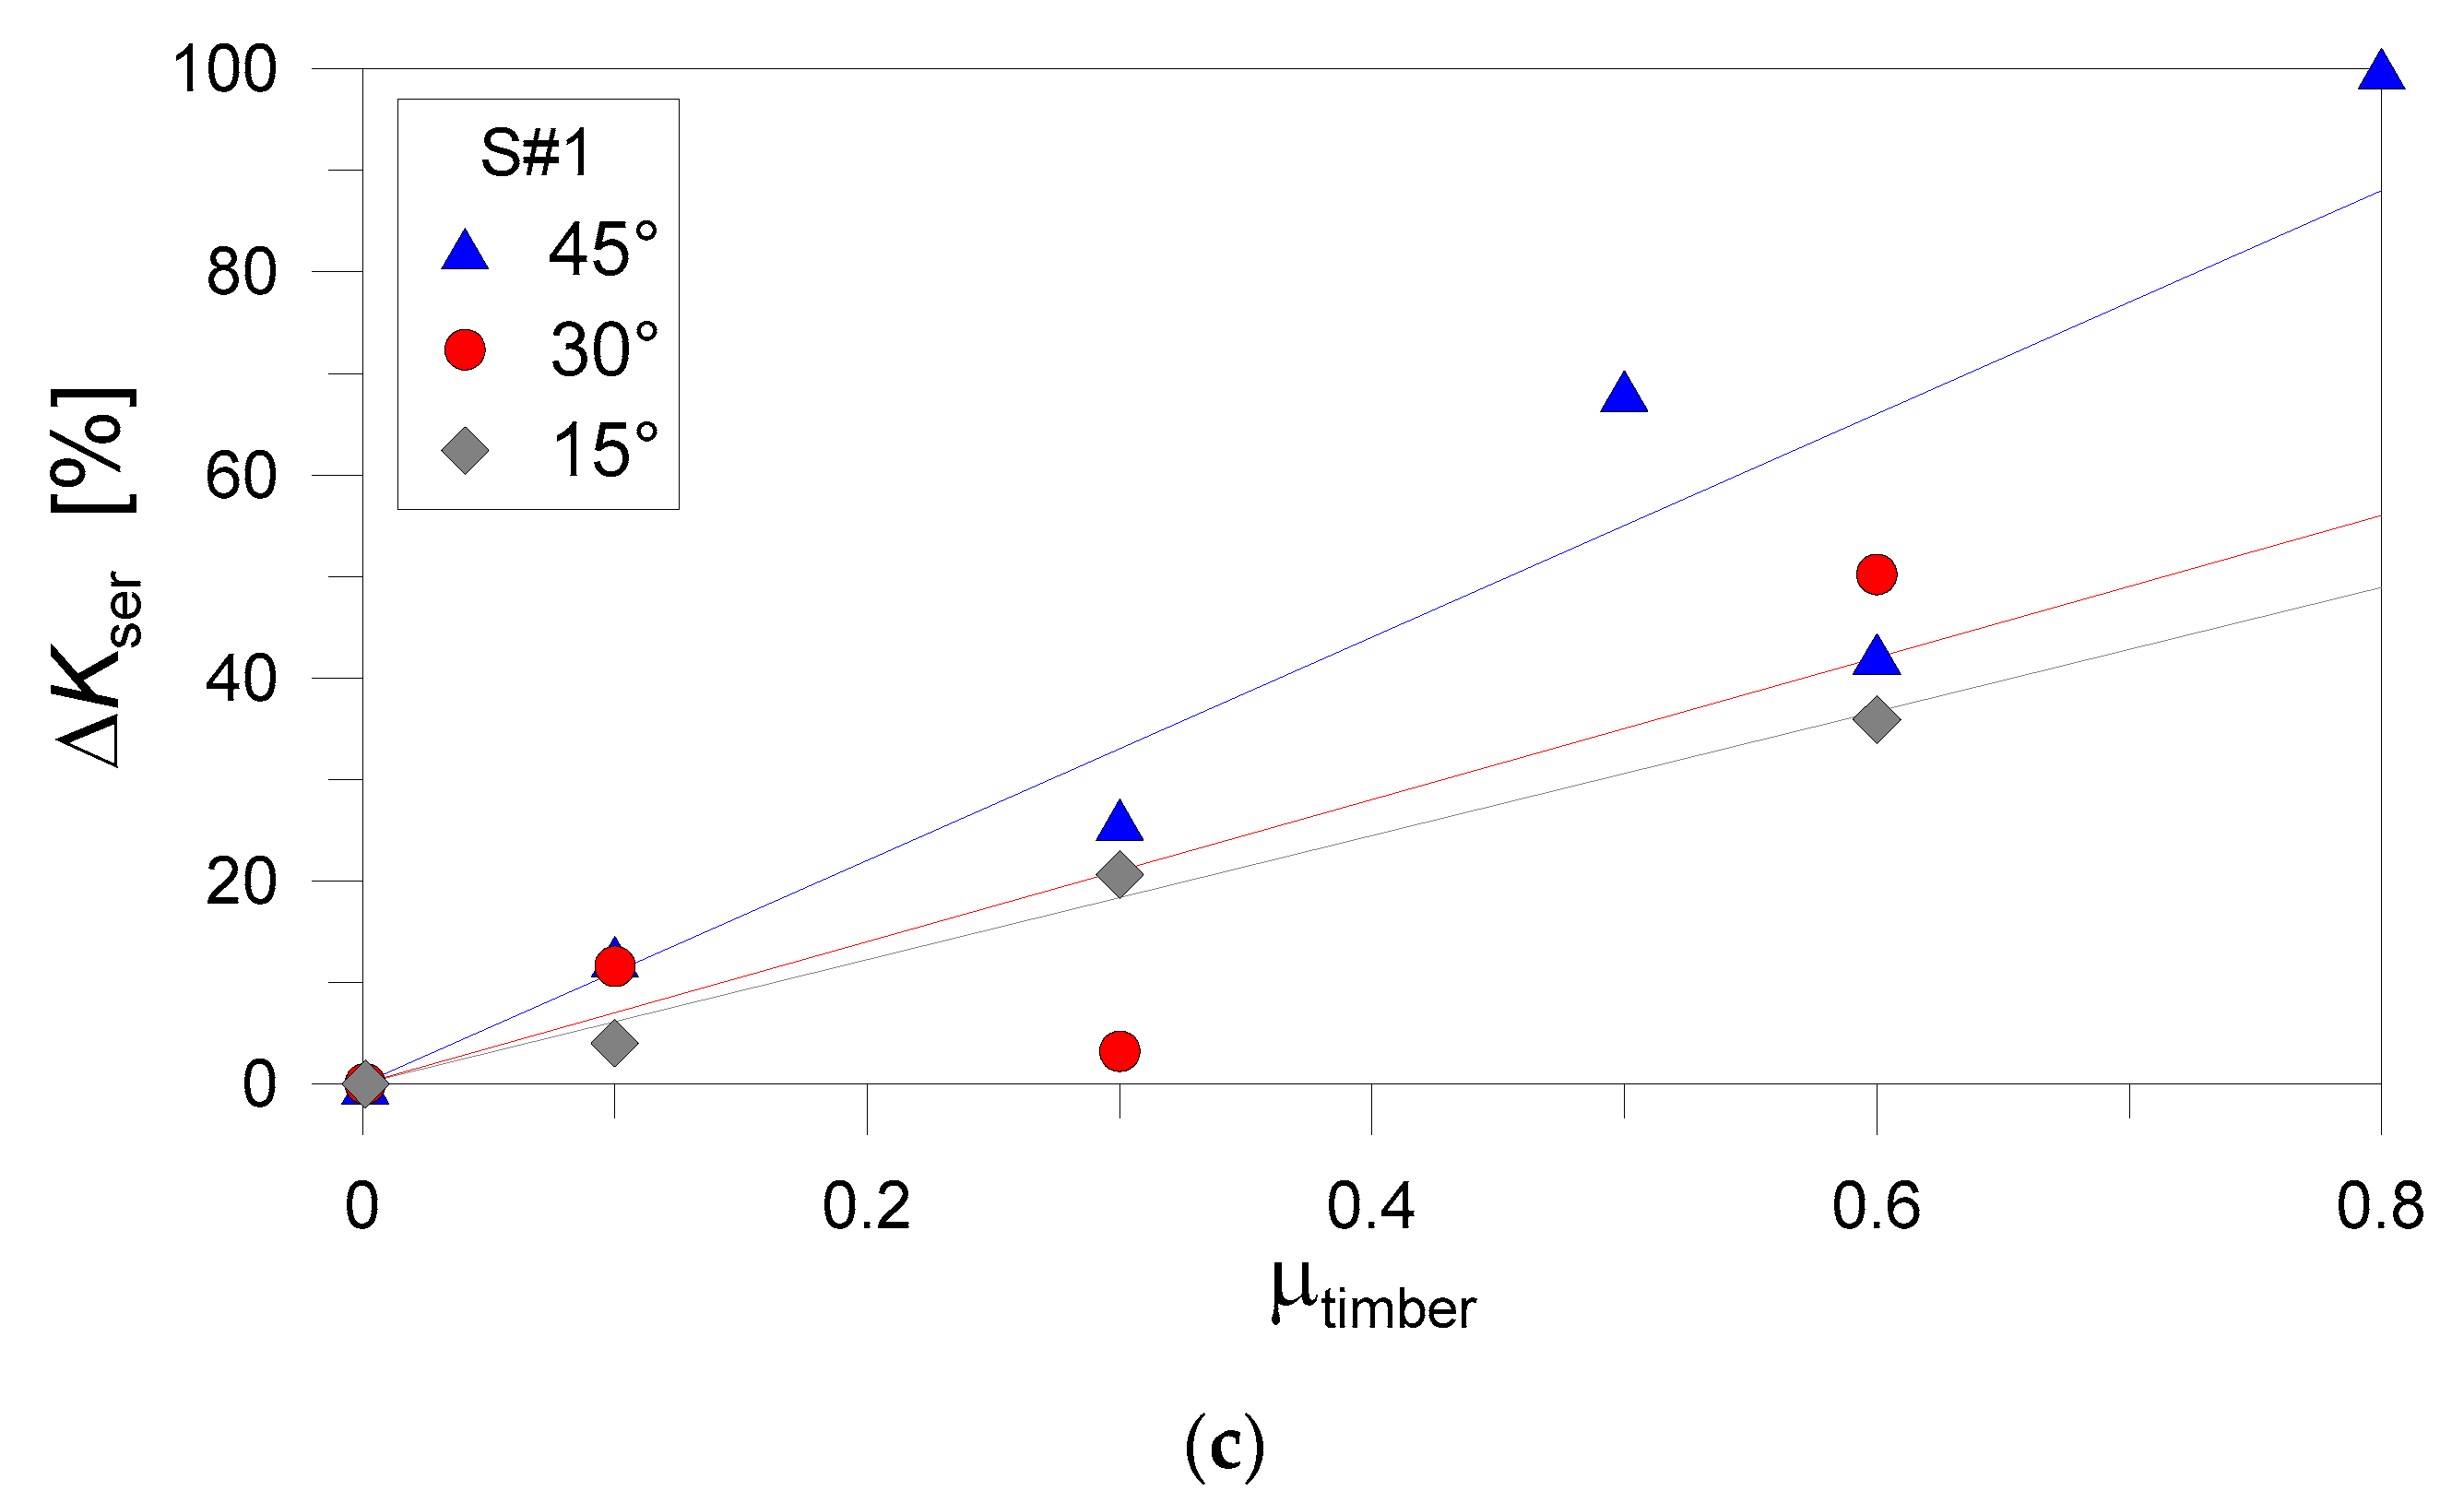
In order to further investigate such an effect for different screw arrangements, finally, the FE parametric study (with μtimber = 0) was extended to several TTC joints under shar-compressive stresses. In Figure 20, comparative numerical results are proposed for the S#1 specimens as a function of μtimber. The parametric numerical results were post-processed from the collected force-slip curves according to Figure 8. As far as the relevant mechanical parameters are taken into account for them, their trend with μtimber can be investigated.
Figure 20, more in detail, shows the percentage variation Δ given by Equation (5), in terms of:
- ultimate total force Fmax for a TTC given joint, as a function of μtimber;
- shear force contribution Fscrew taken up by the STSs only, as a function of μtimber.
- and serviceability stiffness Kser (calculated in accordance with Equation (4)), as a function of μtimber.
For clarity of presentation, the FE models with μtimber = 0 are set as a reference condition for Δ calculations.
Regarding the total ultimate resistance Fmax of S#1 joints in Figure 20a) for example, it is possible to see that Fmax progressively increases as far as μtimber increases, for a given α. A relatively regular trend can be observed for the collected FE dots, as also suggested by the linear fitting curves. At the same time, however, it is possible to see that the increase of is indirectly proportional to α, thus maximum benefits deriving from additional frictional phenomena can be expected for STSs with limited inclination α only (α = 15°, in this study).
Such an outcome is strictly related to the occurrence, at failure, of local damage mechanisms in timber that can be further magnified especially for high α values (see also Section 4). As far as the typical static friction coefficients of interest for TTC systems are taken into account (i.e., μtimber ≈ 0.25–0.5), moreover, it is interesting to notice that the predicted Fmax values show a mean + 20–30% variation for STSs joints under shear-compression loads. This result from Figure 20a is thus a further confirmation of the relatively high sensitivity of ultimate resistance predictions for the examined TTC joints, under a standard PO setup.
When the shear force contribution that is sustained by the STSs only is taken into account, see Figure 20c, the same order of percentage variation is observed for various α values. In the figure, in particular, ΔFscrew = 100% coincides with Fmax for the whole TTC specimen when μtimber = 0. Otherwise, the progressive increase of frictional effects with μtimber lead to a mostly linear increase of the total resistance Fmax in Figure 20a. As a result of such a kind of phenomenon, the load-bearing contribution of the STSs (in percentage terms) progressively decreases with μtimber, with variations that can be expected up to −20% compared to frictionless TTC joints (Figure 20b).
Finally, when the serviceability stiffness Kser is taken into account in Figure 20c, an opposite trend can be noticed for the collected FE results, as a function of and μtimber. This is in line with the general expectations and past literature efforts on the topic, where the serviceability stiffness of a given TTC joint reasonably increases when increasing the inclination α of the STSs. As a further remark for the FE results in Figure 20c, it can be noticed a relatively scattered variation of Kser estimates with μtimber, as far as α increases (i.e., Figure 14).
7. Conclusions
In this paper, the structural performance of timber-to-timber composite (TTC) joints with inclined self-tapping screws (STSs) was numerically investigated. The finite element (FE) numerical modelling assumptions were validated towards past experimental results of literature, by taking into account different arrangement and features for the STSs joints, including serviceability stiffness and ultimate resistance comparisons with analytical methods of literature. Through the FE parametric investigation, as shown, a key role was assigned to timber material properties but especially interface damage contacts in the region of fasteners. Major advantage was taken from the use of a surface-based cohesive zone modelling (CZM) damage interaction, so as to capture possible local effects and damage mechanisms in the examined TTC joint components.
For the examined small-scale TTC specimens under a standard push-out (PO) setup, in particular, an average scatter of −25% or +10% was generally observed for the load-bearing estimations in shear-compression and shear-tension respectively. Major deviations of FE models from the literature tests were mainly observed for the TTC specimens characterized by the presence of STSs with high inclination α (±40° or ±45°, in the current study), hence suggesting possible numerical issues due to mostly local effects, as well as possible uncertainties on the material properties and on the idealized description of the reference PO test setup.
On the other side, the collected FE estimations were always found to offer enhanced predictions for various STSs arrangements, compared to analytical models of literature. The ultimate resistance values, in particular, were generally strongly underestimated by analytical calculations, for various inclinations of STSs.
Based on extended parametric FE calculations, the actual sensitivity of PO numerical predictions to a series of relevant input parameters (and in particular the CZM damage parameters, the actual boundary condition of timber members and the effect of friction phenomena) was further emphasized. In doing so, major advantage was taken from the analysis of resultant forces that are expected to be sustained (through the whole PO monotonic loading stage) by the steel screws or by timber components. The reciprocal mechanical interaction of the involved load-bearing members was thus explored.
Author Contributions
This paper results from a joint collaboration of all the involved authors. C.B.: conceptualization, analysis, validation, draft preparation, review; M.S. and M.F.: investigation, draft preparation, review. All authors have read and agreed to the published version of the manuscript.
Funding
This research received no external funding.
Conflicts of Interest
The authors declare no conflict of interest.
References
- Johansen, K.W. Theory of timber connections. International association of bridge and structural engineering. Bern 1949, 9, 249–262. [Google Scholar]
- Blaß, H.J.; Bejtka, I.; Uibel, Y. Tragfähigkeit von Verbindungen mit Selbstbohrenden Holzschrauben Mit Vollgewinde; Karlsruher Berichte zum Ingenieurholzbau; KIT Scientific Publishing: Karlsruhe, Germany, 2006; Volume 4. [Google Scholar]
- Hansen, K. Mechanical properties of self-tapping screws and nails in wood. Can. J. Civ. Eng. 2002, 29, 725–733. [Google Scholar] [CrossRef]
- Ringhofer, A.; Brandner, R.; Schickhofer, G. A universal approach for withdrawal properties of self-tapping screws in solid timber and laminated timber products. In Proceedings of the 2nd International Network on Timber Engineering Research (INTER 2015), Sibenik, Croatia, 24–27 August 2015. paper INTER/48-7-1 (USB Drive). [Google Scholar]
- EN 1995-1-1. Design of Timber Structures-Part 1-1: General-Common Rules and Rules for Buildings; European Committee for Standardization (CEN): Brussels, Belgium, 1995. [Google Scholar]
- Tomasi, R.; Crosatti, A.; Piazza, M. Theoretical and experimental analysis of timber-to-timber joints connected with inclined screws. Constr. Build. Mater. 2010, 24, 1560–1571. [Google Scholar] [CrossRef]
- Girhammar, U.A.; Jacquier, N.; Källsner, B. Stiffness model for inclined screws in shear-tension mode in timber-to-timber joints. Eng. Struct. 2017, 136, 580–595. [Google Scholar] [CrossRef]
- Giongo, I.; Piazza, M.; Tomasi, R. Out of plane refurbishment techniques of existing timber floors by means of timber to timber composite structures. In Proceedings of the WCTE 2012-World Conference on Timber Engineering, Auckland, New Zealand, 16–19 July 2012. [Google Scholar]
- Giongo, I.; Piazza, M.; Tomasi, R. Cambering of timber composite beams by means of screw fasteners. J. Herit. Conserv. 2012, 32, 133–136. [Google Scholar]
- Opazo, A.; Bustos, C. Study of the lateral strength of timber joints with inclined self-tapping screws. In Proceedings of the 51st International Convention of Society of Wood Science and Technology, Concepcion, Chile, 10–12 November 2008. paper WS-39 (USB Drive). [Google Scholar]
- Ringhofer, A.; Schickhofer, G. Investigations concerning the force distribution along axially loaded Self-Tapping Screws. In Materials and Joints in Timber Structures; Aicher, S., Reinhardt, H.W., Garrecht, H., Eds.; RILEM Bookseries; Springer: Dordrecht, The Netherlands, 2015; Volume 9. [Google Scholar]
- Hossain, A.; Popovski, M.; Tannert, T. Cross-laminated timber connections assembled with a combination of screws in withdrawal and screws in shear. Eng. Struct. 2018, 168, 1–11. [Google Scholar] [CrossRef]
- Berardinucci, B.; di Nino, S.; Gregori, A.; Fragiacomo, M. Mechanical behavior of timber-concrete connections with inclined screws. Int. J. Comput. Methods Exp. Meas. Spec. Issue Timber Struct. 2017, 5, 807–820. [Google Scholar] [CrossRef] [Green Version]
- Symons, D.; Persaud, R.; Stanislaus, H. Slip modulus of inclined screws in timber-concrete floors. Struct. Build. 2010, 163, 245–255. [Google Scholar] [CrossRef]
- Jacquier, N.; Girhammar, U.A. Evaluation of bending tests on composite glulam-CLT beams connected with double-sided punched metal plates and inclined screws. Constr. Build. Mater. 2015, 95, 762–773. [Google Scholar] [CrossRef]
- Schiro, G.; Giongo, I.; Sebastian, W.; Riccadonna, D.; Piazza, M. Testing of timber-to-timber screw-connections in hybrid configurations. Constr. Build. Mater. 2018, 171, 170–186. [Google Scholar] [CrossRef]
- Silva, C.; Branco, J.M.; Ringhofer, A.; Lourenco, P.B.; Schickhofer, G. The influence of moisture content variation, number and width of gaps on the withdrawal resistance of Self Tapping Screws inserted in Cross Laminated Timber. Constr. Build. Mater. 2016, 125, 1205–1215. [Google Scholar] [CrossRef] [Green Version]
- ABAQUS Computer Software; v.6.14, Simulia; Dassault Systemes: Providence, RI, USA, 2020.
- ABAQUS Documentation and Uses’ Guide; v.6.14, Simulia; Dassault Systemes: Providence, RI, USA, 2020.
- Avez, C.; Descamps, T.; Serrano, E.; Léoskool, L. Finite Element modelling of inclined screwed timber to timber connections with a large gap between the elements. Eur. J. Wood Wood Prod. 2016, 74, 467–471. [Google Scholar] [CrossRef] [Green Version]
- Bedon, C.; Fragiacomo, M. Numerical analysis of timber-to-timber joints and composite beams with inclined self-tapping screws. Compos. Struct. 2019, 207, 13–28. [Google Scholar] [CrossRef]
- EN 12512:2001. Timber Structures-Test Methods-Cyclic Testing of Joints Made with Mechanical Fasteners; European Committee for Standardization (CEN): Brussels, Belgium, 2001. [Google Scholar]
- EN 26891:1991. Joints Made with Mechanical Fasteners-General Principles for the Determination of Strength and Deformation Characteristics; European Committee for Standardization (CEN): Brussels, Belgium, 1991. [Google Scholar]
- EN 338:2003. Structural Timber-Strength Classes; European Committee for Standardization (CEN): Brussels, Belgium, 2003. [Google Scholar]
- EN 1194:1999. Timber Structures-Glued Laminated Timber-Strength Classes and Determination of Characteristic Values; European Committee for Standardization (CEN): Brussels, Belgium, 1999. [Google Scholar]
- ETA-11/0190. Würth Self-Tapping Screws-Self-Tapping Screws for Use in Timber Constructions; European Organization for Technical Approvals (EOTA): Brussels, Belgium, 2016. [Google Scholar]
- Rothoblaas-WT Double thread connector-Technical Data Sheet. Available online: https://www.rothoblaas.com/products/fastening/screws (accessed on 22 February 2020).
- Murase, Y. Friction of wood sliding on various materials. J. Fac. Agric. Kyushu Univ. 1984, 28, 147–160. [Google Scholar]
Figure 1.
Available tools for the mechanical characterization and analysis of design parameters of timber-to-timber composite joints.
Figure 1.
Available tools for the mechanical characterization and analysis of design parameters of timber-to-timber composite joints.

Figure 2.
Conventional experimental procedure for the mechanical characterization of TTC joints with inclined STSs.
Figure 2.
Conventional experimental procedure for the mechanical characterization of TTC joints with inclined STSs.

Figure 3.
TTC joints with inclined STSs under a standard PO setup. (a)–(c): selected configurations and (d) nominal dimensions (in mm).
Figure 3.
TTC joints with inclined STSs under a standard PO setup. (a)–(c): selected configurations and (d) nominal dimensions (in mm).

Figure 4.
Reference FE numerical model for TTC joints with inclined STSs under a standard PO setup (S#1, α = −15°).
Figure 4.
Reference FE numerical model for TTC joints with inclined STSs under a standard PO setup (S#1, α = −15°).

Figure 5.
Example of (a) typical FE assembly (1/4th the S#1 geometry, with = −15°) and (b) detail of the STS region (ABAQUS/Explicit, hidden mesh pattern). Reproduced from [21] with permission from Elsevier®, Copyright license number 4895820420991, August 2020.
Figure 5.
Example of (a) typical FE assembly (1/4th the S#1 geometry, with = −15°) and (b) detail of the STS region (ABAQUS/Explicit, hidden mesh pattern). Reproduced from [21] with permission from Elsevier®, Copyright license number 4895820420991, August 2020.

Figure 6.
FE modelling TTC joints with inclined STSs under a standard PO setup. In evidence, the mechanical contact interactions for: (a) timber-to-timber, (b) base support and (c,d) STS details (hidden mesh pattern), with (e) traction-separation law.
Figure 6.
FE modelling TTC joints with inclined STSs under a standard PO setup. In evidence, the mechanical contact interactions for: (a) timber-to-timber, (b) base support and (c,d) STS details (hidden mesh pattern), with (e) traction-separation law.

Figure 7.
Monitored force contributions for the mechanical analysis and characterization of TTC joints with inclined STSs under a standard PO setup.
Figure 7.
Monitored force contributions for the mechanical analysis and characterization of TTC joints with inclined STSs under a standard PO setup.

Figure 8.
Force-slip curves of selected TTC joints with inclined STSs under a standard PO setup (ABAQUS/Explicit, S#1, α = var) and corresponding experimental results (data from [6]).
Figure 8.
Force-slip curves of selected TTC joints with inclined STSs under a standard PO setup (ABAQUS/Explicit, S#1, α = var) and corresponding experimental results (data from [6]).

Figure 9.
Typical damage propagation in the selected TTC joints with inclined STSs, under a standard PO setup (ABAQUS/Explicit). Example for the S#1 specimen with α = −15°, with evidence of: (a) local damage of timber (stress values in Pa), (b) yielding of screws (stress values in Pa) and (c) CZM damage parameter. Reproduced from [21] with permission from Elsevier®, Copyright license number 4895820420991, August 2020.

Figure 10.
Comparison of numerical (ABAQUS/Explicit) and experimental [6] maximum force estimates for TTC joints with inclined STSs: (a) S#1, (b) S#2, (c) S#3 and (d) S#4 joints.
Figure 10.
Comparison of numerical (ABAQUS/Explicit) and experimental [6] maximum force estimates for TTC joints with inclined STSs: (a) S#1, (b) S#2, (c) S#3 and (d) S#4 joints.

Figure 11.
Percentage scatter of maximum force values for TTC joints with inclined STSs (Equation (5)), as obtained from the FE numerical analyses (ABAQUS/Explicit) and by the experiments in [6].
Figure 11.
Percentage scatter of maximum force values for TTC joints with inclined STSs (Equation (5)), as obtained from the FE numerical analyses (ABAQUS/Explicit) and by the experiments in [6].

Figure 12.
Comparison of numerical (ABAQUS/Explicit) and analytical (Eurocode 5 [5] or Tomasi et al. [6]) maximum force estimates for TTC joints with inclined STSs: (a) S#1, (b) S#2, (c) S#3 and (d) S#4 joints.


Figure 13.
Percentage scatter of maximum force values for TTC joints with inclined STSs (Equation (5)), as obtained from the FE numerical analyses (ABAQUS/Explicit) and by literature analytical models: (a) Eurocode 5 [5] and (b) Tomasi et al. [6].

Figure 14.
Comparison of numerical (ABAQUS/Explicit) and analytical [6] serviceability stiffness estimates for TTC joints with inclined STSs: (a) S#1-to-S#3 (average) or (b) S#4 joints.
Figure 14.
Comparison of numerical (ABAQUS/Explicit) and analytical [6] serviceability stiffness estimates for TTC joints with inclined STSs: (a) S#1-to-S#3 (average) or (b) S#4 joints.

Figure 15.
Percentage scatter of stiffness values for TTC joints with inclined STSs (Equation (5)), as obtained from the FE numerical analyses (ABAQUS/Explicit) and by literature [6]: (a) experimental data, (b) single stiffness analytical model, (c) double stiffness analytical model.
Figure 15.
Percentage scatter of stiffness values for TTC joints with inclined STSs (Equation (5)), as obtained from the FE numerical analyses (ABAQUS/Explicit) and by literature [6]: (a) experimental data, (b) single stiffness analytical model, (c) double stiffness analytical model.

Figure 16.
Analysis of mechanical interaction and CZM effects on the PO numerical response of TTC joints with inclined STSs (S#1). Vertical (F) and horizontal (H) reaction forces as a function of slip, for (a,b) α= −15° and (c,d) α= 45° (ABAQUS/Explicit).
Figure 16.
Analysis of mechanical interaction and CZM effects on the PO numerical response of TTC joints with inclined STSs (S#1). Vertical (F) and horizontal (H) reaction forces as a function of slip, for (a,b) α= −15° and (c,d) α= 45° (ABAQUS/Explicit).


Figure 17.
Analysis of boundary condition effects on the PO performance of TTC joints.

Figure 18.
Analysis of boundary effects on the PO numerical response of TTC joints with inclined STSs. In evidence, the (a) vertical and (b) horizontal base reaction force, as a function of the measured slip for a selected TTC joint (ABAQUS/Explicit).
Figure 18.
Analysis of boundary effects on the PO numerical response of TTC joints with inclined STSs. In evidence, the (a) vertical and (b) horizontal base reaction force, as a function of the measured slip for a selected TTC joint (ABAQUS/Explicit).

Figure 19.
Analysis of static friction effects on the PO numerical response of TTC joints with inclined STSs. In evidence, the (a) vertical and (b) horizontal base reaction force, as a function of the measured slip (ABAQUS/Explicit).
Figure 19.
Analysis of static friction effects on the PO numerical response of TTC joints with inclined STSs. In evidence, the (a) vertical and (b) horizontal base reaction force, as a function of the measured slip (ABAQUS/Explicit).

Figure 20.
Percentage variation (Equation (4)) of performance indicators for TTC joints with inclined STSs, as a function of the timber-to-timber friction coefficient (S#1 joints under shear-compression): (a) maximum force; (b) load-bearing contribution of the STSs and (c) serviceability stiffness (ABAQUS/Explicit).


Table 1.
Input mechanical properties for GL24h strength class timber (ABAQUS/Explicit).
| Elastic Moduli (Mean Values, in MPa) | Parallel to the grain E┴ | 11600 |
| Perpendicular to the grain E║ | 390 | |
| Radial E | 390 | |
| Longitudinal shear modulus G | 690 | |
| Resistance (Mean Values, in MPa) | Compression parallel to the grain fc,0 | 37.5 |
| Compression perpendicular to the grain fc,90 | 3.57 | |
| Shear fv | 3.85 | |
| Failure (Mean Values) | Maximum stress fc,90 (MPa) | 5 |
| Damage evolution | Linear | |
| Failure displacement δu (mm) | 4 |
Table 2.
Input mechanical properties for the soft layer and for the CZM contact interaction (ABAQUS/Explicit).
Table 2.
Input mechanical properties for the soft layer and for the CZM contact interaction (ABAQUS/Explicit).
| Soft Layer | Elastic moduli (mean values) | Longitudinal (screw axis) | MPa | 370 |
| Tangential | MPa | 370 | ||
| Shear | MPa | 720 | ||
| Radial | MPa | 50 | ||
| Failure | Maximum shear (MPa) | MPa | 5 | |
| Damage evolution | - | Linear | ||
| Failure displacement δu (mm) | Mm | 4 | ||
| CZM Contact Interaction | Resistance (mean values) | Longitudinal | MPa | 37.55 |
| Transverse | MPa | 3.85 | ||
| Shear | MPa | 3.85 | ||
| Rolling shear | MPa | 3.5 |
© 2020 by the authors. Licensee MDPI, Basel, Switzerland. This article is an open access article distributed under the terms and conditions of the Creative Commons Attribution (CC BY) license (http://creativecommons.org/licenses/by/4.0/).
Share and Cite
MDPI and ACS Style
Bedon, C.; Sciomenta, M.; Fragiacomo, M. Mechanical Characterization of Timber-to-Timber Composite (TTC) Joints with Self-Tapping Screws in a Standard Push-Out Setup. Appl. Sci. 2020, 10, 6534. https://doi.org/10.3390/app10186534
AMA Style
Bedon C, Sciomenta M, Fragiacomo M. Mechanical Characterization of Timber-to-Timber Composite (TTC) Joints with Self-Tapping Screws in a Standard Push-Out Setup. Applied Sciences. 2020; 10(18):6534. https://doi.org/10.3390/app10186534
Chicago/Turabian StyleBedon, Chiara, Martina Sciomenta, and Massimo Fragiacomo. 2020. "Mechanical Characterization of Timber-to-Timber Composite (TTC) Joints with Self-Tapping Screws in a Standard Push-Out Setup" Applied Sciences 10, no. 18: 6534. https://doi.org/10.3390/app10186534
Note that from the first issue of 2016, this journal uses article numbers instead of page numbers. See further details here.