
Review and Prospects for Autonomous Observing Systems in Vessels of Opportunity


1
Centre for Marine Technology and Ocean Engineering (CENTEC), Instituto Superior Técnico, University of Lisbon, 1049-001 Lisboa, Portugal
2
Portuguese Institute for the Ocean and Atmosphere (IPMA), 1495-165 Lisboa, Portugal
3
Centre of Marine Sciences (CCMAR), University of Algarve, 8005-139 Faro, Portugal
*
Author to whom correspondence should be addressed.
J. Mar. Sci. Eng. 2021, 9(4), 366; https://doi.org/10.3390/jmse9040366
Submission received: 23 February 2021
/
Revised: 22 March 2021
/
Accepted: 25 March 2021
/
Published: 30 March 2021
(This article belongs to the Special Issue Marine Measurements: Theory, Methods and Applications)
Abstract
:This paper focuses on the state of the art on Autonomous Observing Systems (AOS) used in Vessels of Opportunity (VOO) for collecting in situ atmospheric, oceanic and biogeochemical data. The designation Vessels of Opportunity includes all kinds of ships, even if not having scientific goals, which may carry proper devices that autonomously measure environmental variables. These vessels can be merchant, military, research, cruise liners, fishing, ferries, or even private yachts or sailing boats. The use of AOS can provide the opportunity for highly refined oceanographic data and improved derived data estimation, for local, regional or global scales studies. However, making the collected information accessible, both for scientific and technical purposes, provides a challenge in data management and analysis, which must, above all, ensure trusted useful data to the stakeholders. An overall review of the systems implemented is presented. This includes the definition of objectives, the recruitment of vessels and a review on the installation of proper acquisition devices; the selection and collection of Essential Oceanic Variables (EOV); the mechanisms for transmitting the information, and the quality control analysis and dissemination of data. The present and future capabilities of VOO for measuring EOV, within the Portuguese context are referred.
1. Introduction
The primary step to ocean understanding is quantitative observations and measurements. Even if today, remote sensing and numerical modelling play important roles in oceanic studies, in situ data acquisition remains the foundation of ocean monitoring systems, being still irreplaceable. Satellite remote sensing observation programmes only return information from the surface layers of the ocean, leaving about 98.8% of the ocean volume unobservable [1] and numerical models are a main source of derived and predicted data. Both of these approaches require in situ data for calibration, initialization, validation or assimilation. Surface and deeper ocean in situ observations are indispensable to understand the ocean dynamics, support ocean science, assessment, forecasting, services and management in the context of sustainable development.
Oceans are vast, and oceanographic cruises carried out by research vessels are heavily high cost, so they only cover very localized areas during very limited periods. Ocean processes are highly variable and require continuous monitoring with proper resolution in space and time. Thus, there are increasing demands for reliable and cost-effective ocean observations with high density in space and time [1]. The use of Vessels of Opportunity (VOO) for making long term sustainable scientific measurements, arises as a complementary alternative. It turns out that research vessels provide versatile sampling platforms, and many operate in inhospitable waters, providing data from outsider commercial shipping lanes; however, sampling from these research vessels usually suffers from lack of regularity and limited sampling at certain locations, and can be subject to large seasonal biases, with large latitudes rarely visited during winter months. On the other hand, commercial vessels tend to cross the ocean along traditional routes, thus repeating observations in spatially limited regions of the ocean [2] but in long time scales. At the same time, fishing vessels ply coastal seas at all times of the year and in almost all weather conditions. VOO can be merchant and research, cruise liners, fishing, ferries, military, sailing or private yachts, and can provide scientific data, for local, regional or global scale studies, but also information on maritime conditions, allowing the establishment of safer routes for maritime activities.
Data types sampled by VOO include, among others, the Essential Climate Variables (ECV), defined by Global Climate Observing System (GCOS: https://gcos.wmo.int/en/essential-climate-variables) and Essential Ocean Variables (EOV), established after the OceanObs’09 meeting, held in Venice in September 2009, which led to the publication of the Framework for Ocean Observing (FOO) [3]. This document provides guidance towards an integrated system of ocean observation and became the strategic framework of Global Ocean Observing Systems (GOOS) in 2015 [1].
The implementation of observing systems on VOO can be a complex process, involving a considerable number of procedures: the system requires the recruitment of vessels, the proper installation of acquisition devices, collecting and transmission of data, calibration, validation and maintenance, and above all, data processing and analyses to make them useful information for the users’ community. While recognizing the great importance of ships for manual deploying of atmosphere and oceanic observing technology (e.g., balloon soundings, expendable bathythermographs, drifter, gliders), the desirable observing system on VOO requires the least possible human intervention, measuring the ocean properties through totally autonomous instruments. In addition, the desirable involvement of more VOO in the observing programmes implies identifying more cost-effective solutions, since ocean and meteorological data acquisition instruments are significantly high cost.
The focus herein relies on the development and implementation of an integrated system capable of producing usable data. A first overview of the main global networks and institutions operating VOO is mentioned in Section 2 and Section 3. Section 4 refer to the Portuguese case, being presented the activities developed within an ongoing project, coordinated by IPMA (Portuguese Institute for the Ocean and Atmosphere), in partnership with CENTEC (Centre for Marine Technology and Ocean Engineering, University of Lisbon) for the establishment of Autonomous Observing Systems (AOS) prototype to be used in VOO. The system described is cost effective and involves the use of a FerryBox system type developed in Portugal, as well as meteorological and waves parameters measuring devices. Finally in Section 5, are discussed potentialities and future developments of the AOS system, and in Appendix A is provided a table with the acronyms and abbreviations used in the text.
The main objectives of this paper are (1) to show the importance of autonomous observation systems (AOS) installed on board VOO, on the acquisition of atmospheric, oceanic and biogeochemical data for local, regional or global scales studies; and (2) to present the first phase in the development of a Portuguese AOS to be installed on fishing and cargo vessels to measure regularly in the Portuguese seas.
2. VOO International Initiatives Overview
2.1. World Programmes
Observations made by sea-going ships, reported from ship logbooks, extend back to hundreds of years, many of them largely pre-instrumental. Most of these early observations, which included winds, waves, atmospheric pressure or even sea temperature, were made to support navigation day-by-day operations [2]. The idea to encourage routine measurements and share all collected observations at the international level, emerged in the 19th century with Maury, who convened the first international Maritime Conference at Brussels in 1853. That meeting recommended a set of international observing and reporting practices for keeping “Abstract Logs” of ship’s meteorological observations [4].
Nowadays, ships can play a significant role in oceanic, atmospheric and biogeochemical observations and several international or national organizations emerged by taking responsibility for programmes aimed at concentrating, standardizing and making available the information collected by VOO. The International Comprehensive Ocean-Atmosphere Data Set (ICOADS) hosted by the U.S. National Oceanic and Atmospheric Administration (NOAA) is probability one of the most extensive freely available archive of global surface marine data, with over 455 million individual marine reportseach containing the observations and metadata reported from a given ship, buoy, coastal platform or oceanographic instrument. ICOADS surface marine observational records, prior to the 1980s, are almost entirely based on ship observations with records for some parameters dating back to approximately 1750 [5]. One part of the ocean-observing community that sustains global-scale observing is strongly linked to and supports the information needed for climate studies and, as such, they form an important component of the Global Climate and Global Ocean Observing Systems (GCOS and GOOS), established in 1990, and co-sponsored by the World Meteorological Organization (WMO) and the Intergovernmental Oceanographic Commission (IOC) of the United Nations Educational, Scientific and Cultural Organization (UNESCO), both under the umbrella of the United Nations (UN). Within GOOS (https://www.goosocean.org/), several regional coalitions of nations and/or institutions representing local areas with different and specific priorities, were established. These are called the GOOS Regional Alliances (GRAs), which are expected to share and apply GOOS principles and goals at scales such as regional and coastal seas. The European Global Ocean Observation System (EuroGOOS), created in 1994, is the branch of GOOS in Europe.
The Joint Technical Commission for Oceanography and Marine Meteorology (JCOMM) was created in the late nineteens, co-sponsored by WMO and IOC. It established the JCOMM in situ Observing Platform Support Centre (JCOMMOPS), which nowadays is responsible for the programs such as the Voluntary Observing Ships (VOS) and Ships of Opportunity Program (SOOP). Observations from ships complement observations from other marine networks like Argo floats, drifting buoys and moorings [2].
A brief insight of the main initiatives that use VOO for making long-term scientific measurements is referred in next topics. These include large world and European projects, but also some examples of national and local succeeded initiatives around the globe, addressing both scientific and operational goals.
2.2. GOSUD Project
The Global Ocean Surface Underway Data (GOSUD) project (http://www.gosud.org) was established in 2001, and is an initiative of the International Oceanographic Data and Information Exchange (IODE—https://www.iode.org) of the IOC programme. The main goal of this project is to assemble in situ observations of the world ocean surface, collected by ships as they traverse their ocean routes. Currently, GOSUD data are surface salinity and temperature. They are provided by volunteer contributors who are willing to build freely accessible global datasets, promote standard methodologies and agree on a common data policy. The observations are collected from different categories of platforms such as research vessels, merchant ships but also sailing ships or cruise vessels, from several countries (e.g., France, Japan, USA). The datasets provided by the GOSUD contributors are collected and assembled in the Coriolis database (www.coriolis.eu.org). Coriolis is a component of the French and European operational oceanography programmes, which articulates with Mercator Ocean International and Copernicus Marine Service (https://www.copernicus.eu/). The GOSUD server provides access to the real-time and delayed mode data through a web selection tool or by file transfer protocol (FTP), ensuring the long-term archive of the datasets. Among others, the GOSUD database receives a major contribution from the French Sea Surface Salinity Observation Service (SSS-OS-http://www.legos.obs-mip.fr/observations/sss), which is an ongoing initiative representing, in that database, 30% of the daily sea surface salinity observations collected in real-time, and 80% in delayed time [6]. GOSUD data also contribute to ICOADS.
2.3. SAMOS Project
Since 2005, the Shipboard Automated Meteorological and Oceanographic System (SAMOS) initiative (https://samos.coaps.fsu.edu/html) has been collecting, quality-evaluating, distributing and archiving underway navigational (ship’s position, course, speed and heading), meteorological (winds, air temperature, pressure, moisture, rainfall and radiation) and oceanographic (sea temperature and salinity) observations from research vessels and VOO. The SAMOS data center, is hosted by the Marine Data Center (MDC) at the Florida State University (FSU) [7]. Data from SAMOS also are part of ICOADS. Among others, the SAMOS project developed a close partnership with the GOSUD initiative, concerning data quality evaluation. Other partnerships include JCOMM and VOS.
2.4. EU FerryBox Project
From 2003 to 2005, the European funded project FerryBox (http://www.ferrrybox.org) with partners across Europe, was initiated to further develop and optimize the use of the so-called FerryBox systems for automated measurements and water sampling, using VOO, such as merchant vessels and ferries [8]. Nowadays, the FerryBox project continues through the EuroGOOS FerryBox Task Team, which is one of seven EuroGOOS Task Teams operational networks of observing platforms promoting collaboration among European ocean observing infrastructures. After completion of the European funded FerryBox project in 2005, most of the FerryBox operators continued their monitoring activities mainly funded by research money of the institutes, reflecting the attractiveness of ferry-based measurements for research as well as for monitoring programs [8]. Some examples of ongoing operating FerryBox systems can be referred: (i) the Helmholtz-Zentrum Geesthacht, Germany (HZG) operates FerryBox systems mainly aboard cargo ships cruising the North Sea, on similar and regular routes. HZG develops FerryBox systems under the project COSYNA (Coastal Observing System for Northern and Artic Seas—www.hzg.de/institutes_platforms/cosyna/index.php.en); (ii) FerryBox lines are operated aboard car ferries by the French institutions IFREMER (Brest) and CNRS (through the Station Biologique Roscoff) since 2010 and 2011, respectively, monitoring standard parameters (T,S, turbidity, chlorophyll-a fluorescence, oxygen) but also variability of CO2 and algae species distribution; (iii) in the eastern Mediterranean Sea, the Hellenic Centre for Marine Research (HCMR) in Greece, within the POSEIDON observatory research infrastructure (https://poseidon-new.hcmr.gr), operates a daily FerryBox line in the route between Herakleion and Piraeus; and (iv) in the Baltic Sea several institutions are involved in ferry-based monitoring programmes crossing this region. Forerunner was the Finnish Marine Institute (Marine Research Centre at the Finnish Environment Institute-SYKE) who started, in the beginning of the 1990s, with a ship-based system on a ferry between Helsinki and Tallin and expanded to the entire Baltic Sea with a continuously operated FerryBox on the route between Helsinki and Travemünde [8].
Jointly Task Team members make available European ocean data to the EuroGOOS Regional Operational Oceanographic System (ROOS) data portals across all European maritime regions, which in turn feed data to the European Marine Observation and Data Network (EMODnet—https://www.emodnet.eu) and Copernicus Marine Service. In Europe, FerryBox output is now part of the vision of EMODnet Network for the gathering of data streams together into a pan European system for assimilating data into marine management cycle [9].
2.5. JERICO
Towards a Joint European Research Infrastructure network for Coastal Observatories (JERICO-https://www.jerico-ri.eu/) is an ocean observing system of systems, designed to provide physical, chemical and biological data characterizing the coastal waters of Europe [10]. The JERICO project was the first European wide effort towards the harmonization and coordination of the major coastal observing platforms such as FerryBox, gliders and coastal fixed platforms, building upon existing regional networks in Europe, including the EuroGOOS. Actually, within JERICO-NEXT, it has been decided to build up a common FerryBox database and data portal in order to make the FerryBox data more available and visible. Furthermore, this database will function as a close link to the Copernicus Marine Service and the EMODnet portal. The technical harmonization, as well as the developing of best practice guides for FerryBox systems, within JERICO-NEXT, have been a step further to high quality environmental data products [10].
2.6. Other Initiatives: Examples around the World
Besides the ones mentioned previously, the examples referred next demonstrate the increasing involvement of people using VOO, for getting in situ data and reduce gaps in the global observing network systems.
- CPR: The Continuous Plankton Recorder (CPR) Survey (https://www.cprsurvey.org): CPR was invented in 1925–1927 and the survey established in 1931 by Sir Alister Hardy. Over many decades, it has collected biogeography and ecology of plankton data and associated metadata across basin scales, using VOO. The CPR is usually towed from the stern of volunteer merchant ships such as RoRo and Container Ships. However, the CPR has also been deployed from large sailing vessels, fishing boats and super tankers. Today, the CPR Survey is operated by the Marine Biological Association (UK), but a Global Alliance of CPR Surveys was founded in 2011, involving partners from Europe, North and South America, Asia and Australia.
- PMEL Carbon Program: The Pacific Marine Environmental Laboratory (PMEL), within the designated Carbon Program (https://www.pmel.noaa.gov/co2), manages a network of surface underway carbon dioxide observations using VOO. This program was initiated in 1992 as part of the GOOS and uses container ships transiting across Pacific Ocean and NOAA research ships along the west American coast for measuring partial pressure of CO2 (pCO2), temperature and salinity. The PMEL Carbon Program is coordinated at an international level, by the International Ocean Carbon Coordination Project (IOCCP—http://www.ioccp.org/).
- Oleander Project: Within this project, continuous shipboard ADCP measurements have been used to investigate the variability of the Gulf Stream (http://www.po.gso.uri.edu/rafos/research/ole/). The project is an inter-institutional program and has support from SOOP. It provides oceanographic data such as ocean currents, Sea Surface Temperature (SST), Sea Surface Salinity (SSS) and surface CO2 in a region between New Jersey and Bermuda.
- International SeaKeepers Society:Aaround the world, non-profit organizations like the International SeaKeepers Society support marine science. International Seekeepers uses privately owned yachts as platforms for oceanographic research, educational outreach and marine conservation. It focuses on ocean issues in cooperation with governmental agencies, other like-minded organizations, the academic community and the public (https://www.seakeepers.org/).
- FerryMon project (http://paerllab.web.unc.edu/projects/ferrymon/): The Ferry Monitoring project is a local project that monitors Neuse River Estuary in North Carolina (USA), measuring water quality indicators, human and climate drivers of water quality variability [11]. FerryMon uses North Carolina Department of Transportation (NCDOT) ferries to provide continuous, space-time intensive, accurate measurements of chl-a and other key water quality criteria, using sensors placed in a flow-through system and discrete sampling of nutrients, organics, diagnostic photopigment and molecular indicators of major algal groups in a near real-time manner.
- STRATOGEM program: Under the umbrella of this program (www.stratogem.ubc.ca), observations of chlorophyll-a biomass from an instrumented ferry have been used to determine how the Fraser River plume affects phytoplankton biomass in the Strait of Georgia [12]. These data are part of Ocean Networks Canada (https://www.oceannetworks.ca/).
- RECOPESCA: In 2005, the RECOPESCA project implemented by IFREMER put on fishing gears, used by a sample of voluntary fishing vessels, diverse sensors to measure fishing effort, temperature, salinity and turbidity [13]. The equipment was self-powered and able to automatically send the data to a receiver on board and after to land [14].
- Alaska Ocean Observing System (AOOS-https://aoos.org/): This is another example of a collaborative partnership, between several Alaska and U.S. Federal organizations, including Indigenous People, industrial and Non-Governmental Organizations. AOOS is part of the U.S. Integrated Ocean Observing System (US IOOS), which is one of the Regional Associations of Coastal Ocean Observing Systems established for North America. The Alaska State ferry system serves as a platform for ocean acidification research on its weekly run between Washington State and Alaska. Instruments installed on these vessels are recording CO2, as well as seawater temperature, salinity and dissolved oxygen.
- IMOS Ships of Opportunity (SOOP) Facility: This is managed by Australia’s Integrated Marine Observing System (IMOS) enabled by the National Collaborative Research Infrastructure Strategy (NCRIS). It is operated by a consortium of institutions with the University of Tasmania as Lead Agent. It monitors physical, biogeochemical and fish parameters (http://imos.org.au/facilities/shipsofopportunity/).
- The OceanoScientific® Programme: Under this programme, small vessels use the OceanoScientific® System (OSC System) which is equipment developed for the automatic acquisition and satellite transmission of several scientific parameters at sea. Methods and data formats used follow the recommendations and standards of UN agencies related to climate change and operational oceanography/meteorology, in particular JCOMM’s Ships Observation Team (WMO/IOC-UNESCO) [15].
- Tara Ocean Foundation expeditions (https://oceans.taraexpeditions.org/en/) are an example of the use of sailing vessels for data acquisition. The Tara schooner is a floating laboratory that already made 4 major expeditions, since 2006, in several oceans and seas (e.g., Artic, Mediterranean, Pacific and a global ocean expedition). The equipment used included flowcams, CTDs, flowcytobots, Underwater Video Profiler (UVP), plankton nets and many other instruments.
- FOS—Fishery Observing System: In support of the National Research Council of Italy, (CNR) has been undertaking scientific and technological activities aimed at implementing intelligent and automated systems for the collection of data in support of oceanography and fisheries science, as well as providing services for fishing operators. Two independent operational units autonomously developed two original devices, the Italian Fishery Observing System (FOS) and the Information and Communications Technology kit (ICT-kit), recently converging towards a new modular system named the Fishery and Oceanography Observing System (FOOS). VOO was equipped with this system to collect data regarding catches, fishing operation position, depth and temperature during the hauls [16], mainly in the Strait of Sicily and the Adriatic Sea.
- TRANSMED and PartnerSHIPS programmes: These are programs conducted by CIESM (International Commission for Scientific Exploration of the Mediterranean Sea). The aim of the PartnerSHIPS project was the development of a network of VOO for automated monitoring of the surface waters of the Mediterranean. They use the TRANSMED system (www.ifremer.fr/transmed/) to measure the physical and biogeochemical parameters of the Mediterranean (temperature, salinity, oxygen and pCO2, chlorophyll, etc.). This system was installed aboard merchant vessels servicing routes in Mediterranean. Data are integrated in Coriolis and GOSUD databases.
- Sailing vessels as VOO: Sailing expedition vessels and ocean racing yachts can deploy autonomous instruments (drifters and floats) in sea areas with very limited or no other shipping routes (e.g., Arctic and Antarctic waters) but could also directly gather ocean-atmosphere data with innovative underway instrumentation [2]. Several round the-world races such as Volvo Ocean Race (https://www.volvooceanrace.com/en/news/10225_What-is-the-Science-Programme.html), and Barcelona World Race [17], among others, now comprise corresponding science projects.
Being aware that the examples referred are just a small fraction of the many regional, national or local initiatives around the world, they give an overall overview about different type of underway projects, using VOO. Table 1 summarizes the referred programmes.
The main limitations of the VOO are the spatial coverage that is limited to the routes of the vessels and that the measurements are mainly done at the surface. Another big challenge is related to its continuity which is needed to provide optimal regular data acquisition. Often this activity is based on project funds and the end of them may imply also the end of some of these initiatives, as vessels operators and owners are not supposed to contribute financially to the maintenance of the system. One solution to overcome this situation could be the development of methodologies for vessel operators to provide data, using instrumentation purchased, deployed and retrieved within a crowd-sourced approach [2].
3. VOO Data Types and Users
Potential users of information acquired by VOO cover wide areas of interest. Marine data are used directly and indirectly by a large community to address operational, commercial and scientific needs. User requirements differ on the type of data needed, but also in the type of sampling, way of collection and transmission. Data users can also be distinguished between those who use real-time data and the ones using delayed-mode information [2]. These creates different levels of needs, with different quality data evaluation and data management that should be well defined a priori within the goals of each VOO acquisition data programme. In addition, since the costs involved in collecting ocean data are high, the optimization of VOO observing systems must consider the multidisciplinary and different interests of community and users involved and, whenever possible, should be designed to measure as many variables as possible. Data collected by VOO in adverse weather conditions may be less than desirable, as ships, for reasons of safety and comfort, tend to avoid navigation under such conditions. Vessel changes in their usual routes, may introduce gaps in the expected data acquisition. The VOO data scarcity during adverse weather conditions may be a limiting factor in the use of VOO data for research of extreme atmosphere and ocean events.
Table 2 presents the Essential Ocean Variables (EOV) defined by GOOS, which intend the coverage of the main aspects for describing the ocean variability.
The GOOS Expert Panels developed individual specification sheets for each variable, which, among others, contain the variable definitions, as well as information on the required settings, including temporal and spatial scales of the phenomenon addressed to the variables, sensors and techniques of observations.
The main data VOO users’ communities are referred in the next sub-sections.
3.1. Navigation, Safety and Weather Forecasting Communities
The knowledge of sea state (e.g., waves) and maritime meteorology are essential in navigation and, for centuries, observations by seafarers have contributed to improve meteorological predictions, helping define safer routes for vessels. Nowadays, many vessels are equipped with meteorological instruments, but most use them for particular monitoring purposes. The challenge is to equip a selection of VOO with calibrated measuring instruments and devices that can provide quality data, for real-time and operational forecasting institutions. Real-time VOO observations can be used to validate operational models and near-term forecasts. Numerical weather prediction and operational forecasting supporting data include, among others, the near surface ships observations: surface wind intensity and direction; surface pressure; relative humidity; air temperature; SST SSS, and wave height, direction and period.
3.2. Oceanographic Process and Climate Studies Communities
Vessel-based observations serve a wide community of scientists that monitor the marine environment and study the oceanographic physical processes including those that govern the interactions between the ocean and atmosphere, the ocean acidification and those that influence the plankton biomass and diversity. Methodologies used by this community are vast and include analysis of observed and sampled data, remote sensing, and numerical modeling. Observations of air and surface temperature, wind speed, relative humidity, radiation and concentration of dissolved gases, including CO2, are essential for quantification of ocean-atmosphere fluxes of heat, momentum and fresh water. Decrease in pH of the Earth’s ocean or ocean acidification (OA), caused primarily by the uptake of carbon dioxide from the atmosphere, is recognized as a major threat to the marine environment. Once again, VOOs programmes allowing scientific instrumentation on board for measuring ocean acidification parameters and collect data while the ship is underway, allow data on ocean chemistry to be collected in many remote areas of the world’s ocean, such as high latitude waters, long distances from land (e.g., mid-basin waters) and places not easily accessible by research cruises. The water cycle drives tropical atmospheric circulation and is therefore a key component of climate and weather. Vessel-based salinity and temperature observations also provide in situ data to monitor the water cycle.
3.3. Harmful Algal Blooms (HAB) Communities
In order to minimize the toxic algae blooms damage to human health or living resources, such as shellfish and fish, as well as economic losses to fishermen, aquaculture and the tourist industry, efficient toxic algal species monitoring methods are required. Various factors can cause rapid growth, or blooming of these organisms, including increases in nutrient levels (e.g., phosphorus and nitrates) and changes in water temperature, chemical factors (such as pH or turbidity), ocean currents or in the local ecology.
Timely and effective detection of HAB is still a complex problem for researchers. Observing systems for HAB include laboratory species identification and abundance, and analyses of local water samples, remote sensing methodologies (such as analysis of ocean color images), image-based technologies (e.g., imaging flow cytometer), as well as in situ measurements using spectral fluorometers technology type. The understanding and prediction of the development of HAB, implies also measuring environmental parameters such as SST, SSS, turbidity, nutrients, dissolved oxygen and chlorophyll-a. The installation of measuring devices in VOO executing regular routes in coastal zones (e.g., ferries in estuaries or/and coastal areas) may be a major contribute to HAB local detection and research, due to the regularity of information obtained within adequate temporal and spatial observations scales, being able of providing the ability of identify the development of HAB almost in near-real-time. Furthermore, data collected by VOO can also be used in models predicting growth trends of harmful algae species and dispersal of these blooms, hence providing vital information for the community affected by this phenomenon, including fishing, aquaculture and associated industries.
3.4. Remote Sensing Communities
Ships provide observations of SST, waves, sea ice, salinity, chlorophyll concentration, humidity, air temperature and winds, each of which has corresponding remote sensing systems deployed on Earth-orbiting satellites or aircraft. Remote sensing communities rely on surface observations to develop and validate retrieval algorithms used to derive geophysical parameters from the measurements made by remote sensing systems, or even to fill the image gaps resultant from the satellite orbit type or other interfering factors, such as clouds. Ship-based observations from VOO are used to develop, refine and calibrate remote sensing algorithms, namely through data collected in remote sub-sampled areas of the globe.
3.5. Numerical Modeling Communities
Numerical models, from simple local to fully coupled atmosphere–ocean biogeochemical global circulation models, benefit from in situ observations that are needed for evaluation, validation and data assimilation.
Modelers community acknowledges the value of in situ observations, provided that the information on those data is sufficient to allow them to conduct quality model evaluation necessary for their applications. In some cases, this may result in rejection of simulated data, based on comparison to quality data obtained in the area under study, whether by fixed platforms, such as moorings, by satellite sensors or by other means including VOO.
Assimilation is the process whereby new data are incorporated into the models, which therefore need a constant supply of real and near-real-time observations, in order to keep producing valuable forecasts. In that sense, VOO could be a source of those data if a satellite transmission (e.g., Iridium) is available.
In turn, delayed time mode data obtained in VOO regular routes (produced with an improved quality control, when comparing with real-time data) can provide, not only parameter time series for model calibration, but also initial and boundary conditions for numerical models, boxing in an area of sea or ocean ply by VOO.
It is expected that a more coordinated, multivariate approach to the collection of marine data, along with easier access to and better documentation of these data, will increase the use of VOO observations by the modeling community [2].
3.6. Fisheries Communities
Ship-based observations can serve the wider community involved in the fishing industry. This includes, fishermen, owners of fishing vessels, scientists and policy makers, among others. Use of fishing vessels as VOO can be an effective way to involve the fishing community directly in the topic of ocean observing and resource conservation, making them scientists of opportunity or another way of citizen science. Within scientific purposes, tools have been developed to allow contemporary collection of in situ environmental and fisheries data in support of oceanography and fisheries science, aiming the management of renewable resources. The involvement of Japanese fishermen in marine fisheries forecasting service system is a very well-known case of success. This service has the collaboration of several organizations from all over Japan, including the Japan Meteorological Agency, universities and other institutions dedicated to oceanographic and remote sensing studies, fisheries regional laboratories and experimental stations, fisheries agencies, fishing associations and co-operatives, and radio stations. Fishermen themselves make in situ observations and provide near real-time information to the Japan Fisheries Information Service Center (JAFIC) or other associated institutions [18]. In other words, everyone related with fisheries activity collaborates in this service for the ultimate goal of getting the best socio-economic benefit from it [19].
4. Portuguese Initiative within VOO Schemes
4.1. General Overview
Nowadays, many vessels are equipped with devices for measuring mainly meteorology and wave parameters. Most of these observations, e.g., wind, air temperature, atmospheric pressure, wave characteristics are collected in the ICOADS system and are used as climatic information [20]. The early observations of wave characteristics were visual ones, which required skilled observers and had some variability, but they were to have good correlation with measurements [21,22]. These type of data have been used to make climatic atlas with information about wave conditions worldwide that are still being used by the shipping companies [23]. More recent calibrations of the data based on current data sets also confirmed the usefulness of such data [24]. In fact, these data were used to determine the representative shipping routes [25], as well as to determine the effect of weather routing systems [26] in letting the ships avoid the storms and be subjected to a somewhat milder wave conditions [27,28].
Off Portugal, first experiences under VOO schemes, included the use of fishing vessels as observing platforms, under NATO SATOCEAN project [29,30]. They used “bulk” thermometers and XBT probes to measure SST and obtain vertical profiles of temperature on board swordfish longline and sardine purse-seine fishing vessels. Despite the scientific success of these applications, the need for human intervention was always a problem, preventing a true operational system. Later on, the European BASBLACK project [31] aimed at characterizing the habitat of the deep-water species black scabbard fish (Aphanopus carbo) in the NE Atlantic, by collecting environmental information (Temperature Depth Recorders) and record catches, every month over 1 year, on board a volunteer fishing vessel. Methodologies to use fishing vessels as VOO were developed but again human intervention was needed, which prevented a sustainable observing system.
Presently, fishing vessels activity is monitored for fisheries control by using Vessel Monitoring System (VMS) equipment, the Portuguese MONICAP (Continuous Fisheries Activity Monitoring). This system was developed by INESC (Portuguese Institute for Systems Engineering and Computers—http://www.inesc.pt/en/) in partnership with UNISYS Portugal and supported by the Portuguese State Department of Fisheries and DG XIV of the European Commission. MONICAP system was the first of a kind to be implemented in Europe, and currently it is mandatory that all EU fishing vessels over 12 meters in overall length, regardless of the area of operation, are equipped with a satellite monitoring system of this type [32]. It comprises a mobile device installed on board fishing vessels, commonly called the blue box or Continuous Monitoring Equipment, whose main function is to record all relevant data on the ship’s behavior. Data are transmitted through Inmarsat satellites with a programmable periodicity or immediate at the request of the CCVP/FMC-PT (Portuguese Fisheries Control and Surveillance Center), namely, latitude, longitude, date and time, course, speed and equipment management information (alarms, power, battery charge, antenna signal). This allows, for example, checking fishing activity and operations without fishing license or authorization, in prohibited or temporarily closed areas or during closed seasons, as well as the use of unauthorized fishing gear. VMS geo-referenced data acquired by MONICAP also present a great potential for research and have been used over the past two decades to analyze fleet dynamics and estimate effective fishing effort. Coupling the geo-referenced positions with landings or electronic fishing logbooks data, allows to follow the distribution patterns of targeted species and to estimate series of CPUE (Catches Per Unit Effort), a main indicator in fisheries management, often used as a proxy to resource abundance (e.g., [33,34,35]).
Another system for obtaining information on board VOO was initially developed under the scope of the EU project HANDLING WAVES, which used on-board measurements of ship motions to derive the characteristics of the wave exciting the motion, based on different analysis methods [36,37]. This system, allows the measurement of wave characteristics, avoiding the use of visual observations done in earlier days. This system was integrated in a decision support system for ship handling in storms and a prototype was installed in an Italian ship. The system was later installed in another decision support system, now aimed at safety monitoring of fishing vessels, within the project SADEP (Decision Support System for the Safety of the Fishing Vessels Subjected to Waves Project), developed by CENTEC and funded by the Portuguese Science and Technology Foundation (FCT) [38]. The system is particularly important during fishing operations, through the determination of the effect of fish on the weight distribution on board and the forces on the fishing gear to determine safety against capsizing [39]. Validations during sea operations were made aboard a patrol vessel of the Portuguese Navy, on the Tagus Estuary (Lisbon-Portugal), and the results were encouraging [40]. The system is being continuously improved, through the introduction of new wave spectrum parameterizations and testing on board Portuguese navy vessels [41].
Since 2019, in the framework of the Coordinated Atlantic Coastal Operational Oceanographic Observatory (MyCOAST—http://www.mycoast-project.org/), a pilot experience using a multi-sensor FerryBox-type device, developed by UNDERSEE (http://periscope-network.eu/spotlight/undersee-multi-sensor-fusion-system-water-quality-monitoring-0) is underway in the Tagus Estuary. The FerryBox-type device was already installed on a ferry VOO, which navigates in a daily basis in the Tagus Estuary, acquiring automated measurements of core water quality parameters: temperature, pH, dissolved oxygen, ORP, salinity, turbidity and chlorophyll-a. The system is coupled to a cloud platform that allows remotely real-time access, with possible visualization and download.
A generalized use of these FerryBox-type devices by VOO, such as cargo ships en route in Atlantic waters and in fishing vessels operating in Portuguese waters, was proposed under the scope of two scientific national funded ongoing projects lead by IPMA (Portuguese Institute for Sea and Atmosphere) in a partnership with CENTEC (Centre for Marine Technology and Ocean Engineering of the University of Lisbon). These projects are: “Ocean Observing Systems in the Support of Marine Ecosystem Management” (OBSERVA.PT) and “Autonomous Observing System in Fishing Vessels for the Support of Marine Ecosystem Management” (OBSERVA-FISH). Under these projects, it was proposed an integrating AOS, able to retrieve, not only the ocean underway parameters obtained by the FerryBox-type devices, but also simultaneous meteorological information and wave data. The design and implementation of this AOS under these projects will be described next.
4.2. Observing System Design
The implementation of an autonomous observing system using VOO, can be a time-consuming process. It encompasses a series of tasks involving engagement between the technical/scientific team, responsible for devices installation and collected data processing, and the stakeholders and volunteer ships willing to participate in the programme. In general, such a process involves the main following steps:
- Definition of ECV/EOV to be collected (by scientific proponent team);
- Recruitment of volunteer Vessels of Opportunity;
- Assembly of acquisition equipment on ships;
- Data acquisition transmission and processing (includes quality control);
- Data dissemination.
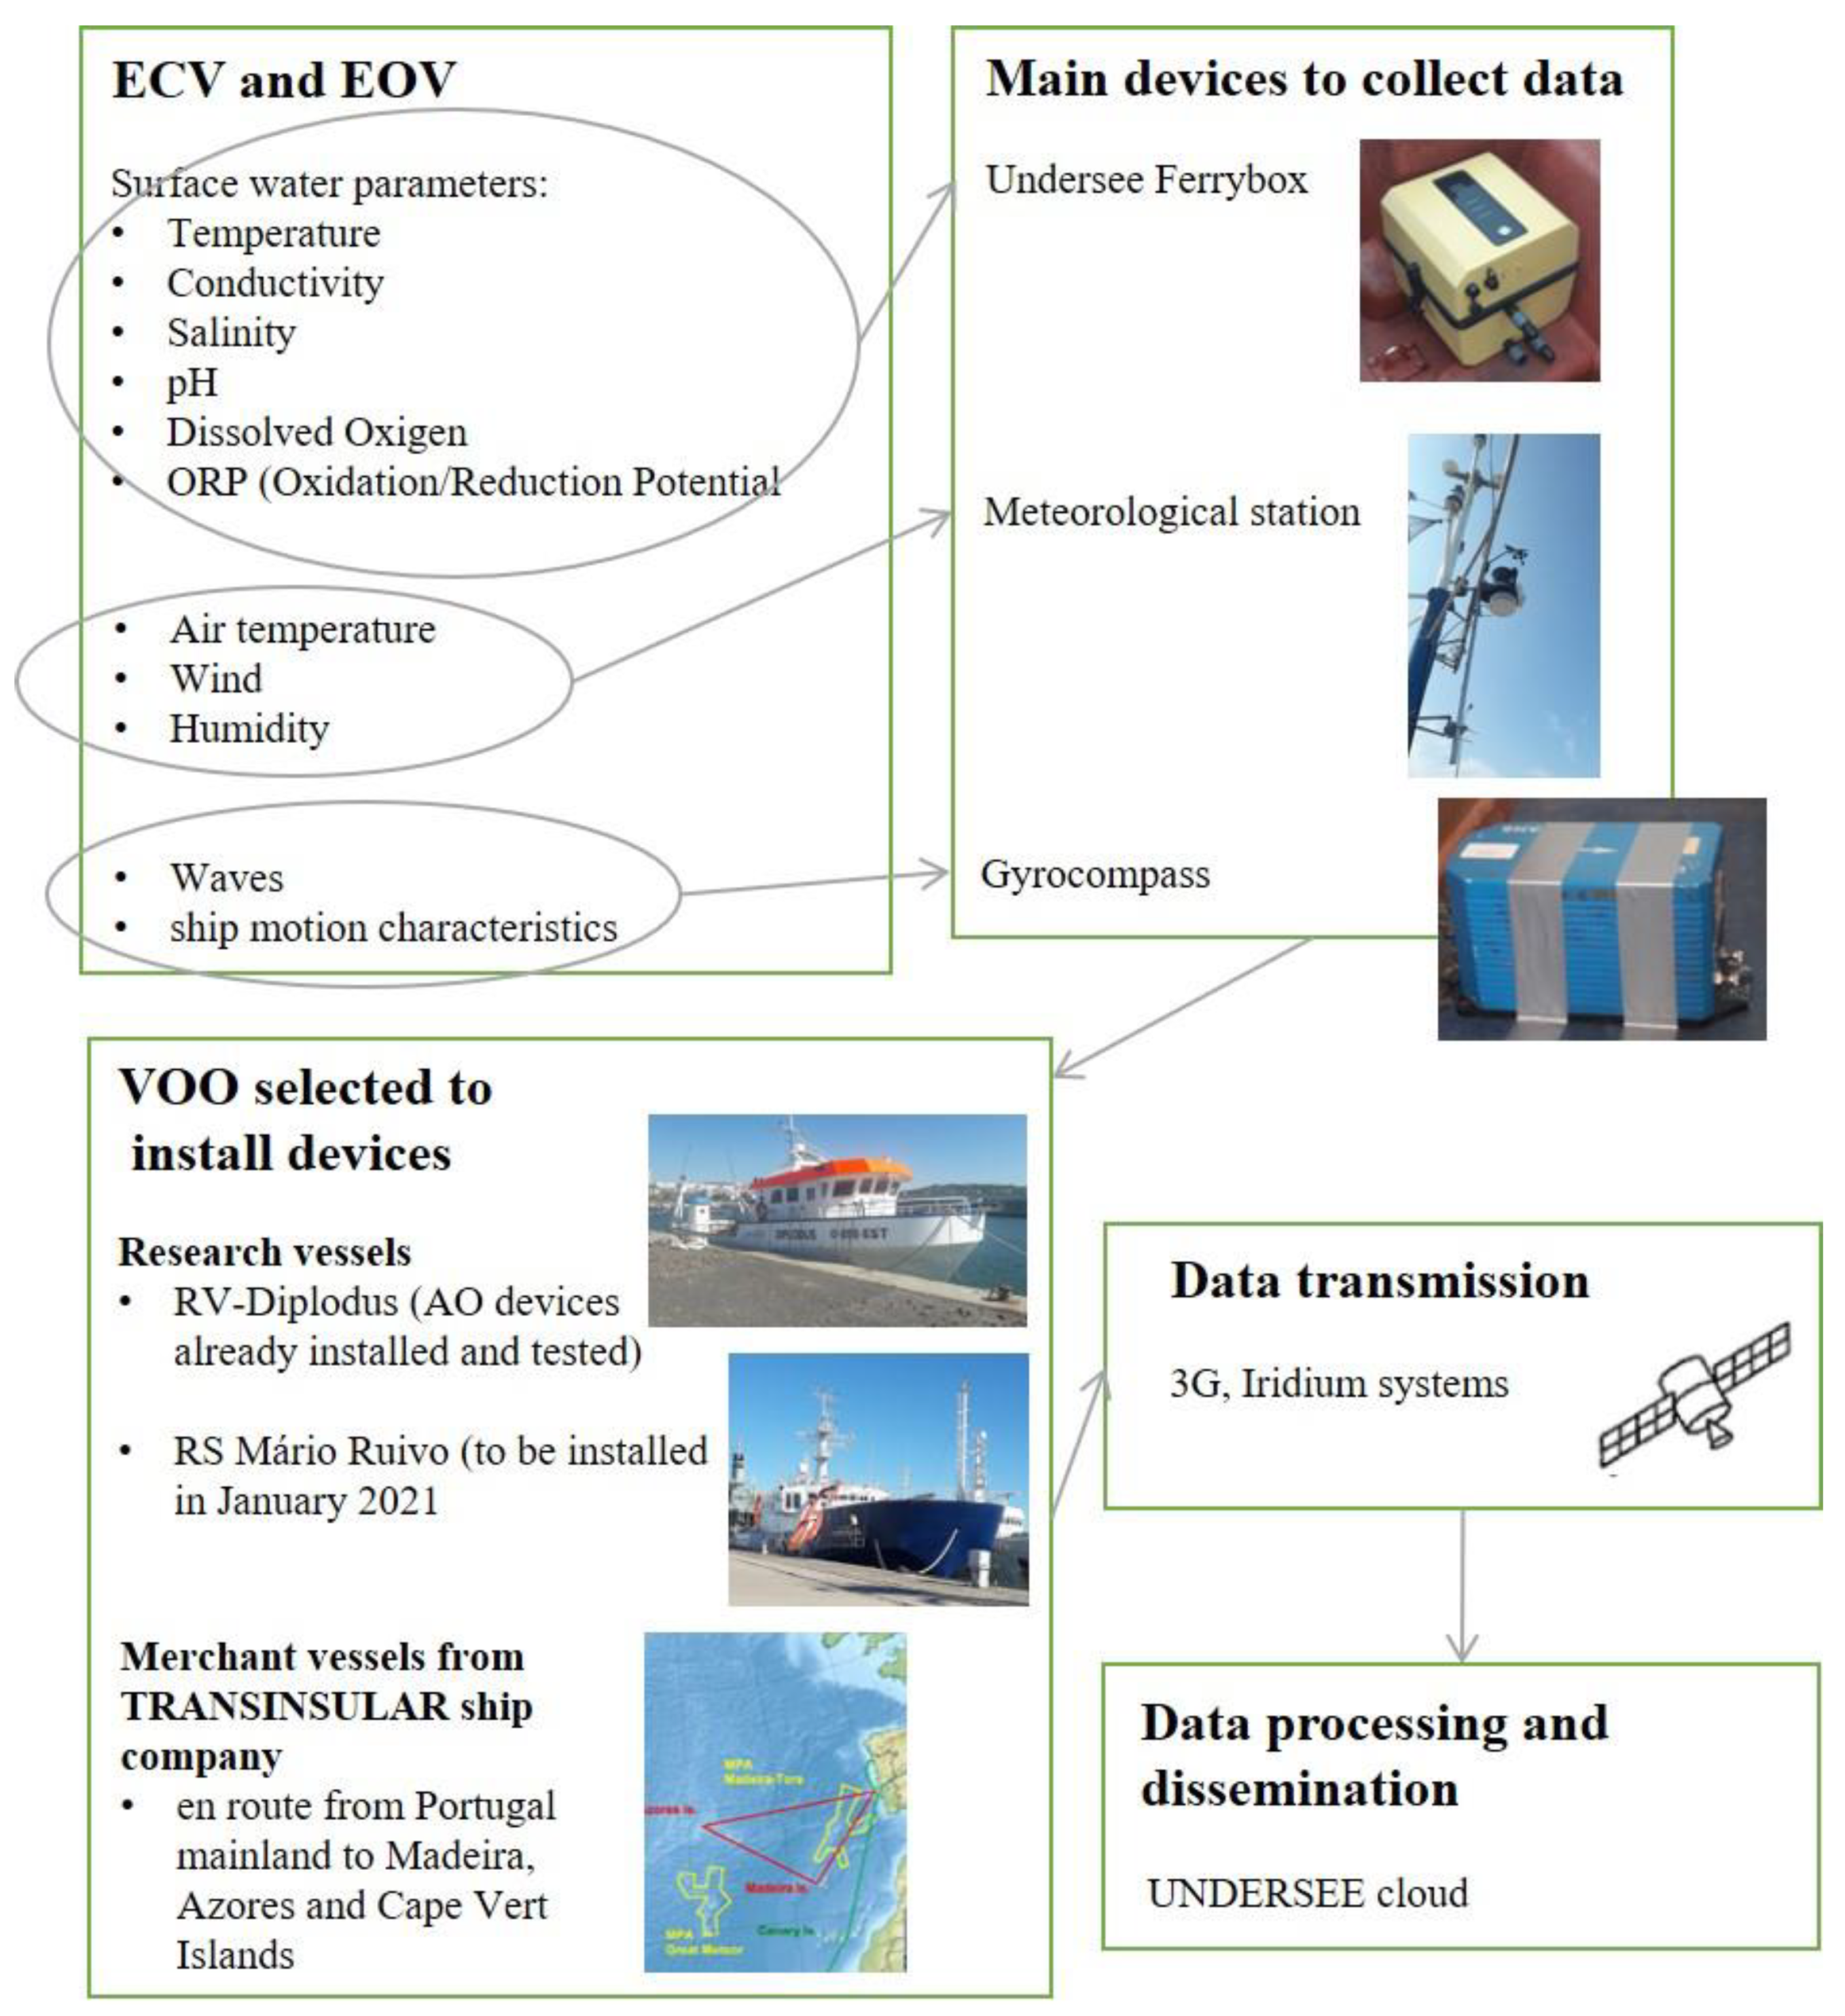
The AOS described below has the following overall objectives: To ensure the maintenance of long-term monitoring activities in the open ocean (e.g., in Marine Protected Areas), build oceanographic time series and map their spatio-temporal variability to support the management of marine ecosystems, assess their biodiversity, improve climate characterization in the NE Atlantic oceanic areas, as well as the improvement of meteorological forecasts for maritime activities. Within such ambitious goals, in a first stage, the primary variables selected to integrate the AOS were the physical (abiotic) variables shown in the scheme presented in Figure 1.
After objectives and data definition, an observing VOO scheme involves the fundamental task of recruiting available vessels to transport the measuring devices. In particular, the recruitment of ships to VOO programs requires communication with the maritime industries and entities that operate ships. This includes ships owners/operators in all activities: transportation (merchandise and passengers), fishing and recreation (cruise vessels, sailboats or catamarans), but also research vessels. The costs of acquisition and installation of the measuring devices will be borne by the scientific/technical team project proponents, and no financial contribution is expected from the owners of the vessels. Within the ongoing AOS project, a partnership with a shipping company TRANSINSULAR (https://transinsular.pt/en/) was already established. This partnership will include the installation of meteorological stations, Undersee FerryBoxes and other oceanographic equipment (e.g., trace gas analyzer) on board two cargo ships en route from Portugal Mainland to Madeira, Azores and Cape Vert Islands in the Northeast Atlantic [42].
The integrated system conceived under the umbrella of OBSERVA.FISH, integrates the UNDERSEE FerryBox system, and the Decision Support System (DSS) developed by CENTEC on board vessels, which allows the continuously measuring of waves, and atmospheric parameters. The estimation of the sea state parameters is essential to existing regional area operational weather forecast systems [43,44] to have an updated database of the main characteristics of the sea-state, providing real-time data that can be assimilated into them [45,46]. Such updated information can be very useful for several applications on open-sea such as offshore platforms installations and safe ship navigation or maritime activities operation like fisheries [44]. Furthermore, it will allow an integrated analysis of fishing success with marine environment and atmosphere to support fisheries and an integrated management of the marine ecosystems. The use of fishing VOO is one way to make long-term scientific measurements sustainable since fishing vessels ply coastal seas at all times of the year and in almost all weather conditions.
A scheme of the overall AOS system here referred is shown in Figure 1. The AOS was already successfully tested and implemented in the RV Diplodus, which is a fishing-type research vessel owned and managed by IPMA. Details of the instrument installation in this vessel and tests performed are described next.
4.3. Acquisition System: Devices Description
The system is composed by a set of sensors and equipment to collect meteorological and oceanographic data as well as monitoring ship motions. The main devices of the system are described below.
(1) Meteorological unit: Consists of the Vantage Pro2™ (6152) Wireless Weather Station, which is used to collect meteorological information. It includes two components: the Integrated Sensor Suite (ISS), which houses and manages the external sensor array, and a console which provides the user interface, data display and calculations. The ISS and the Vantage Pro2 console communicate via an FCC-certified, license-free, spread-spectrum frequency-hopping (FHSS) transmitter and receiver. The frequency hopping spread spectrum technology provides greater communication strength over longer distances and areas of weaker reception. This weather station includes two additional sensors: the UV sensor and the solar radiation sensor. The console may be powered by batteries or by the included AC-power adapter. The wireless ISS is solar powered with a battery backup. It has an interface with a computer, to log weather data and to upload weather information to the Undersee cloud.
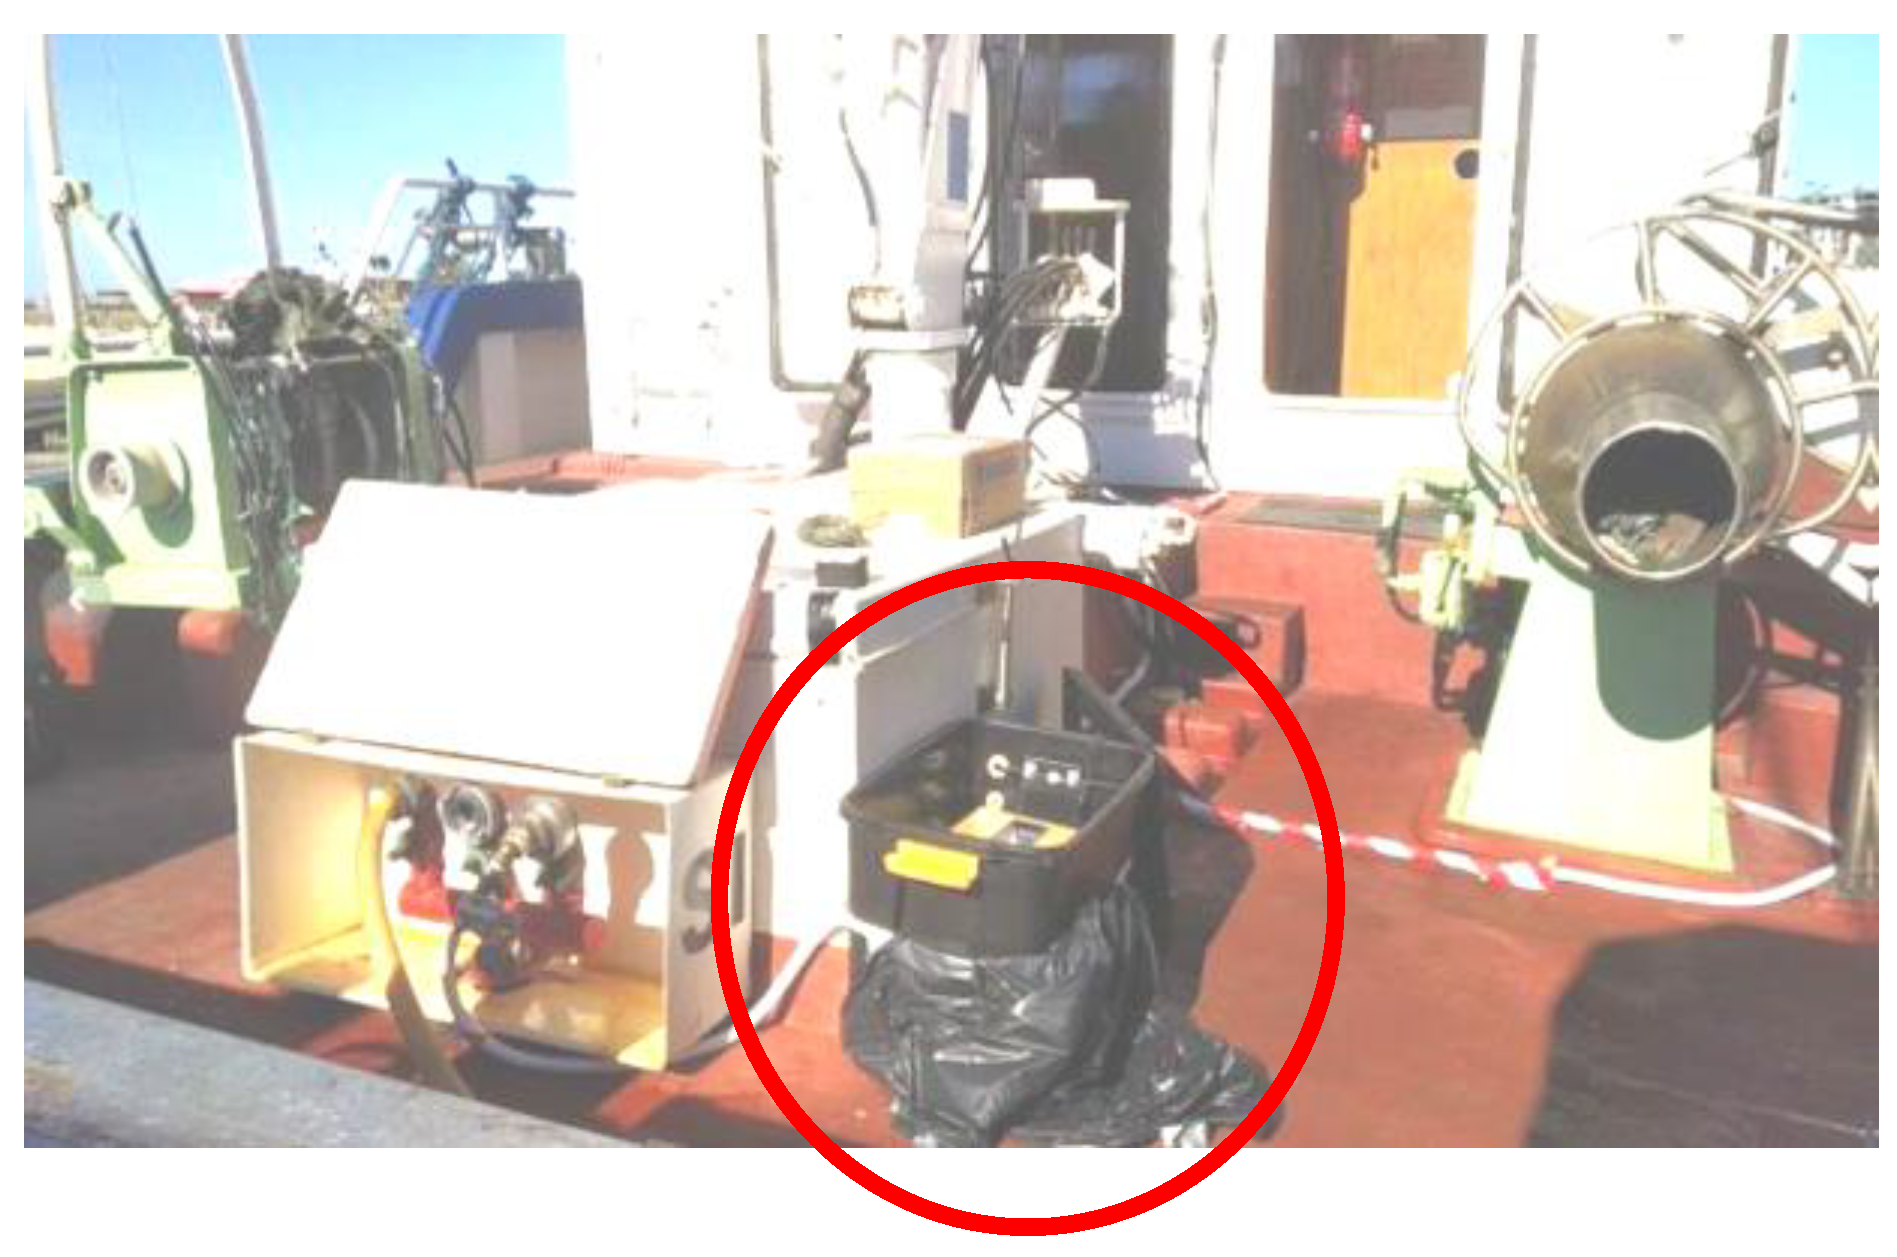
(2) Oceanographic unit: The UNDERSEE_water system from Matereospace Lda. (Portugal) is used to measure continuously the surface oceanographic parameters during the shipping routes. It integrates an in situ acquisition system, providing real-time water surface oceanic data, which are real-time transmitted to the cloud platform. It is powered supplied and requires sea water input and output accesses. The device integrates a GPS, allowing the access to positioning information. The communication of the acquired information is done in real-time using a 3G system antenna. On top, it has a screen for controlling the box operation. The inflow is controlled through a flow meter. The box is small (30 cm × 30 cm × 25 cm) and light (less than 6 kg), allowing its easy installation in VOO, which is an advantage over other heavier FerryBox-type devices. It contains a cleaning freshwater inlet, which is activated whenever the FerryBox is turned on to clean the sensors and to prevent them to get dirty. The depth at which seawater is collected will depend on ships configuration and its load. In the RV Diplodus, the water was collected approximately at 1 meter depth (below sea level). In the future, the system is expected to be complete with a bubble-trap system in order to minimize data acquisition errors.
Figure 2 shows the device in the RV Diplodus. The FerryBox was placed in a waterproof box on the vessel’s deck. Its pre-operation required basic works: a connection to a 220 volt power supply and the installation of pipes, and flowmeters ensuring sea and fresh water inputs and output discharges.
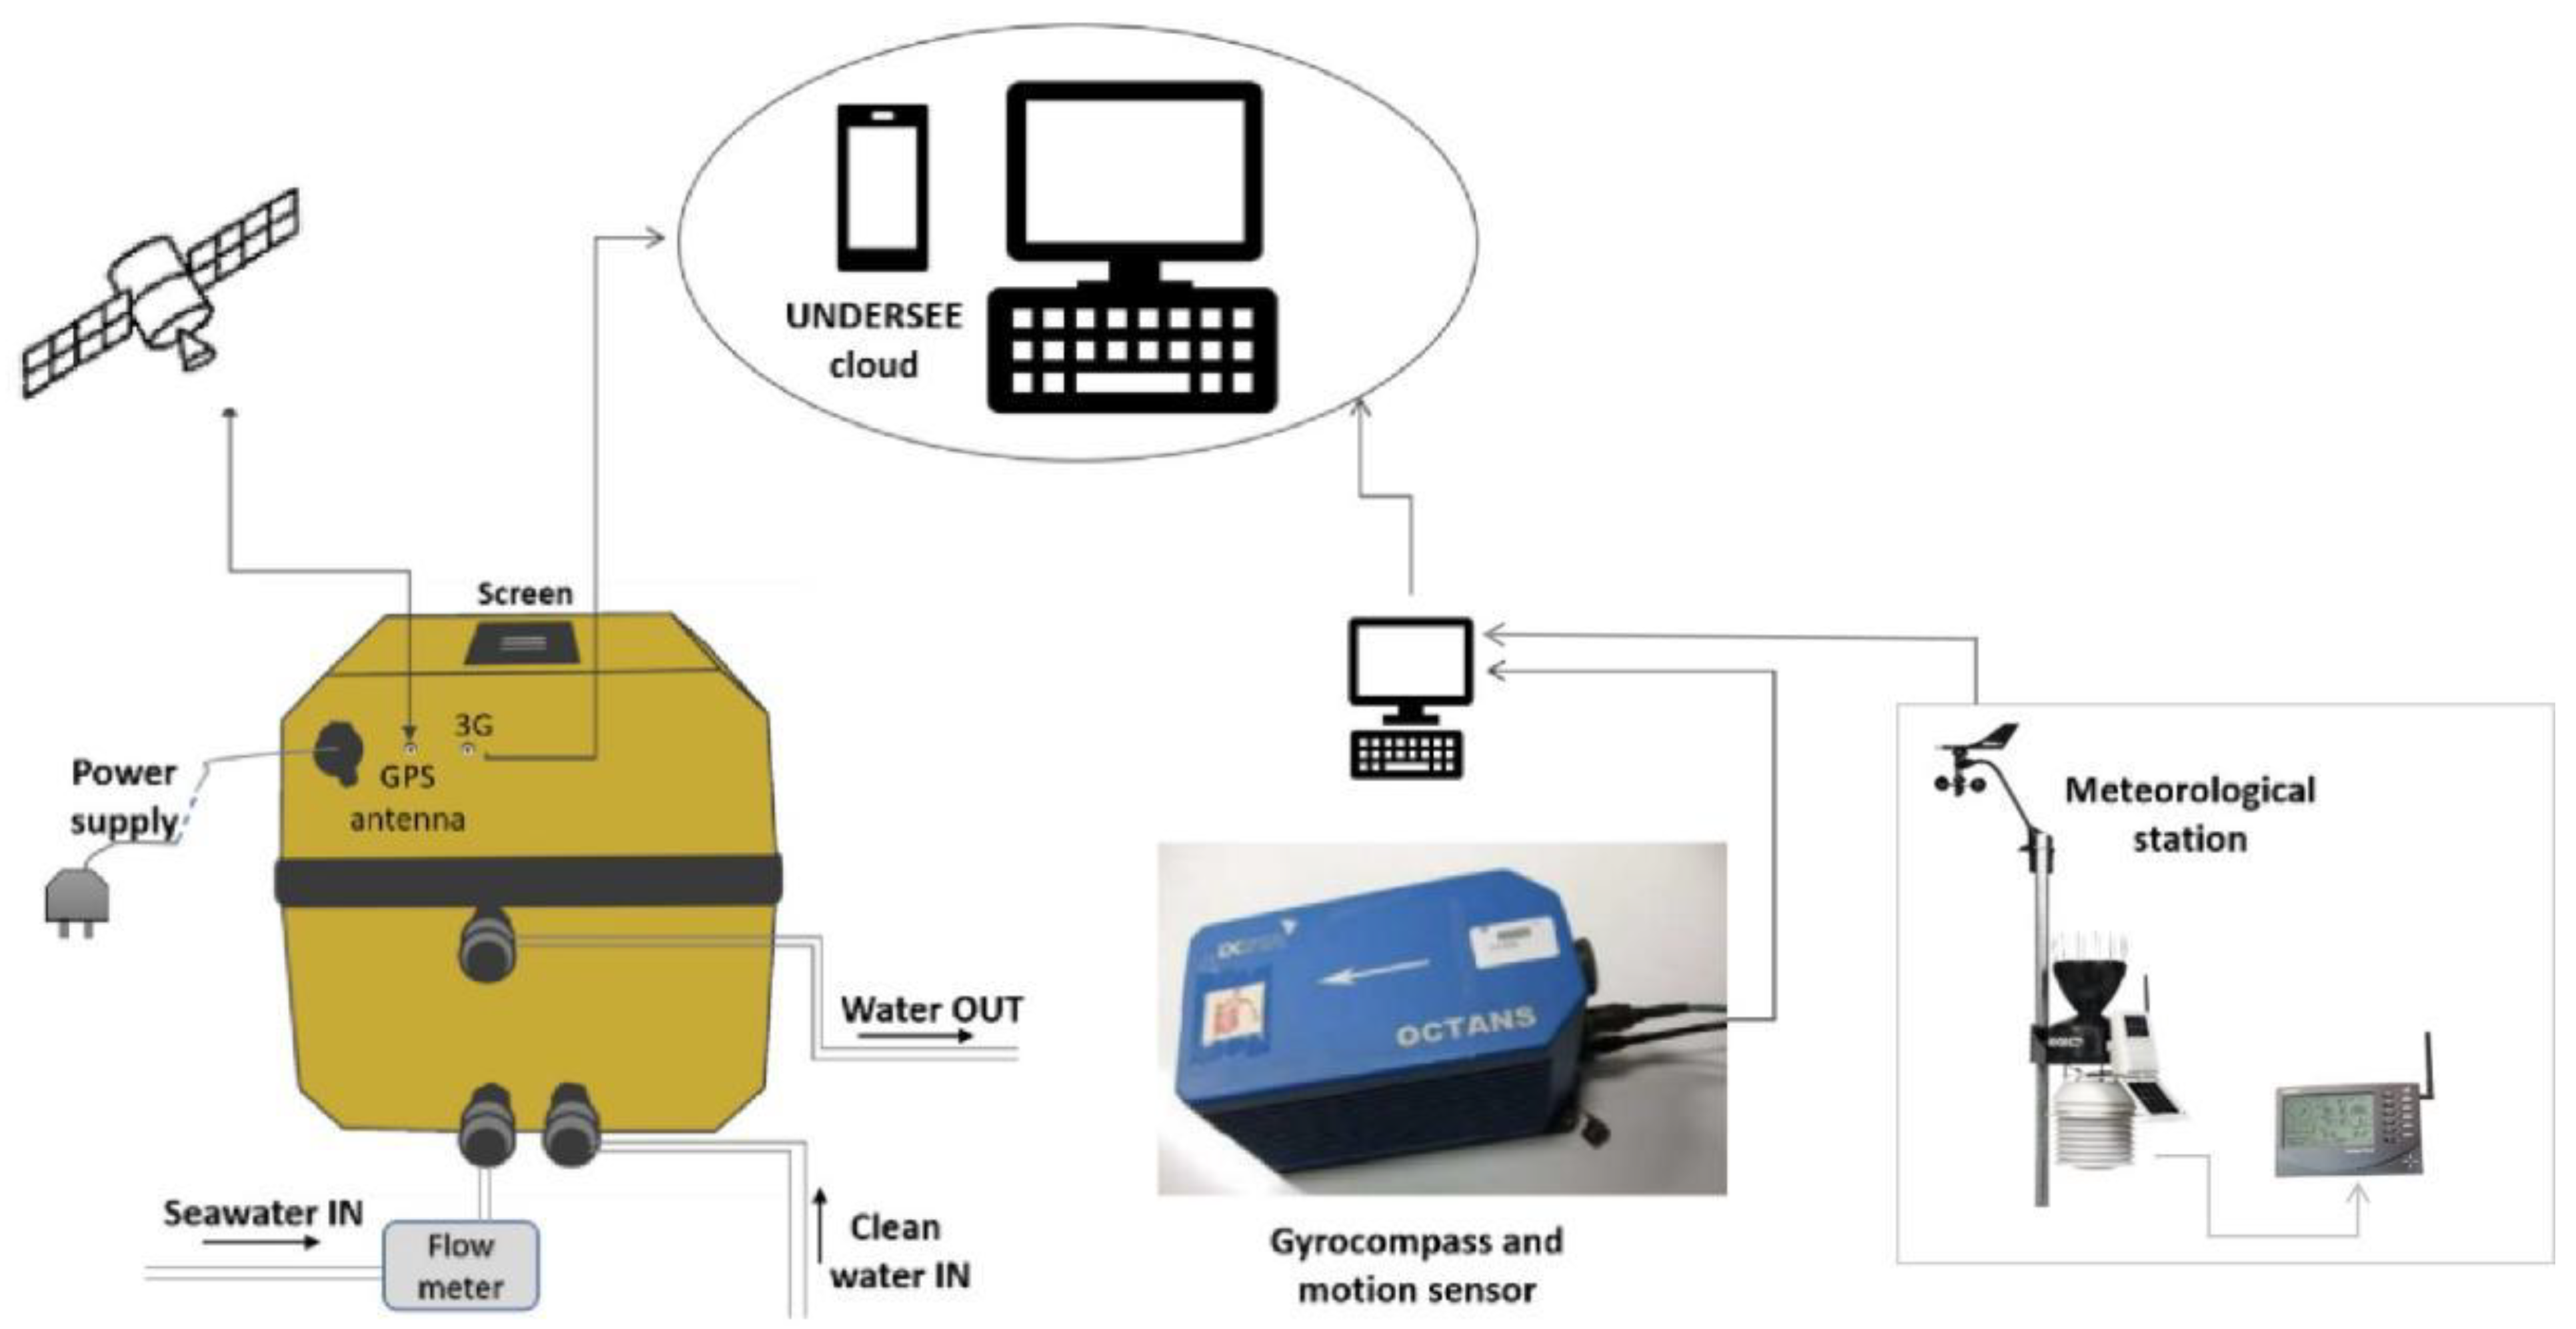
(3) Motion sensor unit: The IXSEA OCTANS gyrocompass was installed on the RV Diplodus bridge. This device provides true-heading, roll, pitch, yaw, heave, surge, sway, rates of turn and accelerations. The core of the sensor is a compact strapdown inertial measurement unit, which contains 3 accelerometers and 3 fiber optic gyroscopes, and a real-time computer. Gyrocompass is ideally installed as near as possible to the center of gravity of the ship; the exact position must however be registered.
(4) Control unit: It is composed of a CompactRIO data acquisition unit and a computer located on the bridge. The LabVIEW environment is used for programming the system, and to produce an interface with the users. The control unit allows the collection of data measured by the motion sensor, receives wireless information from the weather station, and is connected to a GPS unit for position and reference time purposes. The data are elaborated according to the ship-buoy analogy as developed in [36,40] for the estimation of directional wave spectrum based on ship responses measurements. The sea state is inferred from the measurement of the motions of the ship by using a Kalman filter-type algorithm [37,39]. Full scale trials in large ships showed that this method tends to underestimate the significant wave height as the vessel motions are less sensitive to high frequency waves, acting as a filter to those frequencies. In general, a better estimation can be expected in smaller vessels, like the fishing vessels considered in this application. Both algorithms are available, and the availability of more data from VOO will allow to better evaluate the effectiveness of the two. The analogue output of the signal processor unit, which is made available to the DSS, is composed by the quantities: relative wave height, wave height, significant wave height and average wave period.
A scheme of the integrated AOS used and tested in the RV Diplodus is presented in Figure 3.
Tests were conducted in Tagus Estuary off Lisbon (Figure 4), between 15 and 30 of October 2021, using RV Diplodus simulating an artisanal fishing vessel, within daily campaigns. The tests focused on equipment performance, data acquisition and transmission/reception of information. Initial tests allowed the detection of problems in the FerryBox input flow, which was below the desirable limit for sampling, and in data land reception, due to inadequate positioning of the GPS and 3G antennas. Since the vessel docked every end of each day, the problems detected were fixed and at the end of the campaign the system was fully operational.
4.4. Data Processing and Dissemination
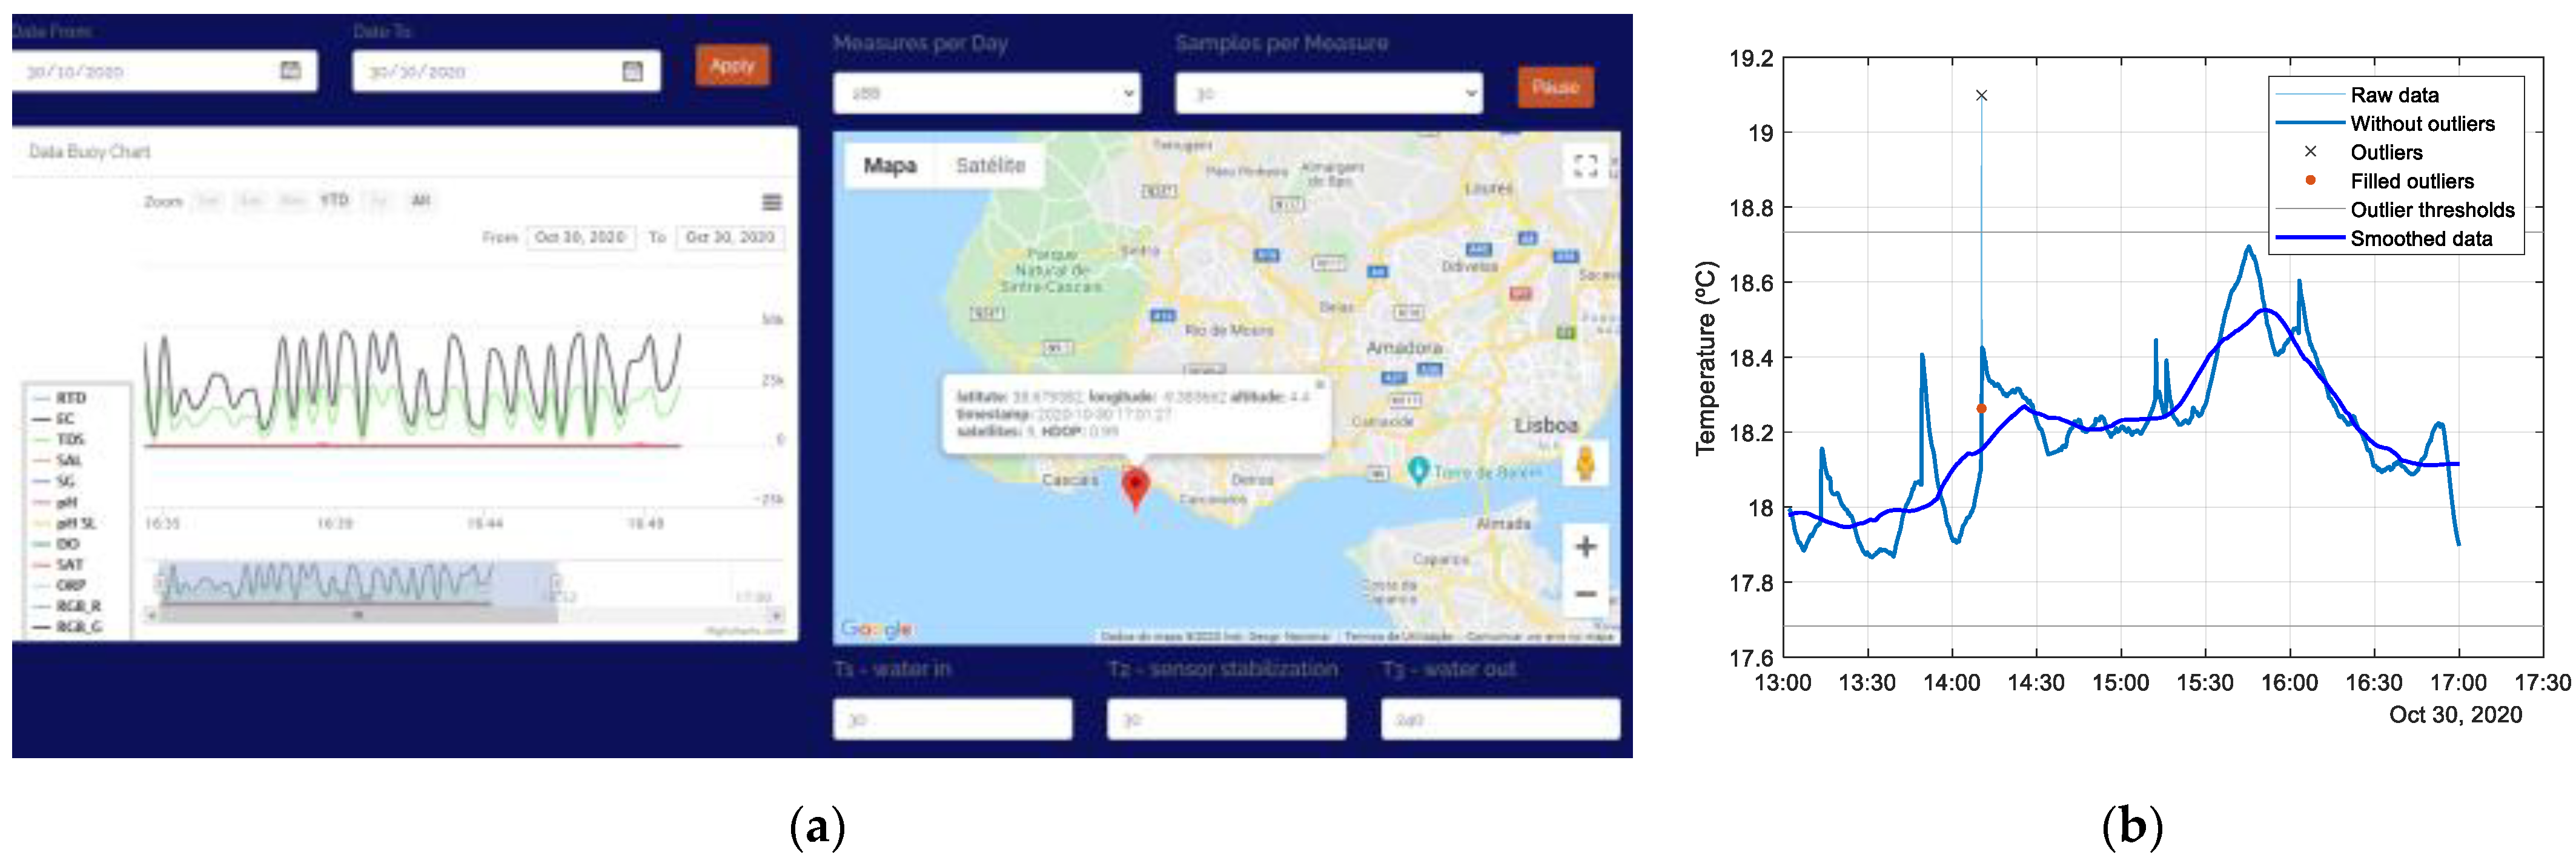
The observing system integrates all the measurements with date, time and GPS position to produce single raw data points that can be send to the Undersee-cloud and visualized in near real-time as presented in Figure 5. This figure is an example of the Undersee-cloud user interface, showing the ship’s navigation position and the parameter selected for on-screen viewing. All raw data collected are accessed online by IPMA, the designated data receiving coordinator center onshore and require quality control and processing before its free dissemination and use. Ocean data collected by the Undersee box are subject to preliminary real-time processing, which includes removal unreal spikes and series smoothing, since data are acquired with a sample rate equal to 12 seconds (see Figure 5). Calibration of derived information, such as salinity, is complemented by laboratorial analyses of surface water samples collected on board, providing delayed time mode data with improved quality.
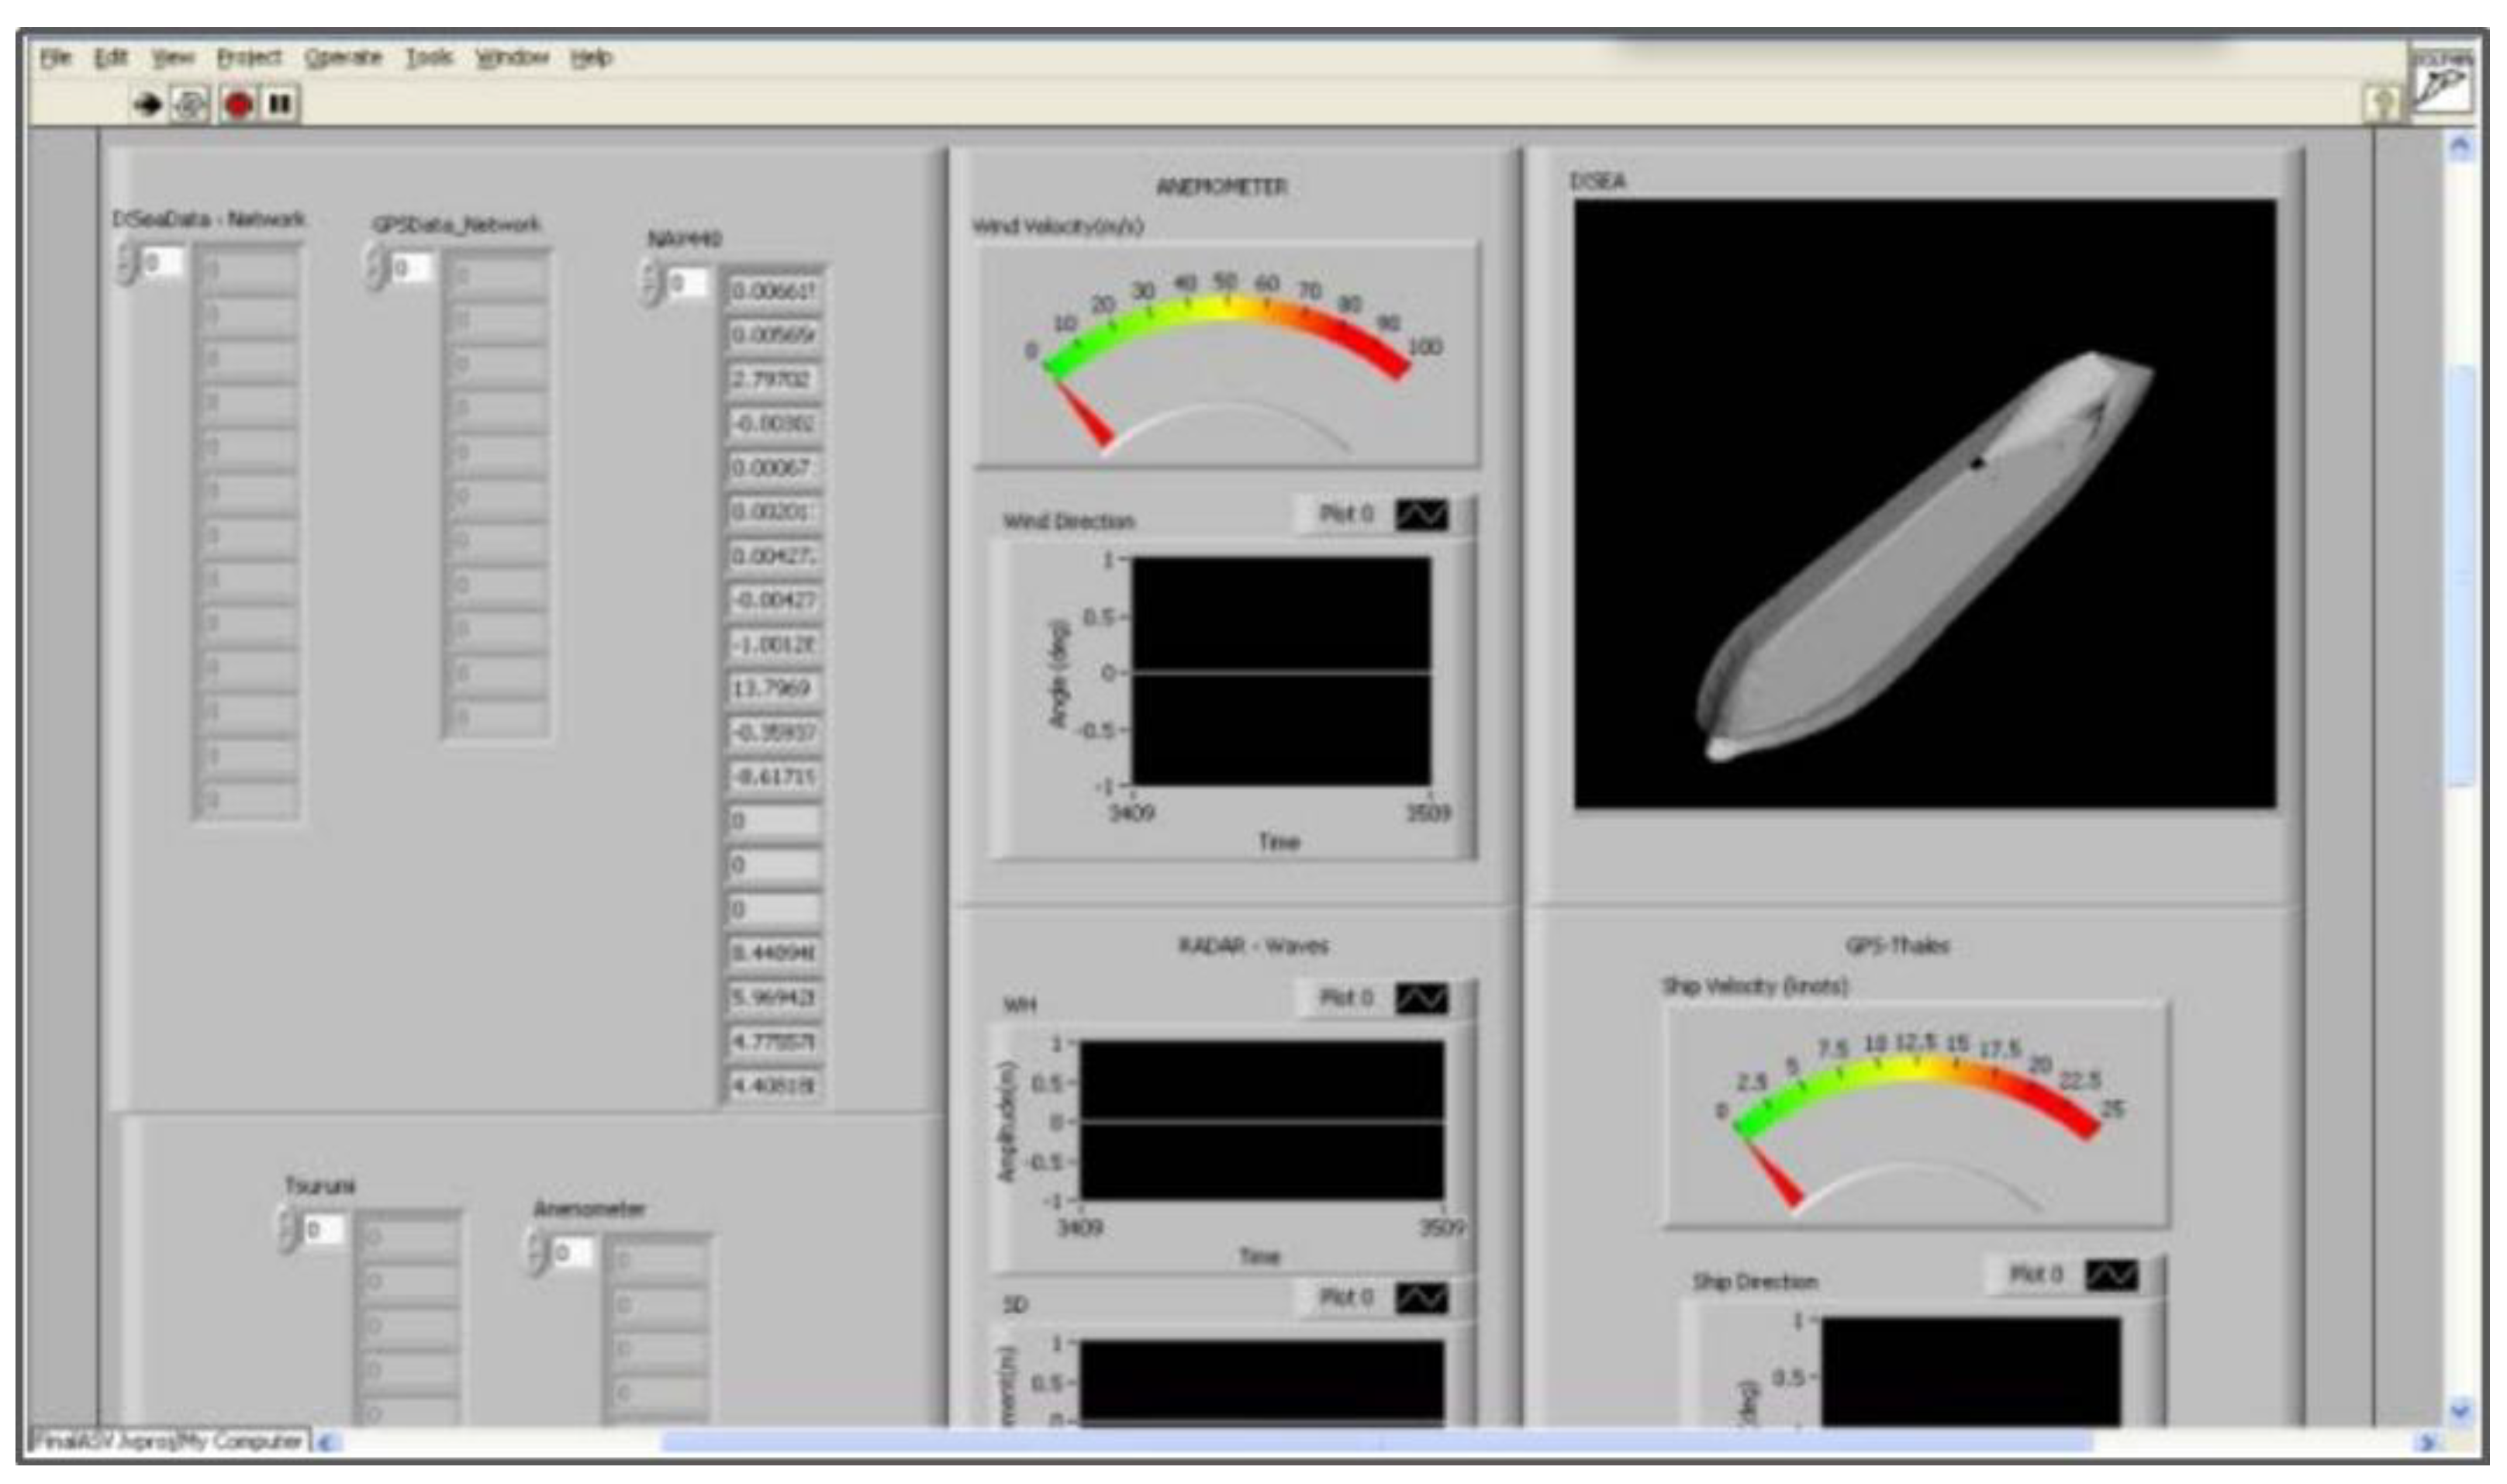
The monitoring of ships movement and the estimation of waves parameters is done using the DSS developed at CENTEC, using LabVIEW as base programming platform [38,39]. The Kalman filter algorithm developed in [37] is adopted for the sea-state estimation, enabling a high-speed computation with respect to the algorithms previously proposed, with an update of the wave spectrum every five seconds (running on a 2.4 GHz Dual Core processor). The inputs to the wave spectrum estimation program are the motion related sensor measurements (midship accelerometers, wave height sensor, inclinometer and angular rate sensor), the vessel loading conditions, course and speed. The output is the estimated wave spectrum including the wave direction, significant wave height and mean period [38,40].
Figure 6 shows the user interface of the main LabVIEW program. In this interface, all signals monitored are displayed. The picture of the small vessel in dark corresponds to the schematic representation of the ship behavior in real-time for which speed and course over ground are displayed in the user interface. The wind speed and the wind direction obtained by the meteorological station are presented in dedicated charts as well as the wave elevation [40]. Like the water parameters collected by the Undersee box, these data obtained as part of the DSS are also sent to the Undersee-cloud.
Different objectives underlie the two modes for providing data to potential users: real-time and delayed time data. The purpose of the real-time data is to supply users who need measurements as “fresh” as possible. This includes a vast community, either on board involved in maritime activities (e.g., fisheries activities, maritime navigation and search and rescue), but also onshore, such as modeling centers with real data needs for assimilation, or policy/environmental decision-makers, for instances facing situations of pollutant spills in marine areas. To guarantee a minimal delay of distribution, without interruptions of the data flow, the AOS envisages a real-time data quality control to be entirely automated, though this can only be obtained near the coast or though satellite data transmission.
Delayed time data with higher quality control standards are mainly used for satellite data calibration and research purposes, such as climatic studies and can be made available through international databases, such as those managed by GOSUD. The data collected by the AOS are indeed expected to be processed following the standards established by the GOSUD programme. The quality-controlled data file structure will be designed according to well defined rules for facilitating large-scale analysis and uptake in numerical model with formats according the EMODnet European Central Portal (e.g., NetCDF).
At the same time, as wave and atmospheric data collected can be used for assimilation in operational wave prediction systems as indicated earlier [43,44,45,46], the oceanographic parameters can be used for validating circulation systems within the area of coverage [47,48]. Thus, these VOO data complement other conventional oceanographic data measured at fixed locations with various coastal ocean observing systems (e.g., [49]) that may include shore-based high-frequency radars (able to map ocean surface currents and waves over a two-dimensional area), X-band radars [50,51,52] and coastal moored buoys.
5. Conclusion: Potentialities and Future Developments
The implementation of an observing system using VOO is a challenging, time-consuming process and requires dedicate specialized human resources. It encompasses a series of tasks involving engagement between the technical/scientific team responsible for devices installation, data processing and dissemination, and development of products for end-users and stakeholders, as well as the volunteer participation of ships in the observing programmes.
The benefits of installing an AOS have been pointed out, as well as the description of the main tasks involved in development of a fully integrated AOS to be implemented, in the near future, in Portuguese research, cargo and fisheries vessels used as VOO. The designed system presented was already installed and tested in IPMA’s fisheries research vessel Diplodus. In addition, it will be installed in IPMA’s RV “Mário Ruivo” and in Transinsular’s cargo vessels, in the near future. The first results have already been obtained and even if the implementation of such system is giving its “first steps”, the results and the feedback of potential AOS participants and users are promising. This first implementation in the RV Diplodus already allowed a first evaluation of the AOS as a whole with the identification of potentialities to be explored, but also failures to be corrected in an expected future process of continuous improvement.
In the short term, the acquisition system is expected to be fully independent from human intervention. This includes stability to power cuts, integration of data collected from CENTEC and Undersee equipment, with the ability to automatically send real-time data to a receiver on board and land.
Minor corrections in specific components are also required to overtake issues encountered during the testing phases, as the installation of a bubble supplier on the input pipes of the oceanographic unit to minimize acquisition data errors due to variations in the flow and presence of air bubbles.
In addition to a robust data collection, transfer, and filing, it is essential to enable end-users to make use of them. Real-time data processing analysis and dissemination takes then a prime role in order to respond to the users requirements displaying the information in a ready-to-use format. In this perspective, the possibility of integrating onboard measurements with other data sources producing spatial gridded data will be considered.
One of main challenges concerning AOS in VOO will be its long-term sustainability. This involves adequate funding, mainly for maintaining a proper and stable team of specialize human resources. Thus, the foundations for a basin-scale contribution to the Global Ocean Observing System (GOOS) is underway.
The Portuguese AOS described in Section 4 intends to attain a Technology Readiness Level 7 (TRL 7) for the ocean observing system under development and as referred, it is already in the phase of demonstration, in an operational environment. However, in the future, it is our intention to bring this technology from TRL 7 to TRL 8 or 9. This means that the prototype and system developed previously will be prepared for commercialization and the intention is to transfer all the know-how and knowledge to private Portuguese companies and enhance Portugal Blue Growth development. Furthermore, the system developed was only intended towards surface measurements using commercial sensors, but we have the ambition to observe also the water column, develop new low-cost low-energy sensors and estimate catches based on video-cameras images and image processing software. The importance of this latter case is that more than 8000 vessels are actively engaged in fishing activities only for Mainland Portuguese EEZ, but this number increases if Azores and Madeira EEZs are considered. Presently, 500 vessels are participating in VMS monitoring programmes, including distinct fishing segments in what concerns the fishing effort, type of gear used and their impact on the ecosystem. Coastal trawling and seining (about 90 and 100 active vessels respectively) are well characterized in terms of target species and fishing trip types. In polyvalent fisheries, where the number of vessels over 12 meters in length exceeds 300, each vessel can hold diverse fishing licenses for several gears. The common situation is that the same vessel is actively involved in the capture of different species using different gears at different times. In these fisheries, only a small number of vessels cooperate with the National Biological Sampling Programme (PNAB), therefore the number of vessels and trips sampled is low, mainly as a consequence of the lack of conditions for onboard observers. This is especially true in the polyvalent fleet where little is known about vessels behavior, including strategies and tactics, the diversity of fishing gears and the way they are operated. Thus, quantification of fishing effort and the corresponding impact on the ecosystem is not possible. It is why the development of an observing system is envisaged, one that could also estimate fishing effort and catches autonomously.
Author Contributions
The autonomous observing system was design by A.M.P.-S. and C.G.S.; implementation of the observing system and field work were done by T.L.R., R.V. and A.M.P.-S.; tests onboard RV Diplodus and data processing were performed by T.L.R. and R.V.; original draft writing, preparation and editing was done by all authors, namely, Introduction: T.L.R.; VOO international initiatives overview: T.L.R. and A.M.P.-S.; VOO data types and users: T.L.R.; Portuguese initiative within VOO schemes: T.L.R., A.M.P.-S., R.V. and C.G.S.; Conclusion: potentialities and future developments: T.L.R., A.M.P.-S. and R.V. All authors have read and agreed to the published version of the manuscript.
Funding
This research was funded by the EU FEDER/FEMP and Portuguese Foundation for Science and Technology (FCT) under the Portugal2020 (Lisboa2020, Algarve2020 and MAR2020) Programme through projects OBSERVA.FISH (PTDC/CTA-AMB/31141/2017) and OBSERVA.PT (MAR-01.04.02-FEAMP-0002). This work contributes to the Strategic Research Plan of the Centre for Marine Technology and Ocean Engineering (CENTEC) and of the Centre of Marine Sciences of the University of Algarve (CCMAR) which are financed by the Portuguese Foundation for Science and Technology (FCT) under contracts UIDB/UIDP/00134/2020 and UIDB/04326/2020.
Institutional Review Board Statement
Not applicable.
Informed Consent Statement
Not applicable.
Data Availability Statement
Not applicable.
Acknowledgments
The authors want to express their appreciation to the Division of Ships from IPMA, to the project C4G (POCI-01-0145-FEDER-022151) and its team and to RV Diplodus crew for all the support in the installation of the devices in the vessel, as well as to Undersee for their collaboration in these observing programmes.
Conflicts of Interest
The authors declare no conflict of interest.
Appendix A

Table A1.
List of the main acronyms and abbreviations used in the text.
| Acronym/Abbreviation | Meaning |
|---|---|
| AOOS | Alaska Ocean Observing System, USA |
| AOS | Autonomous Observing System |
| CCMAR | Centre of Marine Sciences, Portugal |
| CCVP/FMC-PT | Portuguese Fisheries Control and Surveillance Center |
| CENTEC | Centre for Marine Technology and Ocean Engineering, University of Lisbon, Portugal |
| CIESM | International Commission for Scientific Exploration of the Mediterranean Sea |
| CNR | National Research Council of Italy |
| CNRS | French National Centre for Scientific Research |
| COSYNA | Coastal Observing System for Northern and Artic Seas |
| CPR | Continuous Plankton Recorder |
| ECV | Essential Climate Variables |
| EOV | Essential Oceanic Variables |
| EMODnet | European Marine Observation and Data Network |
| EuroGOOS | European Global Ocean Observation System |
| FCT | Portuguese Science and Technology Foundation |
| FOO | Framework for Ocean Observing |
| FOOS | Fishery and Oceanography Observing System, Italy |
| FOS | Fishery Observing System, Italy |
| FSU | Florida State University, USA |
| GEOMAR | GEOMAR Helmholtz Centre for Ocean Research Kiel, Germany |
| GCOS | Global Climate Observing System |
| GOOS | Global Ocean Observing System |
| GOSUD | Global Ocean Surface Underway |
| GRAs | GOOS Regional Alliances |
| HCMR | Hellenic Centre for Marine Research, Greece |
| HZG | Helmholtz-Zentrum Geesthacht, Germany |
| ICOADS | International Comprehensive Ocean-Atmosphere Data Set |
| IOCCP | International Ocean Carbon Coordination Project |
| IFREMER | French Research Institute for Exploitation of the Sea |
| IMOS | Australia’s Integrated Marine Observing System |
| INESC | Portuguese Institute for Systems Engineering and Computers |
| IOC | Intergovernmental Oceanographic Commission |
| IODE | International Oceanographic Data and Information Exchange |
| IPMA | Portuguese Institute for the Ocean and Atmosphere, Portugal |
| JAFIC | Japan Fisheries Information Service Center |
| JERICO | Joint European Research Infrastructure network for Coastal Observatories |
| JCOMM | Joint Technical Commission for Oceanography and Marine Meteorology |
| JCOMMOPS | JCOMM in situ Observing Platform Support Centre |
| MDC | Marine Data Center, FSU, USA |
| MONICAP | Continuous Fisheries Activity Monitoring—VMS, Portugal |
| NCDOT | North Carolina Department of Transportation, USA |
| NCRIS | National Collaborative Research Infrastructure Strategy |
| NOAA | National Oceanic and Atmospheric Administration, U.S. |
| PMEL | Pacific Marine Environmental Laboratory, USA |
| ROOS | Regional Operational Oceanographic System |
| SAMOS | Shipboard Automated Meteorological and Oceanographic System |
| SOOP | Ships of Opportunity Program |
| SSS-OS | French Sea Surface Salinity Observation Service |
| SYKE | Marine Research Centre at the Finnish Environment Institute |
| UN | United Nations |
| UNESCO | United Nations Educational, Scientific and Cultural Organization |
| US IOOS | U.S. Integrated Ocean Observing System |
| VOO | Vessels of Opportunity |
| VOS | Voluntary Observing Ships Program |
| WMO | World Meteorological Organization |
| VMS | Vessel Monitoring System |
References
- Allen, S.; Wild-Allen, K. Ocean In Situ Sampling and Interfaces with other Environmental Monitoring Capabilities. In Challenges and Innovations in Ocean In Situ Sensors. Measuring Inner Ocean Processes and Health in the Digital Age; Delory, E., Pearlman, J., Eds.; Elsevier: Amsterdem, The Netherlands, 2019; pp. 1–26. [Google Scholar]
- Smith, S.; Alory, G.; Andersson, A.; Asher, W.; Baker, A.; Berry, D.; Schuster, U.; Steventon, E.; Vinogradova-shiffer, N. Ship-based contributions to global ocean, weather, and climate observing systems. Front. Mar. Sci. 2019, 6, 434. [Google Scholar] [CrossRef] [Green Version]
- Task Team for an Integrated Framework for Sustained Ocean Observing. A Framework for Ocean Observing (FOO); UNESCO: Paris, France, 2012; IOC/INF-1284. [Google Scholar]
- Woodruff, S.; Diaz, H.; Worley, S.; Reynolds, R.; Lubker, S. Early ship observational data and ICOADS. Clim. Chang. 2005, 73, 169–194. [Google Scholar] [CrossRef]
- Freeman, E.; Woodruff, S.D.; Worley, S.J.; Lubker, S.J.; Kent, E.C.; Angel, W.E.; Berry, D.I.; Brohan, P.; Eastman, R.; Gates, L.; et al. ICOADS Release 3.0: A major update to the historical marine climate record. Int. J. Climatol. 2017, 37, 2211–2232. [Google Scholar] [CrossRef] [Green Version]
- Alory, G.; Delcroix, T.; Téchiné, P.; Diverrès, D.; Varillon, D.; Cravatte, S.; Gouriou, Y.; Grelet, J.; Jacquin, S.; Kestenare, E.; et al. The French contribution to the voluntary observing ships network of sea surface salinity. Deep Sea Res. Part I Oceanogr. Res. Pap. 2015, 105, 1–18. [Google Scholar] [CrossRef]
- Smith, S.R.; Briggs, K.; Bourassa, M.A.; Elya, J.; Paver, C.R. Shipboard automated meteorological and oceanographic system data archive: 2005–2017. Geosci. Data J. 2018, 5, 73–86. [Google Scholar] [CrossRef] [Green Version]
- Petersen, W. FerryBox systems: State-of-the-art in Europe and future development. J. Mar. Syst. 2014, 140, 4–12. [Google Scholar] [CrossRef] [Green Version]
- Hydes, D.; Kelly-Gerreyn, A.; Colijn, F.; Petersen, W.; Schroeder, F.; Mills, D.K.; Durand, D.; Wehde, H.; Sorensen, K.; Morrison, G. The Way Forward in Developing and Integrating Ferry-Box Technologies. In Proceedings of the OceanObs ’09: Sustained Ocean Observations and Information for Society (Vol. 2), Venice, Italy, 21–25 September 2009; Hall, J., Harrison, D.E., Stammer, D., Eds.; WPP-306; ESA Publication: Auckland, New Zealand, 2010. [Google Scholar] [CrossRef] [Green Version]
- Petersen, W.; Colijn, F.; Gorringe, P.; Kaitala, S.; Karlson, B.; King, A.; Lips, U.; Ntoumas, M.; Seppälä, J.; Sørensen, J.; et al. FerryBoxes within Europe: State-of-the-art and Integration in the European Ocean Observation System (EOOS). In Operational Oceanography Serving Sustainable Marine Development, Proceedings of the Eight EuroGOOS International Conference, Bergen, Norway, 3–5 October 2017; Buch, E.V., Fernández, D., Eparkhina, P., Gorringe, G., Nolan, G., Eds.; EuroGOOS: Brussels, Belgium, 2018; pp. 63–70. [Google Scholar]
- Paerl, H.W.; Rossignol, K.L.; Guajardo, R.; Hall, N.; Joyner, A.R.; Peierls, B.L.; Ramus, J.S. FerryMon: Ferry Based Monitoring and Assessment of Human and Climatically Driven Environmental Change in the Albamarle-Pamlico Sound System. Environ. Sci. Technol. 2009, 43, 7609–7613. [Google Scholar] [CrossRef] [Green Version]
- Halverson, M.J.; Pawlowicz, R. High-resolution observations of chlorophy-a biomass from an instrumented ferry: Influence of the Fraser River plume from 2003 to 2006. Cont. Shelf Res. 2013, 59, 52–64. [Google Scholar] [CrossRef]
- Martinelli, M.; Guicciardi, S.; Penna, P.; Belardinelli, A.; Croci, C.; Domenichetti, F.; Santojanni, A.; Sparnocchia, S. Evaluation of the oceanographic measurement accuracy of different commercial sensors to be used on fishing gears. Ocean Eng. 2016, 111, 22–33. [Google Scholar] [CrossRef]
- Leblond, E.; Lazure, P.; Laurans, M.; Rioual, C.; Woerther, P.; Quemener, L.; Berthou, P. The RECOPESCA project: A new example of participative approach to collect fisheries and in situ environmental data. Mercator Ocean. Q. Newsl. 2010, 37, 40–48. [Google Scholar]
- Choquer, M.; Blouch, P.; Gaillard, F.; Reynaud, T.; Reverdin, G.; Metzl, N.; Kramp, M.; Branellec, P.; Diverrès, D. The OceanoScientific® Programme: Scientific Data Acquisition by Sailing Ships. In Proceedings of the TECO-2014 WMO Technical Conference on Meteorological and Environmental Instruments and Methods of Observation, Saint Petersburg, Russian, 7–9 July 2014. [Google Scholar]
- Patti, B.; Martinelli, M.; Aronica, S.; Belardinelli, A.; Penna, P.; Bonanno, A.; Basilone, G.; Fontana, I.; Giacalone, G.; Gabriele Gallì, N.; et al. The Fishery and Oceanography Observing System (FOOS): A tool for oceanography and fisheries science. J. Oper. Oceanogr. 2016, 9, 99–118. [Google Scholar] [CrossRef] [Green Version]
- Salat, J.; Umbert, M.; Ballabrera-Poy, J.; Fernández, P.; Salvador, K.; Martínez, J. The contribution of the Barcelona World Race to improved ocean surface information. A validation of the SMOS remotely sensed salinity. Contrib. Sci. 2013, 9, 89–100. [Google Scholar]
- Yamanaka, I.; Ito, S.; Niwa, K.; Tanake, R.; Yabuta, Y.; Chikuni, S. The fisheries forecasting system in Japan for coastal pelagic fish. FAO Fish. Tech. Pap. 1988, 301, 72. [Google Scholar]
- Santos, A.M.P. Fisheries oceanography using satellite and airborne remote sensing methods: A review. Fish. Res. 2000, 49, 1–20. [Google Scholar] [CrossRef]
- Kent, E.C.; Taylor, P.K.; Truscott, B.S.; Hopkins, J.S. The accuracy of Voluntary Observing Ships’ meteorological observations—Results of the VSOP-NA. J. Atmos. Oceanic. Technol. 1993, 10, 591–608. [Google Scholar] [CrossRef]
- Guedes Soares, C. Assessment of the Uncertainty in Visual Observations of Wave Height. Ocean Eng. 1986, 13, 37–56. [Google Scholar] [CrossRef]
- Guedes Soares, C. Calibration of Visual Observations of Wave Period. Ocean Eng. 1986, 13, 539–547. [Google Scholar] [CrossRef]
- Hogben, N.; Da Cunha, L.F.; Oliver, H.N. Global Wave Statistics; Unwin Brothers Limited: London, UK, 1986. [Google Scholar]
- Gulev, S.K.; Grigorieva, V.; Sterl, A.; Woolf, D. Assessment of the reliability of wave observations from voluntary observing ships: Insights from the validation of a global wind wave climatology based on voluntary observing ship data. J. Geophys. Res. Oceans. 2003, 108, 3236. [Google Scholar] [CrossRef] [Green Version]
- Vettor, R.; Guedes Soares, C. Detection and analysis of the main routes of voluntary observing ships in the North Atlantic. J. Navig. 2015, 68, 397–410. [Google Scholar] [CrossRef] [Green Version]
- Vettor, R.; Guedes Soares, C. Development of a ship weather routing system. Ocean Eng. 2016, 123, 1–14. [Google Scholar] [CrossRef]
- Vettor, R.; Guedes Soares, C. Assessment of the storm avoidance effect on the wave climate along the main North Atlantic routes. J. Navig. 2016, 69, 127–144. [Google Scholar] [CrossRef] [Green Version]
- Vettor, R.; Guedes Soares, C. Rough Weather Avoidance Effect on the Wave Climate Experienced by Oceangoing Vessels. Appl. Ocean Res. 2016, 59606, 615. [Google Scholar] [CrossRef]
- Laurs, R.M.; Fiúza, A.F.G.; Santos, A.M.P. Plan for Satellite Remote Sensing Applications to Portuguese Fisheries; SATOCEAN Technical Report (1); Relatório Técnico (1/89); Grupo de Oceanografia, Departamento de Física/Centro de Geofísica, Universidade de Lisboa: Lisboa, Portugal, 1989; p. 12. [Google Scholar]
- Santos, A.M.P.; Fiúza, A.F.G.; Laurs, R.M. Influence of SST on catches of swordfish and tuna in the Portuguese domestic longline fishery. Int. J. Remote Sens. 2006, 27, 3131–3152. [Google Scholar] [CrossRef]
- Santos, A.M.P.; Oliveira, L.; Aurélio, J. BASBLACK Project: An example of Good Collaboration between Scientists and Fishermen. ICES CM 1999/Q:08. In Proceedings of the Contributions to the 1999 ICES Annual Science Conference, Stockholm, Sweden, 27 September–6 October 1999; p. 44. Available online: https://www.ices.dk/Science/publications/Documents/CM-documents/CM%20Documents%201999.pdf (accessed on 29 March 2021).
- Moreira, F. O projeto MONICAP. Rev. Mar. 2018, 1002, 42–43. [Google Scholar]
- Fonseca, T.; Campos, A.; Afonso-Dias, M.; Fonseca, P.; Pereira, J. Trawling for cephalopods off the Portuguese coast—Fleet dynamics and landings composition. Fish. Res. 2008, 92, 180–188. [Google Scholar] [CrossRef]
- Pilar-Fonseca, T.; Pereira, J.; Campos, A.; Moreno, A.; Fonseca, P.; Afonso-Dias, M. VMS-based fishing effort and population demographics for the European squid (Loligo vulgaris) off the Portuguese coast. Hydrobiologia 2014, 725, 137–144. [Google Scholar] [CrossRef]
- Pilar-Fonseca, T.; Campos, A.; Pereira, J.; Moreno, A.; Lourenço, S.; Afonso-Dias, M. Integration of fishery-dependent data sources in support of octopus spatial management. Mar. Policy 2014, 45, 69–75. [Google Scholar] [CrossRef]
- Pascoal, R.; Guedes Soares, C. Non-Parametric Wave Spectral Estimation Using Vessel Motions. Appl. Ocean Res. 2008, 30, 46–53. [Google Scholar] [CrossRef]
- Pascoal, R.; Guedes Soares, C. Kalman Filtering of Vessel Motions for Ocean Wave Directional Spectrum Estimation. Ocean Eng. 2009, 36, 477–488. [Google Scholar] [CrossRef]
- Perera, L.; Rodrigues, J.M.; Pascoal, R.; Guedes Soares, C. Development of an onboard decision support system for ship navigation under rough weather conditions. In Sustainable Maritime Transportation and Exploitation of Sea Resources; Rizzuto, E., Guedes Soares, C., Eds.; Taylor & Francis Group: London, UK, 2012; pp. 837–844. [Google Scholar]
- Rodrigues, J.M.; Perera, L.; Guedes Soares, C. Decision support system for the safe operation of fishing vessels in waves. In Maritime Technology and Engineering, 1st ed.; Guedes Soares, C., Garbatov, Y., Sutulo, S., Santos, T.A., Eds.; Taylor & Francis Group: London, UK, 2012; pp. 153–161. [Google Scholar]
- Hinostroza, M.A.; Guedes Soares, C. Parametric estimation of the directional wave spectrum from ship motions. Int. J. Marit. Eng. 2016, 158, A121–A130. [Google Scholar] [CrossRef]
- Pascoal, R.; Perera, L.P.; Guedes Soares, C. Estimation of directional sea spectra from ship motions in sea trials. Ocean Eng. 2017, 132, 126–137. [Google Scholar] [CrossRef]
- Santos, A.M.; Lourenço, N.; Carvalho, A.; Sousa Pinto, I.; Oliveira, A. OBSERVA.PT: Observations on board national commercial ships to support the conservation of marine biodiversity in the Portuguese Seas. OceanObs’19 2018. [Google Scholar] [CrossRef]
- Guedes Soares, C.; Rusu, L.; Bernardino, M.; Pilar, P. An Operational Forecasting System for the Portuguese Continental Coastal Area. J. Oper. Oceanogr. 2011, 4, 17–27. [Google Scholar] [CrossRef] [Green Version]
- Rusu, L.; Guedes Soares, C. Forecasting fishing vessel responses in coastal areas. J. Mar. Sci. Technol. 2014, 19, 215–227. [Google Scholar] [CrossRef]
- Rusu, L.; Guedes Soares, C. Local data assimilation scheme for wave predictions close to the Portuguese ports. J. Oper. Oceanogr. 2014, 7, 45–57. [Google Scholar] [CrossRef] [Green Version]
- Almeida, S.; Rusu, L.; Guedes Soares, C. Data assimilation with the ensemble Kalman filter in a high-resolution wave forecasting model for coastal areas. J. Oper. Oceanogr. 2016, 9, 103–114. [Google Scholar] [CrossRef]
- Costa, T.C.; Pereira, L.T.; Marta-Almeida, M.; Guedes Soares, C. Mapping of currents off the Northwestern Iberian coast with the Regional Ocean Modelling System. J. Oper. Oceanogr. 2020, 13, 71–83. [Google Scholar] [CrossRef]
- Bettencourt, J.H.; Guedes Soares, C. Surface circulation in the Eastern Central North Atlantic. In Developments in Maritime Technology and Engineering; Guedes Soares, C., Santos, T.A., Eds.; Taylor and Francis: London, UK, 2021. [Google Scholar]
- Liu, Y.H.; Kerkering, H.; Weisberg, R.H. Introduction to Coastal Ocean Observing Systems. In Coastal Ocean Observing Systems; Liu, Y., Kerkering, H., Weisberg, R.H., Eds.; Academic Press: London, UK, 2015; pp. 1–10. [Google Scholar]
- Izquierdo, P.; Guedes Soares, C.; Fontes, J.B. Monitoring of Waves with X- Band Radar in the Port of Sines. In Building the European Capacity in Operational Oceanography; Dahlin, H., Flemming, N.C., Nittis, K., Petersson, S.E., Eds.; Elsevier: Amsterdam, The Netherlands, 2003; pp. 154–160. [Google Scholar]
- Izquierdo, P.; Guedes Soares, C.; Nieto Borge, J.C.; Rodriguez, G.R. A Comparison of Sea State Parameters from Nautical Radar Images and Buoy Data. Ocean Eng. 2004, 31, 2209–2225. [Google Scholar] [CrossRef]
- Izquierdo, P.; Guedes Soares, C. Analysis of Sea Waves and Wind from X- Band Radar. Ocean Eng. 2005, 32, 1404–1409. [Google Scholar] [CrossRef]
Figure 1.
The Autonomous Observing System (AOS) Scheme.

Figure 2.
Undersee box installed on the RV Diplodus deck.

Figure 3.
Schematics of the measurement system: on the left the FerryBox that received GPS positioning information and transmit oceanographic data via 3G to the Undersee-cloud; in the middle the gyrocompass and motion sensor; and on the right the meteorological station and datalogger. The latter two equipment are connected to a PC that send the data to the Undersee-cloud via 3G.

Figure 4.
Testing area.

Figure 5.
(a) User interface of the Undersee data acquisition system; (b) Example of preliminary processed data.
Figure 5.
(a) User interface of the Undersee data acquisition system; (b) Example of preliminary processed data.

Figure 6.
User interface of the data acquisition system (in [40]).
Figure 6.
User interface of the data acquisition system (in [40]).

Table 1.
Main characteristics of some example programs involving Vessels of Opportunity (VOO).
| Program/Project | Main Entities Involved | Start | Main Observation Zones | Type of Ships | Main Measured and Derived Parameters | References |
|---|---|---|---|---|---|---|
| Continuous Plankton Recorder (CPR) | Marine Biological Association; Global Alliance of CPR Surveys | 1931 | Seas and oceans around the world | Merchant, RoRo, Container ships; Large sailing vessels; Fishing boats; Super tankers. | Plankton | https://www.cprsurvey.org; www.globalcpr.org |
| PMEL Carbon Program | PMEL; NOAA; IOCCP | 1992 | Pacific Ocean | Container vessels; Research | pCO2 | https://www.pmel.noaa.gov/co2 |
| Oleander | Rhode Island and New York Universities; NOAA | 1992 | Gulf Stream (New Jersey; Bermuda) | Container vessel (CMV Oleander) | Currents; SST; SSS; CO2 | http://www.po.gso.uri.edu/rafos/research/ole/ |
| International SeaKeepers Society | Non profit and Government Organizations; Academic Communities and the Public | 1998 | Seas and oceans around the world | Yatchs | e.g., Temperature; pH; Salinity, Nutrients, Chlorophyll; Dissolved Oxygen | https://www.seakeepers.org/ |
| FerryMon | Paerl Lab; University of North Carolina | 1999 | Neuse River Estuary (North Carolina) | NCDOT Ferries | Water Quality Parameters | http://paerllab.web.unc.edu/projects/ferrymon/; [11] |
| STRATOGEM | NSERC; British Columbia and Vitoria Universities | 2002 | Fraser River; Strait of Georgia | Ferries | Salinity; Chlorophyll-a | www.stratogem.ubc.ca; [12] |
| RECOPESCA | IFREMER | 2005 | Atlantic Coast; Caribbean Islands | Fishing vessels | Temperature; Salinity Turbidity; Fishing effort | [13,14] |
| AOOS | US IOOS; NOAA | 2005 | Alaska | Ferries | Temperature; Salinity; Dissolved Oxigen; CO2 | https:/aoos.org/alaska-ocean-acidification-network/monitoring/ship-based-monitoring/ |
| IMOS Ships of Opportunity Facility | NCRIS; CSIRO; University of Tasmania; IMOS | 2006 | Australian regional seas; New Zealand; Southern Ocean | Ferries; Commercial; Research vessels | CO2; Plankton; Temperature; Salinity; Chlorophyll-a; Turbidity; Bioacoustic data | http://imos.org.au/facilities/shipsofopportunity/ |
| OceanoScientific® Programme | IFREMER, MétéoFrance; LOCEAN (IPSL-INSU/CNRS, GEOMAR (Germany); Maine University | 2006 | Seas and oceans around the world (e.g. North Atlantic); Drake Passage, Cape Horn, Antarctic, South Pacific) | Small sailing vessels | Wind; Air Relative Humidity; Air Temperature; Sea Level Pressure; SST, SSS; pCO2; Fluorescence, pH | 14-05-15-TECO14-OceanoScientific (wmo.int); [15] |
| Foundation Tara Ocean | Public Interest Foundation (France); Special Observer at the UN | 2006 | World wide | Research Schooner Tara | e.g., data from Flowcams, CTD, Flowcytobots, Underwater Video Profiler (UVP), Plankton Nets | https://oceans.taraexpeditions.org/en/ |
| FOS/FOOS | CNR | 2007 | Adriatic Sea; Strait of Sicily | Fishing vessel | Navigation information; Geo-referenced Catches; Depth; Temperature for each Fishing Haul; Meteorological Parameters; State of the Sea | [16] |
| TRANSMED/PartnerSHIPS Programmes | CIESM | 2010 | Mediterranean | Merchant vessels | e.g., Temperature; Salinity; Oxygen; pCO2; Chlorophyll | www.ifremer.fr/transmed/ |
| Sailing vessels as VOO | Volvo Cars NOAA; JCOMMOPS (UNESCO-IOC), GEOMAR | 2017- | Racing zones | Sailing vessels | e.g., Salinity, pCO2, Dissolved CO2; Chlorophyll-a; Plankton | e.g., https://www.volvooceanrace.com/en/news/10225_What-is-the-Science-Programme.html; [17] |
Table 2.
Essential Ocean Variables are identified by the Global Ocean Observing System (GOOS).
| Physics | Biogeochemistry | Biology and Ecosystems |
|---|---|---|
| Sea state | Oxygen | Phytoplankton biomass and diversity |
| Ocean surface stress | Nutrients | Zooplankton biomass and diversity |
| Sea ice | Inorganic carbon | Fish abundance and distribution |
| Sea surface height | Transient tracers | Marine turtles, birds, mammals abundance and distribution |
| Sea surface temperature | Particulate matter | Hard coral cover and composition |
| Subsurface temperature | Nitrous oxide | Seagrass cover and composition |
| Surface currents | Stable carbon isotopes | Macroalgal canopy cover and composition |
| Subsurface currents | Dissolved organic carbon | Mangrove cover and composition |
| Sea surface salinity | Microbe biomass and diversity (*emerging) | |
| Subsurface salinity | Invertebrate abundance and distribution (*emerging) | |
| Ocean surface heat flux | ||
| Cross-disciplinary | ||
| Ocean color | ||
| Ocean sound | ||
Publisher’s Note: MDPI stays neutral with regard to jurisdictional claims in published maps and institutional affiliations. |
© 2021 by the authors. Licensee MDPI, Basel, Switzerland. This article is an open access article distributed under the terms and conditions of the Creative Commons Attribution (CC BY) license (https://creativecommons.org/licenses/by/4.0/).
Share and Cite
MDPI and ACS Style
Rosa, T.L.; Piecho-Santos, A.M.; Vettor, R.; Guedes Soares, C. Review and Prospects for Autonomous Observing Systems in Vessels of Opportunity. J. Mar. Sci. Eng. 2021, 9, 366. https://doi.org/10.3390/jmse9040366
AMA Style
Rosa TL, Piecho-Santos AM, Vettor R, Guedes Soares C. Review and Prospects for Autonomous Observing Systems in Vessels of Opportunity. Journal of Marine Science and Engineering. 2021; 9(4):366. https://doi.org/10.3390/jmse9040366
Chicago/Turabian StyleRosa, Teresa L., A. Miguel Piecho-Santos, Roberto Vettor, and C. Guedes Soares. 2021. "Review and Prospects for Autonomous Observing Systems in Vessels of Opportunity" Journal of Marine Science and Engineering 9, no. 4: 366. https://doi.org/10.3390/jmse9040366
Note that from the first issue of 2016, this journal uses article numbers instead of page numbers. See further details here.