Article

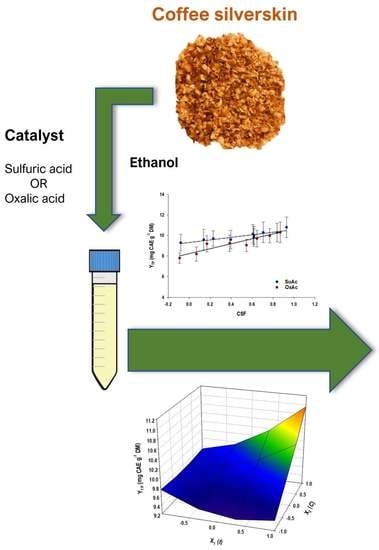
Recovery of Polyphenolic Antioxidants from Coffee Silverskin Using Acid-Catalyzed Ethanol Organosolv Treatment

by
George Smyrnakis
,
George Stamoulis
,
Dimitrios Palaiogiannis
,
Theodoros Chatzimitakos
,
Vassilis Athanasiadis
,
Stavros I. Lalas
and
Dimitris P. Makris
*
Green Processes & Biorefinery Group, Department of Food Science & Nutrition, School of Agricultural Sciences, University of Thessaly, N. Temponera Street, 43100 Karditsa, Greece
*
Author to whom correspondence should be addressed.
ChemEngineering 2023, 7(4), 72; https://doi.org/10.3390/chemengineering7040072
Submission received: 9 June 2023 / Revised: 31 July 2023 / Accepted: 9 August 2023 / Published: 12 August 2023
(This article belongs to the Special Issue Thermal Treatment of Biomass and Solid Municipal Waste)

Abstract

:
The examination presented herein sought to establish a novel methodology for the efficient recovery of polyphenolic antioxidants from coffee processing residues, namely coffee silverskin (CSS). The process developed was an ethanol-based organosolv treatment, assisted by acid catalysis, using sulfuric acid or oxalic acid as the catalyst. The first approach was modeling treatment based on severity, where it was found that treatment dependence on time and temperature may well be described by linear relationships. Response surface methodology was then deployed as a consecutive stage, to optimize treatments with regard to catalyst concentration and resident time. In this case, again, linear models could effectively predict polyphenol recovery yield (YTP). For the sulfuric-acid-catalyzed treatment, the maximum theoretic YTP was found to be 10.95 ± 0.44 mg caffeic acid equivalent (CAE) g−1 DM, achieved at CSuAc = 1.5% and t = 300 min. On the other hand, the maximum YTP of 10.30 ± 0.53 could be attained at COxAc = 4%, and t = 300 min. Considering treatment severity, it was concluded that the use of oxalic acid, a food-grade organic acid, instead of sulfuric acid, a corrosive acid, would afford equivalent effects at lower severity. The high-performance liquid chromatography analyses also revealed that the extract produced through the oxalic-acid-catalyzed treatment was more enriched in neochlorogenic and chlorogenic acids, and it exhibited stronger antiradical activity, but weaker ferric-reducing effects. It is proposed that the methodology developed may contribute towards the use of coffee processing wastes as potential sources of bioactive ingredients and the design of novel functional products, in the frame of a more sustainable strategy for coffee processing companies.

Graphical Abstract

1. Introduction

The waste biomass generated from agricultural practices and food industry processes is characterized by a high load of bio-organic substances, with significant polluting potential. If this material is improperly treated, its uncontrolled dumping may entail severe environmental risks, with associated hazards to public health. The implementation of adequate technologies for pollution minimization aims at destroying heavily polluting wastes, yet contemporary strategies embracing biorefinery technologies within circular economy frames strongly dictate the valorization of agricultural and food processing residues. This concept channels waste side streams into routes where wastes represent novel raw materials to produce a spectrum of high-value-added compounds, platform chemicals, and/or energy [1,2].
Coffee is globally a highly consumed beverage, with an ever-increasing regular consumption. Major coffee production is based on the plant species Coffea arabica and Coffea canephora, collectively known as arabica and robusta coffees, respectively. Coffee production generates a vast amount of residues (e.g., defective beans, husks, coffee silverskin, hulls, and spent coffee grounds), which may be a source of ecosystem pollution and an important environmental problem [3,4]. Coffee silverskin (CSS) is a thin tegument covering the coffee seed, which detaches during the roasting process as coffee beans expand. Thus, CSS is the main byproduct of the coffee roasting process [4]. Compared to other coffee byproducts, CSS is a relatively stable material due to its lower moisture content (5–7%), and it is mainly exploited as fuel and for fertilizer production through composting.
On the other hand, CSS may be regarded as a good resource of bioactive compounds, which can be recovered through extraction and used in cosmetic, food, and pharmaceutical products [5]. The major polyphenols encountered in CSS are chlorogenic acids, which are hydroxycinnamate derivatives with notable biological activities, including neuroprotective and cardioprotective effects, [6], but also effects on metabolic syndrome and antimicrobial and antioxidant activities [7]. Therefore, it is not surprising that several recent investigations have focused on the use of coffee waste materials to produce extracts enriched in chlorogenates [3]. These techniques may encompass both conventional and emerging processes, such as stirred tank, solid–liquid extraction, subcritical water extraction, ultrasound-assisted extraction, pulsed-electric-field extraction, and microwave-assisted extraction [8].
Several plant tissues (i.e., peels, leaves, seeds, bran) are complex matrices involving recalcitrant bio-polymers, such as pectins and lignocellulosic material. Such networks may act as barriers in retrieving polyphenolic compounds because they hinder polyphenol entrainment into the liquid phase, slowing down the diffusion rate. On the other hand, some polyphenolic constituents may be covalently bound onto polysaccharide chains, and their liberation would require far more drastic conditions than those usually employed in a common, conventional extraction process. Thus, techniques that would contribute towards (i) disintegrating complex matrices (lignocellulose) and (ii) breaking down bonds between polyphenols and polysaccharides and/or lignin could boost polyphenol release and recovery, significantly increasing extraction yield.
As they entail treating the lignocellulosic material to organic solvent/water combinations at relatively increased temperatures for a specific resident time, the maxima of which are interdependent [9,10], organosolv processes may be particularly promising in this context. The efficiency of these procedures, which depend on rupturing ester and ether bonds, such as those involved in polysaccharide/lignin complexes, may be considerably improved by the inclusion of catalysts (e.g., sodium hydroxide, sulfuric acid). The deployment of a pertinent methodology has been recently found to be of high performance in extracting polyphenols from spent coffee waste [11].
In this regard, applying an organosolv treatment to target polyphenol recovery from CSS would appear as a challenging prospect. This being the case, this study was undertaken to develop an ethanol-based organosolv process, which aimed at optimizing antioxidant polyphenol recovery from CSS. Ethanol was chosen because of its green character, availability and relatively low cost. Furthermore, sulfuric acid and oxalic acid were preferred as high-efficiency catalysts in biomass decomposition [12], and process evaluation was based on models including severity and response surface methodology. The appraisal of the extracts generated was based on polyphenol profiling by high-performance liquid chromatography (HPLC), and antioxidant activity determination. As far as the authors are aware, such an investigation on CSS is described for the first time.

2. Materials and Methods

2.1. Chemicals and Reagents

L-Ascorbic acid was from Carlo Erba (Milano, Italy). Sodium carbonate anhydrous was from Penta (Prague, Czech Republic). Oxalic acid, neochlorogenic acid (≥98%) and chlorogenic acid (≥95%) were from Sigma-Aldrich (Steinheim, Germany). Iron(III) chloride hexahydrate (FeCl3•6H2O) was from Merck (Darmstadt, Germany). Gallic acid monohydrate (≥98%), Folin–Ciocalteu reagent and absolute ethanol were from Panreac (Barcelona, Spain). 2,4,6-Tris(2-pyridyl)-s-triazine (TPTZ) was from Fluka (Steinheim, Germany). 2,2-Diphenyl-1-picrylhydrazyl (DPPH) was from Alfa Aesar (Karlsruhe, Germany). HPLC solvents were used for all chromatographic analyses.

2.2. Coffee Silverskin

Coffee silverskin (CSS), obtained directly after industrial toasting of arabica coffee, was kindly provided by Coffee Island (Patra, Greece). The material received was in air-tight packaging, and it was soon comminuted in a laboratory table mill. The comminuted CSS was sieved and powdered, and particles of diameter ≤ 0.5 mm were selected for the organosolv treatments.

2.3. Hydroethanolic Solvent Testing and Organosolv Treatments

Initially, the effectiveness of polyphenol recovery from CSS was assayed using water/ethanol solvent systems at varying proportions. The composition of the systems tested was from 20 to 80% ethanol (v/v), while water and pure ethanol were used for control extractions. A Duran™ vial of 25 mL volume was used as the extractor and the process was accomplished by mixing 2 g of comminuted CSS with 20 mL of solvent. Then, the mixture was placed on a temperature-controlled hotplate stirrer (Witeg, Wertheim, Germany) at a stirring speed of 500 rpm, for 180 min, at a constant temperature of 80 °C. This temperature was the highest safe limit to avoid reaching the boiling point of the solvent, given that the solvent systems tested were ethanol mixtures. The organosolv treatments were performed by incorporating acid catalyst into the hydroethanolic solvents. The two catalysts tested were sulfuric acid, at concentrations (CSuAc) of 0.5, 1, and 1.5% (w/v), and oxalic acid, at concentrations (COxAc) of 4, 8, and 12% (w/v). Thus, a set of combinations of acid catalyst concentration and treatment duration (60, 180, and 300 min) was used to achieve different severity levels.

2.4. Treatment Severity Determination

Severity determination was computed taking into consideration the resident time and temperature of the treatment, as follows [13,14]:
R o = t   ×   e T 100 14.75
SF = logRo
The SF value is the severity factor, Ro the severity, 100 °C the reference temperature, t the resident time (min), and T the treatment temperature (°C). The value 14.75 represents an empirical parameter related to temperature and activation energy. The combined severity factor (CSF), which is an extended form of SF, can be estimated by considering the pH of the solvent used, which may also be implicated in the disintegration of the biomatrix treated (CSS) [15]:
R o = 10 pH   ×   t   ×   e T 100 14.75
CSF = logRo′ − pH
Another measure of treatment severity is an alternative form of CFS, termed as CSF′, which was argued to provide a fairer severity value for treatments performed at greatly different pH values [15]:
CSF′ = logRo + |pH − 7|

2.5. Response Surface Treatment Optimization

By considering acid catalyst concentration, CSuAc or COxAc, and resident time, t, as the independent (treatment) variables, and the yield in total polyphenol as the response, optimization of the organosolv treatment was accomplished by deploying a response surface methodology on the basis of a central composite experimental design, including in total 11 design points and 3 central points. Treatment variables were codified in 3 levels, −1, 0 and 1, as previously described in detail [16]. Treatment variable levels in both actual and codified form are displayed in Table 1. Variable ranges were chosen by carrying out preliminary experiments and by considering the relevant literature [11]. The overall model significance (R2, p) and the significance of the individual coefficients of the models derived was appraised by performing lack-of-fit and ANOVA tests, considering a minimum significance level of 95%.

2.6. Total Polyphenol Measurement and Antioxidant Activity Tests

A previously established Folin–Ciocalteu protocol was used to measure total polyphenols [17]. Results were reported as mg caffeic acid equivalent (CAE) per g dry mass (DM). Assays for ferric-reducing power (PR) and antiradical activity (AAR) analysis were reported in detail elsewhere [18]. Results were reported as μmol ascorbic acid equivalent (AAE) per g DM and μmol DPPH per g DM, respectively.

2.7. Determination of the Analytical Polyphenolic Composition

The chromatographic determinations were accomplished as given in detail in a previous examination [19]. Quantitations were performed with the external standard method, using calibration curves of neochlorogenic acid (R2 = 0.9980) and chlorogenic acid (R2 = 0.9990), at 320 nm. The concentration ranges employed for both polyphenols were from 5 to 50 μg mL−1. Stock solutions were prepared in HPLC-grade methanol and stored at −40 °C.

2.8. Statistical Analysis

Linear regressions were handled using SigmaPlot™ 12.5 (Systat Software Inc., San Jose, CA, USA). JMP™ Pro 13 software (SAS, Cary, NC, USA) was used to perform distribution analysis, build the experimental design, and implement response surface methodology. The statistics pertaining to response surface methodology (analysis of variance, lack-of-fit) were also computed by JMP™ Pro 13. All treatments were conducted at least twice, and the analytical measurements in triplicate. Values were reported as average ± standard deviation.

3. Results and Discussion

3.1. Effect of Ethanol Concentration

Initially, an assay was carried out to identify the optimum ethanol concentration with regard to polyphenol recovery from CSS. To this end, hydroalcoholic solutions with increasing ethanol concentration were tested, and the results obtained are illustrated in Figure 1. A 60% solution was shown to express significantly higher extraction capacity (p < 0.05), as opposed to 100% ethanol, which was the least effective. Therefore, further treatment development was based on the 60% mixture.

3.2. Effect of Acid Catalyst—Treatment Severity

Two acids were tested as catalysts, sulfuric acid and oxalic acid. Sulfuric acid was selected because it is a strong inorganic acid (pKa = −10) with very wide applicability and high efficiency in various organosolv processes [20]. On the other hand, oxalic acid was chosen because it is a naturally occurring organic acid, which possesses a particularly low first dissociation constant (pKa1 = 1.27), and it is far stronger than other commonly encountered natural acids, such as citric acid (pKa1 = 3.13) or acetic acid (pKa = 4.80). Moreover, oxalic acid has also been used as a mild and efficient acid catalyst in organosolv treatments [21]. On these grounds, CSS treatments were performed with 60% ethanol/water mixtures, containing varying concentrations of either acid, as presented in Table 2 and Table 3. The organosolv treatments included processing of CSS at variable severities, to test the ability of the selected solvent systems to recover polyphenols.
For the sulfuric-acid-catalyzed treatment, it was found that attaining significantly higher YTP (p < 0.05) required a CSF of at least 0.71 and a CSF′ of 7.71, which corresponded to treatment with CSuAc = 1.5% for 180 min. Under these conditions, the YTP found was 10.33 mg CAE g−1 DM (Table 2). Previous examinations on a similar material, spent coffee waste, showed that the optimum sulfuric acid concentration was indeed 1.5%, but the maximum YTP was achieved at 51 °C for 45 min, using a 68% hydroethanolic solution [11]. Furthermore, ethanol organosolv treatment of wheat bran afforded a maximum YTP at CSF and CSF′ levels of 0.93 and 7.93, respectively, which corresponded to 1.5% sulfuric acid and a resident time of 300 min [22].
In the case of oxalic-acid-catalyzed treatment, significantly higher YTP (p < 0.05) of 10.16 mg CAE g−1 DM could be achieved at a CSF of 0.61 and CSF′ of 7.61 (Table 3). These data suggested that when using a benign natural chemical such as oxalic acid, instead of the corrosive sulfuric acid, a virtually equal total polyphenol yield may be acquired, even at slightly lower severity.
To identify any possible trend relating severity with YTP, regressions were accomplished between CSF and CSF′ values with YTP. From this analysis, it was found that linear models may well describe the relevant correlations (Figure 2). These models were as follows:
YTP(SuAc) = 1.25CSFSuAc + 9.32 (R2 = 0.83, p = 0.0006)
YTP(SuAc) = 1.25CSF′SuAc + 0.60 (R2 = 0.83, p = 0.0006)
YTP(OxAc) = 2.40CSFOxAc + 8.23 (R2 = 0.85, p = 0.0004)
YTP(OxAc) = 2.40CSF′OxAc − 8.58 (R2 = 0.85, p = 0.0004)
Based on the above models, it was evident that an increased total polyphenol yield could be achieved by increasing the severity, and this could be accomplished either by switching catalyst concentration or resident time. Thus, these two parameters may be interchangeably adjusted as desired. The direct correlation between severity and total polyphenol yield has recently been reported for polyphenol extraction from wheat bran using pressurized water/ethanol mixtures [23]. The latter Studies on wheat bran were in concurrence, demonstrating a direct effect of acid/alkaline ethanol organosolv treatment severity on total polyphenol yield [22]. The same conclusion was drawn from glycerol and deep eutectic solvent organosolv treatment of onion solid wastes, where YTP was directly proportional to CSF [24].
The YTP of around 10 mg CAE g−1 DM attained with either acid catalysis in this examination was of comparable magnitude to 12 mg gallic acid equivalent (GAE) g−1 DM achieved with conventional extraction using 50% ethanol [25] and 13.72 mg GAE g−1 DM achieved with pulsed-electric-field-assisted extraction using water/ethanol as the solvent [26]. Conventional water/ethanol extraction of CSS also gave an optimum yield of 13 mg GAE g−1 DM [27]. However, other investigations employing water/ethanol solvent reported a YTP level of 7.22 mg GAE g−1 DM [28]. Ultrasound-assisted extraction with water/methanol mixtures afforded yields within the range of 5.80–8.94 mg GAE g−1 DM [29], but levels of 19.17 mg GAE g−1 DM could be obtained with mild hydrothermal treatment of CSS [30]. On the other hand, a significantly higher yield of 35 mg GAE g−1 DM [31] and far greater levels of 93.83 mg GAE g−1 DM [32] have been reported for subcritical water extraction of CSS. A similar yield of 93.55 mg GAE g−1 DM could be acquired using water/ethanol mixtures and room-temperature ultrasonication [33].

3.3. Treatment Optimization by Response Surface

The evidence from the models based on severity suggested that equal effects may be exerted by various combinations of acid concentration and resident time. Therefore, in order to determine the optimum conditions that would provide a maximized response (YTP), response surface optimization was designed and deployed. The purpose was also to detect possible cross (synergistic) effects between the independent variables (acid catalyst concentration, C, and resident time, t) and come up with a more credible model for the organosolv treatment. The evaluation of the models (mathematical equations) derived from the response surface methodology was based on a lack-of-fit test and analysis of variance (ANOVA) (Figure 3 and Figure 4), on the grounds of the closeness of the predicted and measured YTP values (Table 4).
The models were represented by equations composed of significant terms only (Figure 3 and Figure 4, inset table “Parameter estimates”), while non-significant terms were excluded. The square correlation coefficients of the models, as well as the accompanying statistical information for each individual term, may be seen in Figure 3A and Figure 4A and in the inset tables provided. The final form of the models was as follows:
YTP(SuAc) = 9.68 + 0.23X1 + 0.39X2 + 0.38X1X2
YTP(OxAc) = 8.99 + 0.82X1 + 0.27X2 + 0.46X22
Both models exhibited R2 equal to or higher than 0.92, and, based on a confidence interval of at least 95%, both p values for lack-of-fit were significant (Figure 3B and Figure 4B). These data indicated that both models displayed good fitting to the values determined experimentally. The 3D plots derived from the models visualized the effect of the independent variables on the response (YTP) and illustrated the differences between the two acid catalysts used (Figure 5).
The sulfuric-acid-catalyzed treatment was significantly affected by both t (X1) and C (X2) but also their cross term (X1X2) (Figure 3, inset table “Parameter Estimates”). To the contrary, quadratic effects of either variable were non-significant. In the case of oxalic-acid-catalyzed treatment, once again, both X1 and X2 were shown to exert a significant influence on YTP (Figure 4, inset table “Parameter Estimates”), but a quadratic effect of X2 (X22) was also significant.
Such an effect may be visually identified by the response surface curvature (Figure 5B). Both t and C exerted positive effects irrespective of the catalyst used, suggesting that increasing concentration of either sulfuric acid or oxalic acid, within the range tested, would provide higher YTP. The same held true for the cross and quadratic terms of the models.
To determine the optimal values for both process variables t and C but also the maximum predicted YTP for the treatment developed, the desirability function was used (Figure 3A and Figure 4A). For the sulfuric-acid-catalyzed treatment, the maximum theoretical YTP was found to be 10.95 ± 0.44 mg CAE g−1 DM, achieved at CSuAc = 1.5% and t = 300 min (Figure 3A). On the other hand, the maximum YTP of 10.30 ± 0.53 could be attained at COxAc = 4% and t = 300 min.
These values were virtually equal to the corresponding ones given in Table 2 and Table 3, and the difference between them was statistically non-significant (p > 0.05). Furthermore, considering that the corresponding CSF′ values for the sulfuric-acid- and oxalic-acid-catalyzed treatment were 7.87 and 7.61, it could be argued that the use of oxalic acid, a food-grade organic acid, instead of sulfuric acid, a corrosive acid, would afford equivalent effects at lower severity.

3.4. Extract Composition and Antioxidant Characteristics

Apart from the efficiency of the oxalic-acid-catalyzed treatment regarding the recovery of total polyphenols from CSS, an issue of importance was the polyphenolic profile of the extract generated. Thus, the extract obtained under optimized conditions was analyzed using HPLC to trace its composition. The extract generated by the sulfuric-acid-catalyzed treatment was also analyzed to spot any possible differences. Based on the trace recorded at 320 nm, two major constituents could be tentatively identified, neochlorogenic acid (nCGA) and chlorogenic acid (CGA) (Figure 6). This was in accordance with previous studies, which demonstrated that nCGA (3-caffeoylquinic acid) and CGA (5-caffeoylquinic acid) were the major constituents in CSS extracts, irrespective of the extraction solvent used [33,34]. Nevertheless, other authors reported feruloylquinic acid and 4,5-di-caffeoylquinic acid as principal CSS polyphenols, as well [35,36].
Overall, the two extracts displayed identical profiles, which clearly illustrated that the nature of the acid catalyst was not a determinant of the compounds encountered in the CSS extracts. No differences in the polyphenolic profile were seen when comparison was made with the extract obtained with 60% ethanol (data not shown). On the other hand, the quantitative analysis showed that the extract produced from the oxalic-acid-catalyzed treatment was enriched by almost 16% more in nCGA and 12% in CGA compared to the extract obtained by the sulfuric-acid-catalyzed treatment (Table 5). In total, oxalic acid catalysis resulted in an extract that contained 13% more chlorogenates, and it also exhibited approximately 12% higher AAR, but 44% lower PR. This outcome indicated that the polyphenolic composition of the extracts differentially affected their antioxidant properties. Such an outcome might indicate that other compounds could affect the overall antioxidant properties of CSS extracts. It should be underlined that synergistic and/or antagonistic effects might emerge as a consequence of combinations of individual polyphenols, as observed for various polyphenol mixtures [37].
Thus, the levels of the antiradical activity and ferric-reducing power found may reflect the manifestation of similar phenomena. Furthermore, it could be presumed that compounds such as nCGA and CGA may play an important role in scavenging the DPPH, which is a mechanism of single-electron transfer [38]. By contrast, antioxidants that display high performance in DPPH assays may react at a relatively lower rate with Fe3+, and, therefore, may give differentiated results in the ferric-reducing power assay. Therefore, the discrepancies found might be associated with differences in both reaction kinetics and mechanisms of the various CSS constituents.

4. Conclusions

This study aimed at developing an organosolv treatment for the effective recovery of CSS polyphenols by employing ethanol and sulfuric acid or oxalic acid as the catalyst. Models based on both severity and response surface optimization revealed that the oxalic-acid-catalyzed treatment was equally as effective as the sulfuric-acid-catalyzed one, but also less severe. Moreover, critical appraisal with data available in the literature suggested the treatment developed to be a high-performance process. The extracts generated under optimized conditions with either oxalic or sulfuric acid catalysis demonstrated chlorogenic acid to be the predominant polyphenolic substance, accompanied by neochlorogenic acid. On the basis of the evidence that emerged out of this investigation, it could be argued that oxalic-acid-catalyzed ethanol organosolv treatment of CSS may have potential as an efficacious process for the retrieval of high-valued-added compounds, such as chlorogenic acid. Such a treatment could be integrated in wider biorefinery strategies to establish policies of holistic waste valorization, which would orient food production towards more sustainable routes, in compliance with circular economy principles.

Author Contributions

G.S. (George Smyrnakis), G.S. (George Stamoulis), D.P., T.C. and V.A.: Performance of experiments, data curation, and analysis; D.P.M. and S.I.L.: Methodology—design and supervision; D.P.M. and S.I.L.: Writing and editing. All authors have read and agreed to the published version of the manuscript.

Funding

This research received no external funding.

Data Availability Statement

The data are available from the corresponding authors.

Conflicts of Interest

The authors declare no conflict of interest.

Abbreviations

CAEcaffeic acid equivalent (mg g−1 DM)
COxAcoxalic acid concentration (% w/v)
CSScoffee silverskin
CSFcombined severity factor (dimensionless)
CSF′alternative combined severity factor (dimensionless)
CSuAcsulfuric acid concentration (% w/v)
SFseverity factor (dimensionless)
Ttemperature (°C)
ttime (min)

References

  1. Ashokkumar, V.; Venkatkarthick, R.; Jayashree, S.; Chuetor, S.; Dharmaraj, S.; Kumar, G.; Chen, W.-H.; Ngamcharussrivichai, C. Recent advances in lignocellulosic biomass for biofuels and value-added bioproducts—A critical review. Bioresour. Technol. 2022, 344, 126195. [Google Scholar] [PubMed]
  2. Monteiro, A.R.; Battisti, A.P.; Valencia, G.A.; de Andrade, C.J. The Production of High-Added-Value Bioproducts from Non-Conventional Biomasses: An Overview. Biomass 2023, 3, 9. [Google Scholar] [CrossRef]
  3. Serna-Jiménez, J.A.; Siles, J.A.; de los Ángeles Martín, M.; Chica, A.F. A Review on the Applications of Coffee Waste Derived from Primary Processing: Strategies for Revalorization. Processes 2022, 10, 2436. [Google Scholar] [CrossRef]
  4. Lee, Y.-G.; Cho, E.-J.; Maskey, S.; Nguyen, D.-T.; Bae, H.-J. Value-Added Products from Coffee Waste: A Review. Molecules 2023, 28, 3562. [Google Scholar] [PubMed]
  5. Bessada, S.M.; Alves, R.C.; PP Oliveira, M.B. Coffee silverskin: A review on potential cosmetic applications. Cosmetics 2018, 5, 5. [Google Scholar] [CrossRef] [Green Version]
  6. Upadhyay, R.; Mohan Rao, L.J. An outlook on chlorogenic acids—Occurrence, chemistry, technology, and biological activities. Crit. Rev. Food Sci. Nutr. 2013, 53, 968–984. [Google Scholar] [CrossRef] [PubMed]
  7. Santana-Gálvez, J.; Cisneros-Zevallos, L.; Jacobo-Velázquez, D.A. Chlorogenic acid: Recent advances on its dual role as a food additive and a nutraceutical against metabolic syndrome. Molecules 2017, 22, 358. [Google Scholar]
  8. Bondam, A.F.; da Silveira, D.D.; dos Santos, J.P.; Hoffmann, J.F. Phenolic compounds from coffee by-products: Extraction and application in the food and pharmaceutical industries. Trends Food Sci. Technol. 2022, 123, 172–186. [Google Scholar] [CrossRef]
  9. Borand, M.N.; Karaosmanoğlu, F. Effects of organosolv pretreatment conditions for lignocellulosic biomass in biorefinery applications: A review. J. Renew. Sustain. Energy 2018, 10, 033104. [Google Scholar] [CrossRef]
  10. Wei Kit Chin, D.; Lim, S.; Pang, Y.L.; Lam, M.K. Fundamental review of organosolv pretreatment and its challenges in emerging consolidated bioprocessing. Biofuels Bioprod. Biorefining 2020, 14, 808–829. [Google Scholar] [CrossRef]
  11. Ravindran, R.; Desmond, C.; Jaiswal, S.; Jaiswal, A.K. Optimisation of organosolv pretreatment for the extraction of polyphenols from spent coffee waste and subsequent recovery of fermentable sugars. Bioresour. Technol. Rep. 2018, 3, 7–14. [Google Scholar] [CrossRef]
  12. Lee, J.-W.; Jeffries, T.W. Efficiencies of acid catalysts in the hydrolysis of lignocellulosic biomass over a range of combined severity factors. Bioresour. Technol. 2011, 102, 5884–5890. [Google Scholar] [CrossRef] [PubMed]
  13. Overend, R.P.; Chornet, E. Fractionation of lignocellulosics by steam-aqueous pretreatments. Philos. Trans. R. Soc. Lond. Ser. A Math. Phys. Sci. 1987, 321, 523–536. [Google Scholar]
  14. Sidiras, D.; Politi, D.; Giakoumakis, G.; Salapa, I. Simulation and optimization of organosolv based lignocellulosic biomass refinery: A review. Bioresour. Technol. 2022, 343, 126158. [Google Scholar]
  15. Pedersen, M.; Meyer, A.S. Lignocellulose pretreatment severity–relating pH to biomatrix opening. New Biotechnol. 2010, 27, 739–750. [Google Scholar] [CrossRef] [PubMed]
  16. Athanasiadis, V.; Palaiogiannis, D.; Bozinou, E.; Lalas, S.I.; Makris, D.P. β-Cyclodextrin-aided aqueous extraction of antioxidant polyphenols from peppermint (Mentha × piperita L.). Oxygen 2022, 2, 29. [Google Scholar] [CrossRef]
  17. Cicco, N.; Lanorte, M.T.; Paraggio, M.; Viggiano, M.; Lattanzio, V. A reproducible, rapid and inexpensive Folin–Ciocalteu micro-method in determining phenolics of plant methanol extracts. Microchem. J. 2009, 91, 107–110. [Google Scholar] [CrossRef]
  18. Lakka, A.; Lalas, S.; Makris, D.P. Development of a low-temperature and high-performance green extraction process for the recovery of polyphenolic phytochemicals from waste potato peels using hydroxypropyl β-cyclodextrin. Appl. Sci. 2020, 10, 3611. [Google Scholar] [CrossRef]
  19. Kaltsa, O.; Lakka, A.; Grigorakis, S.; Karageorgou, I.; Batra, G.; Bozinou, E.; Lalas, S.; Makris, D.P. A green extraction process for polyphenols from elderberry (Sambucus nigra) flowers using deep eutectic solvent and ultrasound-assisted pretreatment. Molecules 2020, 25, 921. [Google Scholar] [CrossRef] [Green Version]
  20. Vaidya, A.A.; Murton, K.D.; Smith, D.A.; Dedual, G. A review on organosolv pretreatment of softwood with a focus on enzymatic hydrolysis of cellulose. Biomass Convers. Biorefining 2022, 12, 5427–5442. [Google Scholar] [CrossRef]
  21. Woiciechowski, A.L.; Neto, C.J.D.; de Souza Vandenberghe, L.P.; de Carvalho Neto, D.P.; Sydney, A.C.N.; Letti, L.A.J.; Karp, S.G.; Torres, L.A.Z.; Soccol, C.R. Lignocellulosic biomass: Acid and alkaline pretreatments and their effects on biomass recalcitrance—Conventional processing and recent advances. Bioresour. Technol. 2020, 304, 122848. [Google Scholar]
  22. Papadaki, E.S.; Palaiogiannis, D.; Lalas, S.I.; Mitlianga, P.; Makris, D.P. Polyphenol Release from Wheat Bran Using Ethanol-Based Organosolv Treatment and Acid/Alkaline Catalysis: Process Modeling Based on Severity and Response Surface Optimization. Antioxidants 2022, 11, 2457. [Google Scholar] [CrossRef] [PubMed]
  23. Pazo-Cepeda, V.; Benito-Román, Ó.; Navarrete, A.; Alonso, E. Valorization of wheat bran: Ferulic acid recovery using pressurized aqueous ethanol solutions. Waste Biomass Valorization 2020, 11, 4701–4710. [Google Scholar] [CrossRef]
  24. Bozinou, E.; Palaiogiannis, D.; Athanasiadis, V.; Chatzilazarou, A.; Lalas, S.I.; Makris, D.P. Glycerol-Based Deep Eutectic Solvents for Simultaneous Organosolv Treatment/Extraction: High-Performance Recovery of Antioxidant Polyphenols from Onion Solid Wastes. Sustainability 2022, 14, 15715. [Google Scholar] [CrossRef]
  25. Costa, A.S.; Alves, R.C.; Vinha, A.F.; Barreira, S.V.; Nunes, M.A.; Cunha, L.M.; Oliveira, M.B.P. Optimization of antioxidants extraction from coffee silverskin, a roasting by-product, having in view a sustainable process. Ind. Crops Prod. 2014, 53, 350–357. [Google Scholar] [CrossRef]
  26. Barbosa-Pereira, L.; Guglielmetti, A.; Zeppa, G. Pulsed electric field assisted extraction of bioactive compounds from cocoa bean shell and coffee silverskin. Food Bioprocess Technol. 2018, 11, 818–835. [Google Scholar] [CrossRef]
  27. Ballesteros, L.F.; Teixeira, J.A.; Mussatto, S.I. Chemical, functional, and structural properties of spent coffee grounds and coffee silverskin. Food Bioprocess Technol. 2014, 7, 3493–3503. [Google Scholar] [CrossRef] [Green Version]
  28. Vimercati, W.C.; da Silva Araújo, C.; Macedo, L.L.; Pimenta, C.J. Optimal extraction condition for the recovery of bioactive compounds and antioxidants from coffee silverskin. J. Food Process Eng. 2022, 45, e14009. [Google Scholar] [CrossRef]
  29. Wen, L.; Zhang, Z.; Zhao, M.; Senthamaraikannan, R.; Padamati, R.B.; Sun, D.W.; Tiwari, B.K. Green extraction of soluble dietary fibre from coffee silverskin: Impact of ultrasound/microwave-assisted extraction. Int. J. Food Sci. Technol. 2020, 55, 2242–2250. [Google Scholar] [CrossRef]
  30. Conde, T.; Mussatto, S.I. Isolation of polyphenols from spent coffee grounds and silverskin by mild hydrothermal pretreatment. Prep. Biochem. Biotechnol. 2016, 46, 406–409. [Google Scholar] [CrossRef] [Green Version]
  31. Narita, Y.; Inouye, K. High antioxidant activity of coffee silverskin extracts obtained by the treatment of coffee silverskin with subcritical water. Food Chem. 2012, 135, 943–949. [Google Scholar] [CrossRef] [PubMed] [Green Version]
  32. Ginting, A.R.; Kit, T.; Mingvanish, W.; Thanasupsin, S.P. Valorization of Coffee Silverskin through Subcritical Water Extraction: An Optimization Based on T-CQA Using Response Surface Methodology. Sustainability 2022, 14, 8435. [Google Scholar] [CrossRef]
  33. Zengin, G.; Sinan, K.I.; Mahomoodally, M.F.; Angeloni, S.; Mustafa, A.M.; Vittori, S.; Maggi, F.; Caprioli, G. Chemical composition, antioxidant and enzyme inhibitory properties of different extracts obtained from spent coffee ground and coffee silverskin. Foods 2020, 9, 713. [Google Scholar] [CrossRef]
  34. Nzekoue, F.K.; Angeloni, S.; Navarini, L.; Angeloni, C.; Freschi, M.; Hrelia, S.; Vitali, L.A.; Sagratini, G.; Vittori, S.; Caprioli, G. Coffee silverskin extracts: Quantification of 30 bioactive compounds by a new HPLC-MS/MS method and evaluation of their antioxidant and antibacterial activities. Food Res. Int. 2020, 133, 109128. [Google Scholar] [CrossRef]
  35. Regazzoni, L.; Saligari, F.; Marinello, C.; Rossoni, G.; Aldini, G.; Carini, M.; Orioli, M. Coffee silver skin as a source of polyphenols: High resolution mass spectrometric profiling of components and antioxidant activity. J. Funct. Foods 2016, 20, 472–485. [Google Scholar] [CrossRef]
  36. Castaldo, L.; Narváez, A.; Izzo, L.; Graziani, G.; Ritieni, A. In vitro bioaccessibility and antioxidant activity of coffee silverskin polyphenolic extract and characterization of bioactive compounds using UHPLC-Q-Orbitrap HRMS. Molecules 2020, 25, 2132. [Google Scholar] [CrossRef]
  37. Choueiri, L.; Chedea, V.S.; Calokerinos, A.; Kefalas, P. Antioxidant/pro-oxidant properties of model phenolic compounds. Part II: Studies on mixtures of polyphenols at different molar ratios by chemiluminescence and LC–MS. Food Chem. 2012, 133, 1039–1044. [Google Scholar] [CrossRef]
  38. Magalhães, L.M.; Segundo, M.A.; Reis, S.; Lima, J.L. Methodological aspects about in vitro evaluation of antioxidant properties. Anal. Chim. Acta 2008, 613, 1–19. [Google Scholar] [CrossRef] [PubMed]
Figure 1. The effect of ethanol concentration (CEtOH) of water/ethanol mixtures on the recovery of total polyphenol from CSS. Extractions were carried out at 80 °C for 180 min.
Chemengineering 07 00072 g001
Figure 2. Linear regression between CSF (A) and CSF′ (B) with YTP. Bars indicate standard deviation. Assignments: SuAc, sulfuric-acid-catalyzed treatment; OxAc, oxalic-acid-catalyzed treatment.
Chemengineering 07 00072 g002
Figure 3. Data derived from implementing response surface methodology to optimize sulfuric-acid-catalyzed ethanol organosolv treatment of CSS. (A) Plot showing the correlation between predicted and measured (actual) YTP values. (B) Desirability plot with predicted maximum YTP and optimum CSuAc and t. Values marked with asterisk and different color are statistically significant.
Chemengineering 07 00072 g003
Figure 4. Data derived from implementing response surface methodology to optimize oxalic-acid-catalyzed ethanol organosolv treatment of CSS. (A) Plot showing the correlation between predicted and measured (actual) YTP values. (B) Desirability plot with predicted maximum YTP and optimum COxAc and t. Values marked with asterisk and different color are statistically significant.
Chemengineering 07 00072 g004
Figure 5. Three-dimensional diagrams presenting the effect of variation in both acid concentration (C) and treatment time (t) on the total polyphenol yield: (A) sulfuric-acid-catalyzed treatment; (B) oxalic-acid-catalyzed treatment.
Chemengineering 07 00072 g005
Figure 6. Chromatograms of CSS extracts, obtained with sulfuric-acid-catalyzed (SuAc) and oxalic-acid-catalyzed (OxAc) ethanol organosolv treatments, under optimized conditions. The HPLC traces were recorded at 320 nm. Peak assignment: 1, neochlorogenic acid; 2, chlorogenic acid.
Chemengineering 07 00072 g006aChemengineering 07 00072 g006b
Table 1. Variables of the organosolv treatments, given in both actual and codified forms. Term C corresponds to acid catalyst concentration, which was either sulfuric acid (CSuAc) or oxalic acid (COxAc).
Treatment VariablesCodesCoded Variable Level
−101
t (min)X160180300
CSuAc (%, w/v)X20.51.01.5
COxAc (%, w/v) 4812
Table 2. Combinations of sulfuric acid concentration (CSuAc) and resident time of the organosolv treatments tested, along with the corresponding severities and total polyphenol yields. CSF, CSF′ and YTP correspond to combined severity factor, alternative combined severity factor, and yield in total polyphenols.
CSuAc (% w/v)t (min)CSFCSF′YTP
(mg CAE g−1 DM)
0.560−0.08 a6.92 a9.31 a
1800.40 c7.40 c9.60 c
3000.62 c7.62 c10.02 c
1.0600.14 a7.14 a9.59 c
1800.62 c7.62 c9.80 c
3000.84 b7.84 b10.29 b
1.5600.23 a7.23 a9.71 c
1800.71 c 7.71 c10.33 b
3000.93 b7.93 b10.84 b
Values within columns denoted with different superscripted letters (a, b, c) are statistically different (p < 0.05).
Table 3. Combinations of oxalic acid concentration (COxAc) and resident time of the organosolv treatments tested, along with the corresponding severities and total polyphenol yields. CSF, CSF′ and YTP correspond to combined severity factor, alternative combined severity factor, and yield in total polyphenols.
COxAc (% w/v)t (min)CSFCSF′YTP
(mg CAE g−1 DM)
460−0.09 a6.91 a7.80 a
1800.39 c7.39 c9.25 c
3000.61 c7.61 c10.16 b
8600.07 a7.07 a8.20 a
1800.55 c7.55 c9.06 c
3000.77 b7.77 b9.98 b
12600.17 a7.17 a9.20 c
1800.65 c7.65 c9.70 c
3000.87 b7.87 b10.30 b
Values within columns designated with different superscripted letters (a, b, c) are statistically different (p < 0.05).
Table 4. Presentation of the design points used for the response surface methodology, the coded levels of the independent variables, and the measured and predicted response values for both sulfuric-acid-catalyzed and oxalic-acid-catalyzed organosolv treatments.
Design PointIndependent VariablesResponse (YTP, mg CAE g−1 DM)
X1 (t)X2 (C)SuAcOxAc
MeasuredPredictedMeasuredPredicted
1−1−19.879.748.198.12
2−119.719.749.429.20
31−19.439.4210.1610.30
41110.8110.9610.3110.30
5−109.599.697.908.19
61010.2910.149.989.84
70−19.209.349.259.18
80110.3210.119.529.72
9009.809.689.068.99
10009.519.688.908.99
11009.729.689.158.99
Table 5. Quantitative data on the yields in neochlorogenic acid (nCGA) and chlorogenic acid (CGA), achieved with sulfuric-acid-catalyzed (SuAc) and oxalic-acid-catalyzed (OxAc) ethanol organosolv treatments under optimized conditions, along with the antiradical activity (AAR) and ferric-reducing power (PR) of the extracts. Values are given as means of triplicate determination ± standard deviation.
SamplenCGA
(μg g−1 DM)
CGA
(μg g−1 DM)
Total
(μg g−1 DM)
AAR
(μmol DPPH g−1 DM)
PR
(μmol AAE g−1 DM)
SuAc37.56 ± 3.50157.49 ± 12.40195.0575.93 ± 5.4440.94 ± 2.32
OxAc44.61 ± 3.88179.59 ± 14.32224.2086.14 ± 6.0232.02 ± 2.85
Disclaimer/Publisher’s Note: The statements, opinions and data contained in all publications are solely those of the individual author(s) and contributor(s) and not of MDPI and/or the editor(s). MDPI and/or the editor(s) disclaim responsibility for any injury to people or property resulting from any ideas, methods, instructions or products referred to in the content.

