
Robust Registration of Medical Images in the Presence of Spatially-Varying Noise


1
Department of Neurology, Department of Bioengineering and Therapeutic Sciences, University of California, San Francisco, CA 94143, USA
2
Weill Institute for Neurosciences, University of California, San Francisco, CA 94143, USA
3
Electrical Engineering Department, Iran Science and Technology University, Tehran 16844, Iran
4
Electrical Engineering Department, Sharif University of Technology, Tehran 14115, Iran
*
Author to whom correspondence should be addressed.
Algorithms 2022, 15(2), 58; https://doi.org/10.3390/a15020058
Submission received: 17 November 2021
/
Revised: 3 February 2022
/
Accepted: 3 February 2022
/
Published: 10 February 2022
Abstract
:Spatially-varying intensity noise is a common source of distortion in medical images and is often associated with reduced accuracy in medical image registration. In this paper, we propose two multi-resolution image registration algorithms based on Empirical Mode Decomposition (EMD) that are robust against additive spatially-varying noise. EMD is a multi-resolution tool that decomposes a signal into several principle patterns and residual components. Our first proposed algorithm (LR-EMD) is based on the registration of EMD feature maps from both floating and reference images in various resolutions. In the second algorithm (AFR-EMD), we first extract a single average feature map based on EMD and then use a simple hierarchical multi-resolution algorithm to register the average feature maps. We then showcase the superior performance of both algorithms in the registration of brain MRIs as well as retina images. For the registration of brain MR images, using mutual information as the similarity measure, both AFR-EMD and LR-EMD achieve a lower error rate in intensity (42% and 32%, respectively) and lower error rate in transformation (52% and 41%, respectively) compared to intensity-based hierarchical registration. Our results suggest that the two proposed algorithms offer robust registration solutions in the presence of spatially-varying noise.
1. Introduction
The accurate registration and alignment of two images has been a challenging problem in a wide variety of applications such as medical image processing [1,2], remote sensing [3], biology [4,5,6], and computer vision [7,8]. Particularly, the registration of the medical images has been widely used in tumor localization and targeting [9], organ growth studies [10] and brain atlas reconstruction [11].
Overall, the registration algorithms can be categorized into two classes [12]. One class is concerned with the registration based on the intensity of the images. In this approach, a similarity measure is defined to quantify the similarity of both floating (or moving) and reference (or target) images. Then, an optimization process identifies an optimal map for the floating image to achieve the highest similarity to the reference image. In the second class of registration algorithms, a set of features such as landmarks [13], a histogram of intensity [14] or responses to Gabor [15] and Alpha stable filters [16,17] are first extracted from both floating and reference images. Then, two images are aligned through the mapping of these features.
A similarity measure between two images is a crucial component of intensity-based image registration. A wide variety of measures such as the sum-of-squared-differences (SSD), correlation coefficient (CC), or mutual information (MI) [18,19,20], have been used in the registration process. However, none of these measures are robust against the spatially varying intensity distortion. The bias field noise is one of the common instances of the spatially varying distortion [21] and is often present in magnetic resonance (MR) or retina images. Examples of spatially varying noise in MRI are standing wave artifacts, and inhomogeneity artifacts, susceptibility artifact, and surface coils artifacts. Therefore the traditional registration algorithms may easily fail for the MR or retina images when these images are distorted.
Traditionally, two distinct types of algorithms have been studied to reduce the bias-field noise effect in image registration. One type is focused on defining robust similarity measures. Residual complexity (RC) [22], rank-induced [23,24] and sparsity-based [25,26] similarity measures are some examples. The second type of algorithms is based on simply reducing the noise effect and then registration of the denoised images [27,28]. Our two proposed algorithms in this paper could be classified in the second group. We examine the ability of state-of-the-art hierarchical signal decomposition techniques in removing additive spatially varying noise in MR images. Specifically, we propose to use empirical mode decomposition (EMD) [29] to overcome the effect of bias field noise in MR images. EMD is a multi-resolution computational technique to decompose the image into several principle patterns and residual components. We show that the bias field noise is highly expressed in the residual components and not in the principle patterns. Therefore, it is possible to remove the noise by removing the EMD residuals. EMD-based algorithms have been previously studied for the basic image registration task [30,31,32]. However, to our knowledge, the advantage of the EMD-based registration algorithms in the presence of spatially varying noise is still unknown. In this study, we explore this problem by proposing robust EMD-based registration algorithms.
Our contributions to this paper are twofold: First, we show that the EMD is able to extract the bias field noise from the image through multi-scale decomposition of the image. Second, we introduce two multi-resolution [33] EMD-based registration algorithms robust to the bias field noise. In one algorithm (LR-EMD), we hierarchically register EMD feature maps from both floating and reference images. The feature maps are constructed from various resolutions of EMD-based principle patterns. In the second algorithm (AFR-EMD), we first extract an average feature map for both floating and reference images by averaging the principle patterns from the EMD. Then, we use a simple hierarchical multi-resolution algorithm based on downsampling to register the average feature maps.
The rest of the paper is organized as follows: In Section 2, we describe the basis of signal decomposition using EMD and discuss the application of EMD in extracting the bias field noise with two EMD-based registration algorithms. The quantitative and qualitative registration performance and comparisons to the benchmark algorithms have been explored in Section 3 for both brain MR and retina images. The study is concluded in Section 4.
2. Materials and Methods
2.1. Empirical Mode Decomposition
Decomposing nonlinear and non-stationary signals into their intrinsic modes have been a challenging task in signal processing. Most of the previously proposed decomposition is based on time-frequency transformations such as Short-Time Fourier Transform [34] and wavelet transform [35] that expands the signal into a set of basis functions. Unlike these transformations, algorithms based on empirical mode decomposition (EMD) [29,36] are able to decompose the linear or nonlinear signal into a set of functions defined by the signal itself [37]. EMD consists of a set of spatial and temporal processes that decomposes a signal into Intrinsic Mode Functions (IMFs). Each IMF is an oscillating mode of the signal. In contrast with harmonic modes, oscillating modes have time-variant amplitude and frequency. EMD has been widely used in applications of signal decomposition such as prediction [38], classification [39] and denoising [40].
In particular, bidimensional empirical mode decomposition [41] is our focus in this paper since it deals with two-dimensional signals such as images. Each IMF in the bidimensional empirical mode decomposition could be extracted from the image using a sifting process. Let denote the image, and denote the ith IMF and residual, respectively. Here i represents the level or scale of the decomposition. For simplicity, let us assume that the residual at level 0 is the original image. That is:
To find the IMF in level i, we iterate through the following steps: First, identify all the local minimum and maximum of the . Then, generate the bounding maximum and minimum envelopes, and , using an interpolation or a surface fitting technique. The IMF in this iteration is equal to subtracted by the mean of maximum and minimum envelope:
We repeat this process until a convergence condition is met. At this point, the residual is defined as:
The first IMF has the finest and the most detailed patterns while the rest of the IMFs have patterns with coarser content. The extracted IMFs have a number of crucial characteristics. First, the number of zero-crossing points is equal to or one less than the number of extremes in each IMF. Second, each IMF has one minimum with zero value. Finally, the mean value of the bounding maximum and minimum envelopes is equal to zero for each IMF.
It is known that the EMD has limited capacity in processing narrow-band signals [42]. These signals have concentrated energy in a narrow frequency band, which causes the decomposition to fail in extracting the intrinsic modes. Thus, the accuracy and efficiency of the EMD could be limited in this situation. However, this is not an issue in our study for MRI and retina images. These images do not have a narrow-band frequency component and therefore, are suited to be analyzed through EMD.
2.2. Bias Field Noise and Empirical Mode Decomposition
Spatially varying noise or bias field is a common source of noise in MR images. Bias field noise can potentially cause the registration process to diverge, particularly when the similarity measure is not robust to the noise. Sum-of-squared-differences (SSD), correlation coefficient (CC), and mutual information (MI) are some of the non-robust similarity measures. Our results suggest that even Residual Complexity (RC) similarity measure has limited capacity in overcoming the bias field noise. In this section, we investigate the ability of EMD in reducing and removing this noise during the registration process.
EMD is a powerful tool to extract the bias field noise from the image. Here, we provide an intuitive explanation for this statement. EMD provides a decomposition of the signal into its principle components in different levels of granularity. The principle patterns or the IMFs in each level (scale) contain a portion of the signal with a particular level of detail. The remaining components of the signal are explained in the residual part. Defined by the sifting process, each IMF is constructed by iteratively subtracting the average of the minimum and maximum envelopes from the original signal. In a two-dimensional space, the bias field noise could be estimated as an additive local spatial variation in the signal. The average of the minimum and the maximum envelopes are highly affected by this local spatial variation because both signals carry low-frequency patterns. Therefore, the average of the minimum and the maximum envelopes absorbs the bias field noise. By subtracting this average envelope from the signal, IMF becomes noise-free.
Mathematically, the bias field noise can be represented by a mixture of two-dimensional Gaussian functions (kernels) [22]. We distort the image with an additive bias field noise according to the following equation:
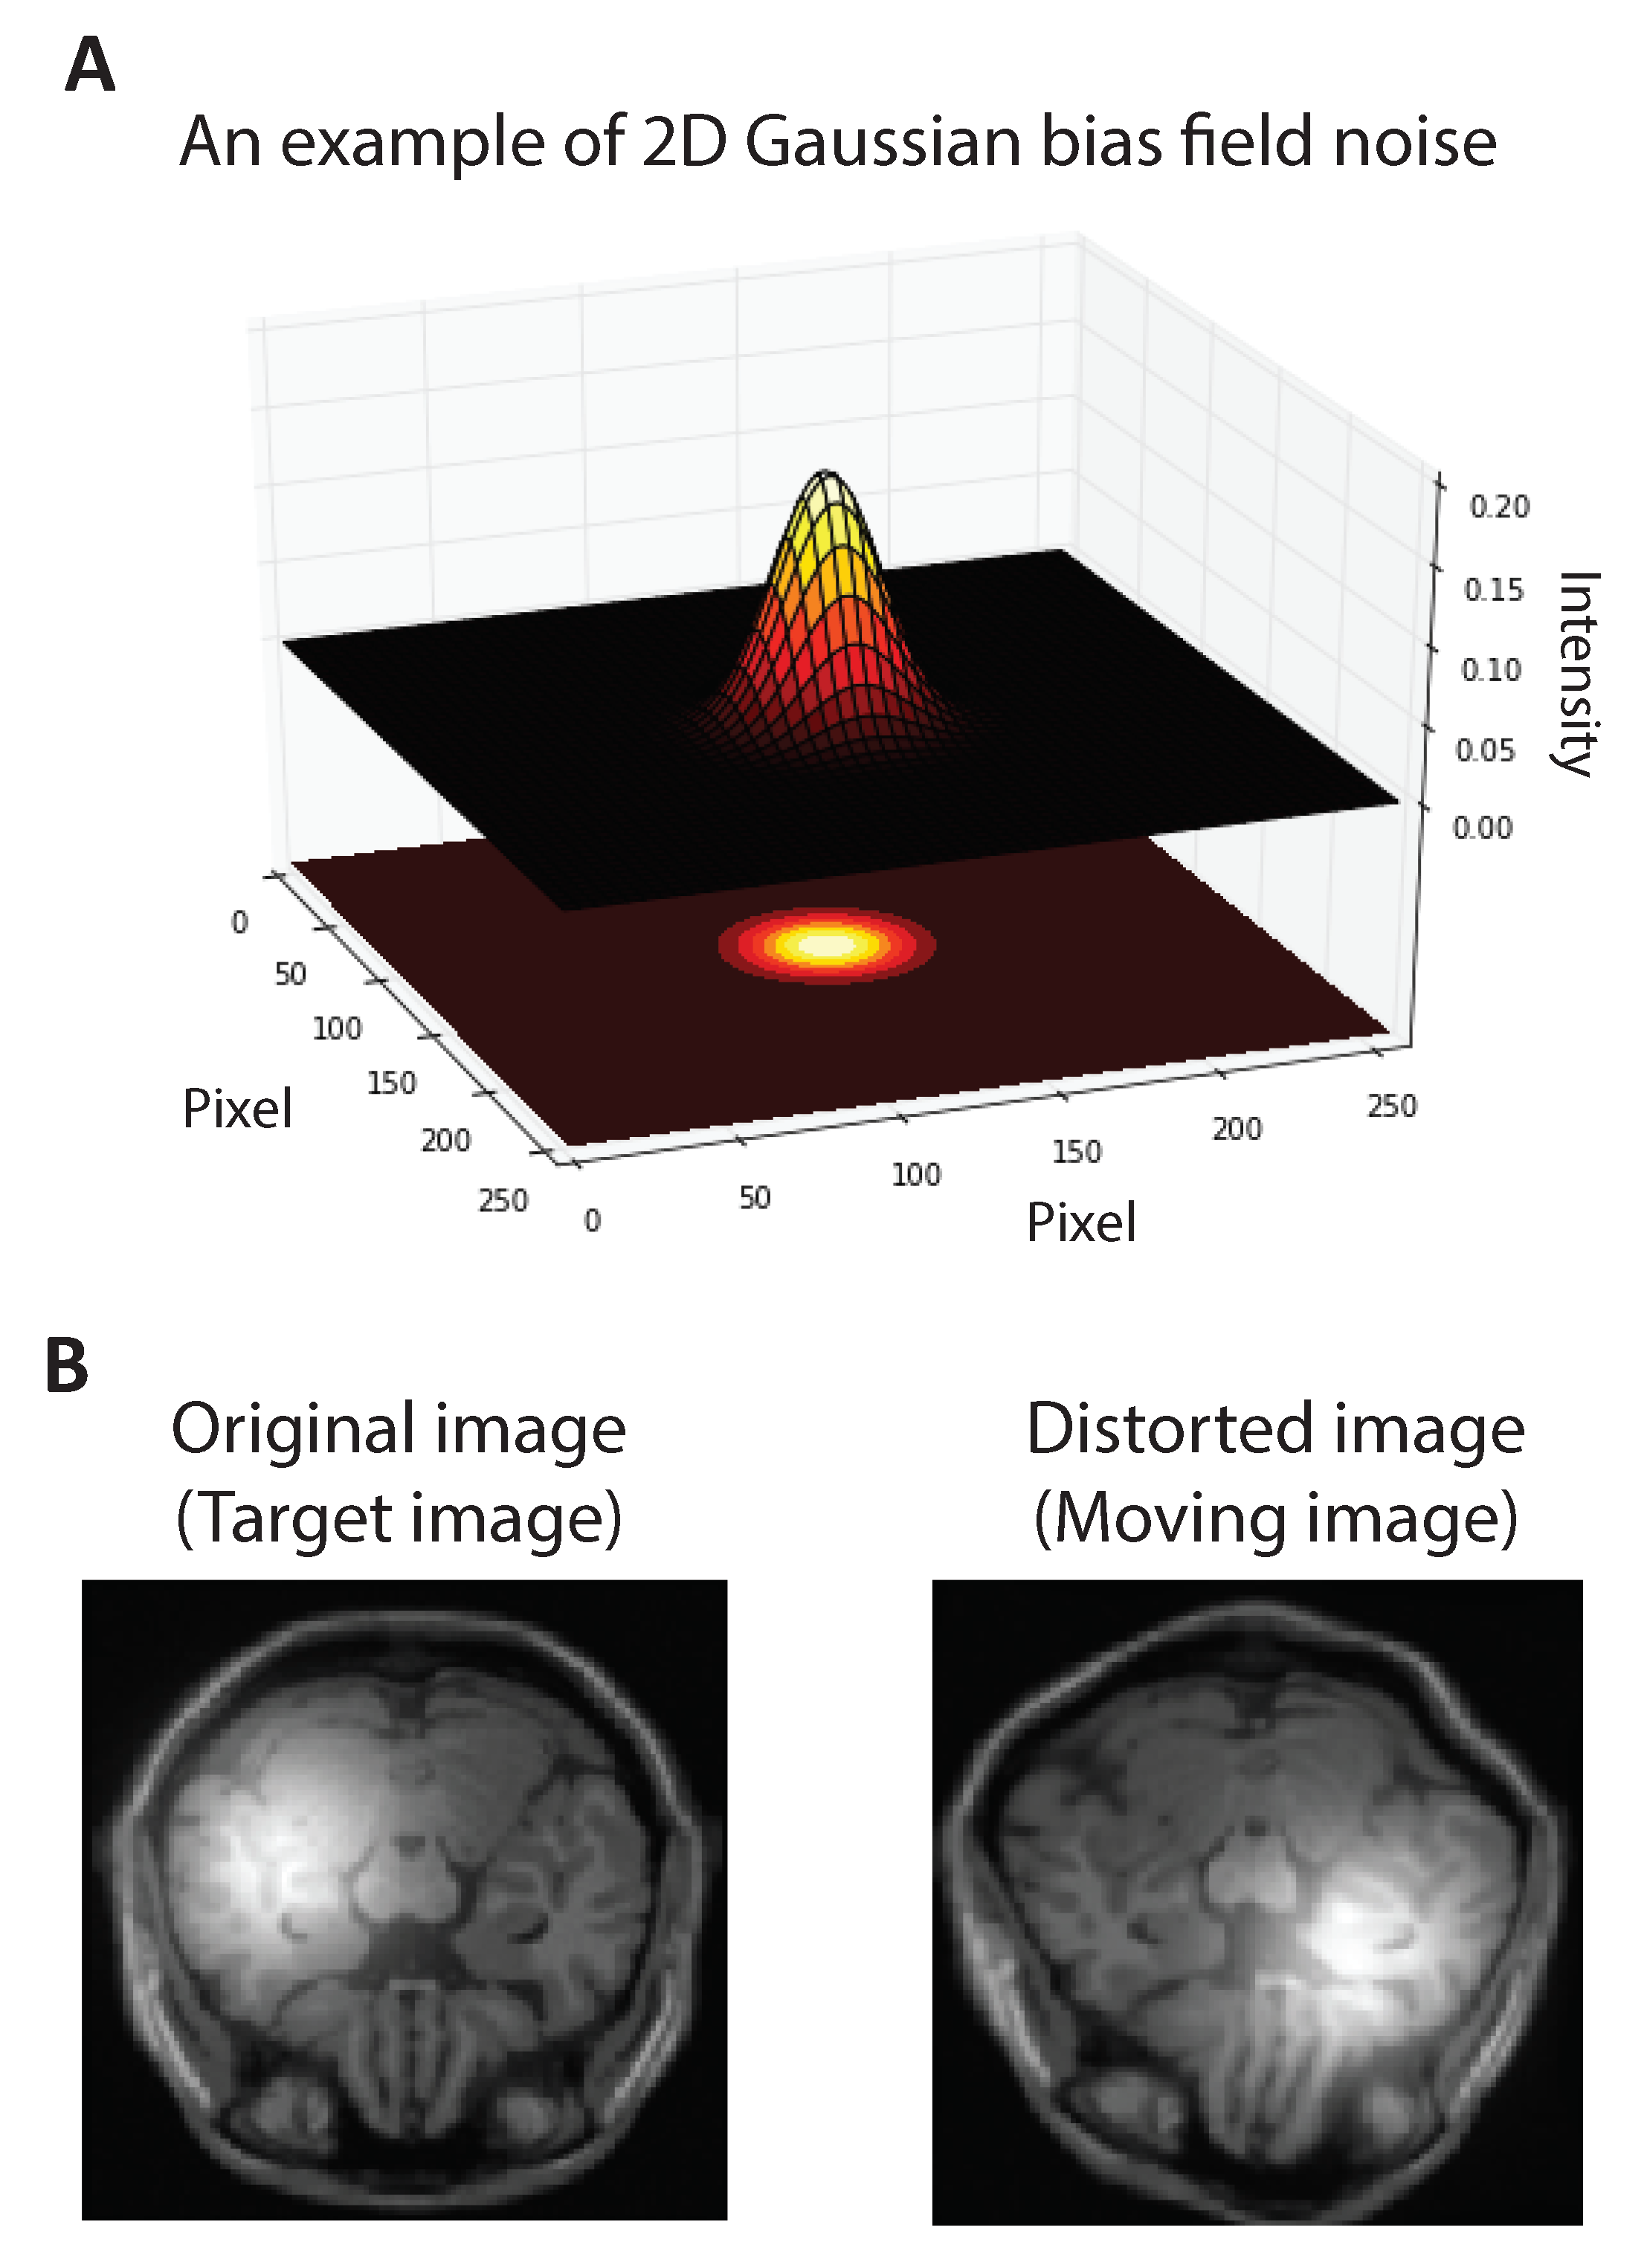
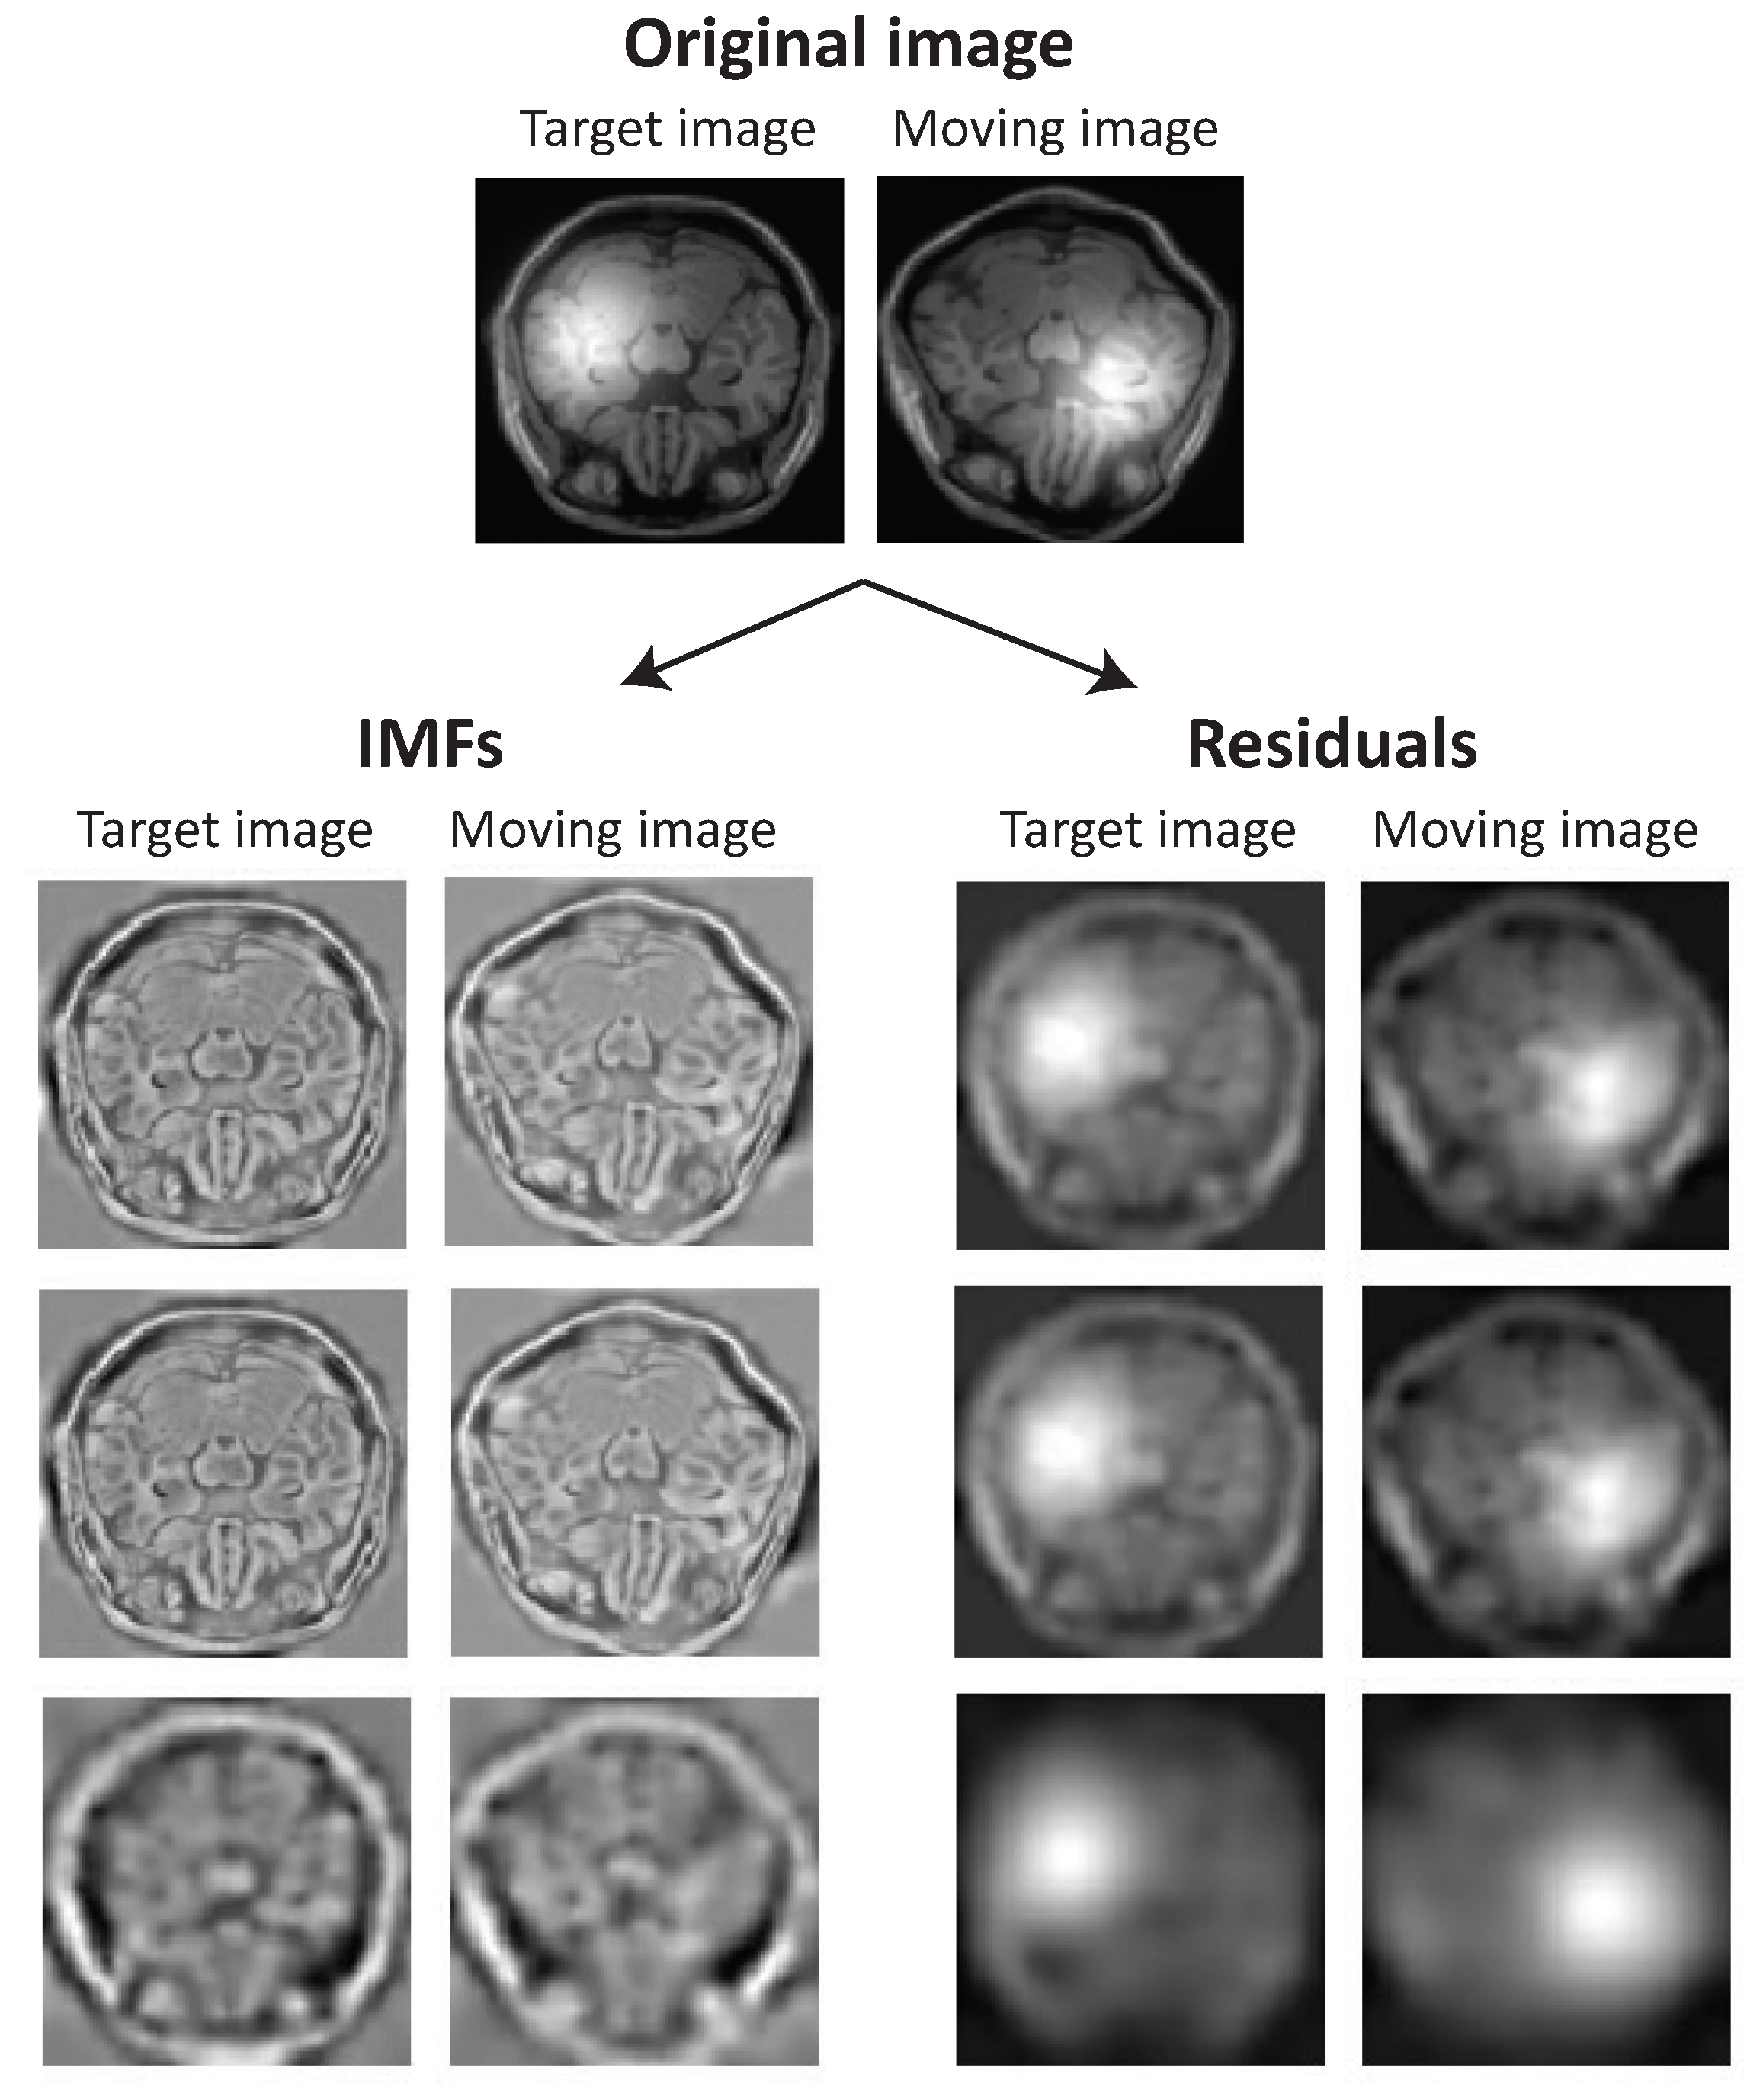
where K is the number of Gaussian functions. Figure 1A shows a sample Gaussian kernel. We manually add one Gaussian kernel () to both floating and reference MR images. The coordination of the center of Gaussian kernel is selected at random and the standard deviation is set to be of the image width. Figure 1B shows a sample MR image from the BrainWeb dataset [43] corrupted with the bias field noise. To explore the ability of the EMD in extracting the bias field noise, we decomposed both noisy floating and reference images into IMFs and residuals. Figure 2 illustrates the set of IMFs and residuals for three EMD levels. The Gaussian kernel is highly expressed in residuals and IMFs are noise-free. This observation suggests that the registration algorithms based on the IMFs may be robust to the bias field noise. In the following two subsections, we propose two registration algorithms based on this observation.
2.3. LR-EMD: Image Registration Algorithm Based on EMD Levels
Taking advantage of the EMD’s capacity in removing the bias field noise, we propose the following hierarchical multi-resolution registration algorithm. First, we find the IMFs for both floating and reference images. These IMFs represent the feature maps in various resolutions. Starting from the coarsest resolution, we estimate the transformation from floating image IMF to the reference image IMF via free form deformation (FFD) algorithm [44]. The estimated transformation provides an initial mapping for the free form deformation in the next level with a higher resolution. The process continues until the registration of the finest level IMFs. We call this algorithm Level-based Registration using EMD or LR-EMD. Note that other transformation techniques could be used instead of the free form deformation. Our algorithm is also agnostic to the type of similarity measure. In this paper, we have used SSD, CC, RC and MI as similarity measures. Algorithm 1 shows the details of LR-EMD.
LR-EMD takes advantage of IMFs in different levels (scales) and performs registration in a hierarchical order. Therefore, it benefits from the information stored in each level of IMFs during the process of registration. The registration at each resolution level of IMFs provides an initial transformation for the registration in the next level. In principle, the hierarchical order increases the robustness of LR-EMD against the local minimum in the optimization process.
| Algorithm 1 LR-EMD: Image Registration using EMD levels. |
| Input: floating image, , reference image, n number of IMFs or EMD levels, Similarity measure |
| Extract n IMFs of both and , |
| Initialize registration with unity transform |
| for to n do ▹ where is the coarse-grained level and is the fine-grained level |
| Register the ith IMF of to the ith IMF of based on Similarity measure and find transform |
| Initialize transform for next level of IMF with |
| end for |
2.4. AFR-EMD: Image Registration Algorithm Based on Average EMD Feature-Maps
We propose a second registration algorithm based on the average of EMD-based features. This algorithm is called Average Feature-map Registration using EMD or AFR-EMD. Algorithm 2 presents the details of AFR-EMD. In this case, we first construct a single feature-map for each of the floating and reference images by taking average of IMFs from all EMD levels (scales). Then, we register the average feature maps based on the chosen similarity measure. To take advantage of hierarchical registration, we downsample the feature-map and perform a level-by-level registration. Similar to LR-EMD, various similarity measures including SSD, CC, RC, and MI are used to perform AFR-EMD. Free form deformation [44] is used here to estimate the transform.
The average of the IMFs is a denoised and normalized feature map. Averaging the IMFs provides a feature map with reduced size. Therefore, the features are easier to interpret for a human observer. This reduction in the feature size could also reduce the computational cost in a single-scale registration algorithm. In our case, we designed a multi-scale hierarchical registration based on downsampling in AFR-EMD, therefore the gain in computational cost is in the same order as LR-EMD. In the next section, we will explore the ability of LR-EMD and AFR-EMD in robust registration of images in the presence of bias field noise.
| Algorithm 2 AFR-EMD: Image registration based on Average EMD feature-maps |
| Input: floating image, , reference image, n number of IMFs or EMD levels, Similarity measure |
| Extract n IMFs for both and , |
| Find and , the average of IMFs for both and |
| Initialize registration with unity transform |
| for to n do ▹ where is the coarse-grained level and is the fine-grained level |
| Compute and , the downsampled versions of and with respect to scale level i |
| Register to based on Similarity measure and find transform |
| Initialize transform for next level of registration with |
| end for |
2.5. Datasets
We evaluated our proposed registration algorithms on two MRI datasets and one Retina image dataset. A brief description of the datasets is provided below.
2.5.1. BrainWeb Dataset
2.5.2. IBSR Dataset
The Internet Brain Segmentation Repository (IBSR) [46] dataset contains 18 real and normal T1-weighted MRI provided by Massachusetts General Hospital (MGH) in association with Harvard Medical School.
2.5.3. Fundus Image Registration (FIRE) Dataset
We used category S of the Fundus Image Registration (FIRE) Dataset [47] to evaluate the proposed approaches. This dataset contains 14 image pairs with 2912 × 2912 pixels resolution. The images were captured using a Nidek AFC-210 fundus camera.
2.6. Measures of Accuracy
Two different measures were used in this paper to compare the accuracy of registration. First measure is the transformation root mean square error (RMSE) between the true and estimated transformations. We call this measure T-RMSE throughout this paper. T-RMSE is equal to:
where N is the number of pixels. Second measure is RMSE between intensities of the reference and the registered images. We call this measure I-RMSE. I-RMSE is equal to:
The mean and the standard deviation (SD) of both error measures were calculated across 15 random initialization of the registration algorithms. At each run, the intensity distortion and the geometric transform parameters were randomly reinitialized.
3. Results
3.1. Evaluation of the Proposed Algorithms on the MRIs from the BrainWeb Dataset
In our first experiment, we used the simulated MR images in the BrainWeb dataset [43,45] to evaluate the performance of our registration algorithms. Each image was geometrically distorted using a random perturbation to generate the floating image (Examples in Figure 1). Specifically, a uniform grid was randomly perturbed (by a uniform distribution on [−6 6]) and used as the Free Form Deformation (FFD) grid for the floating image. Then, the distorted images were registered back to the original image using our two proposed algorithms as well as a standard benchmark intensity-based algorithm [22]. For each algorithm, four registration processes were performed, each using one of the SSD, CC, RC, or MI similarity measures. In all of the cases, FFD [44] was used as the model of geometric transform. FFD was implemented via three hierarchical levels of B-spline control points. We set the number of levels in IMFs, n, to 3 in order to have a fair comparison with the intensity-based registration. Iterative Gradient descent was used to optimize the transformation parameters. The accuracy was evaluated using both T-RMSE and I-RMSE.
We started the experiments by registering images without any bias field noise. Then, we manually added spatially varying distortions or bias field noise to both floating and reference images [22]. The noise was generated using the mixture of Gaussian functions and was added to the images according to Equation (1). The mean of the Gaussian functions was selected at random. The standard deviation was set to of the image width.
3.1.1. No Bias Field Case
Figure 3 shows the registration performance when there is no bias field in the MR images. The mean and variance of T-RMSE and I-RMSE for SSD, CC, RC, and MI similarity measures are shown separately in the top and the middle panels. The performance metrics are reported for LR-EMD, AFR-EMD, and the benchmark model. Without the bias field noise, all the registration processes for all images have converged. AFR-EMD achieves similar performance to the benchmark intensity-based registration when there is no bias field noise. LR-EMD has a slightly higher error, particularly when RC has been used as the similarity measure. Both SSD and CC have an approximately 25% higher average error compared to the RC and MI similarity measures (both in T-RMSE and I-RMSE). Generally, MI achieves the highest accuracy and fastest convergence time among the similarity measures. The bottom panel in Figure 3 compares the running times for all the methods. There is no significant difference between the running times of our proposed methods and the benchmark method. Among the similarity measures, RC has the highest running time. Overall, when there is no bias field distortion, EMD-based registration algorithms perform similar to the benchmark intensity-based method.
3.1.2. Convergence in the Presence of Bias Field
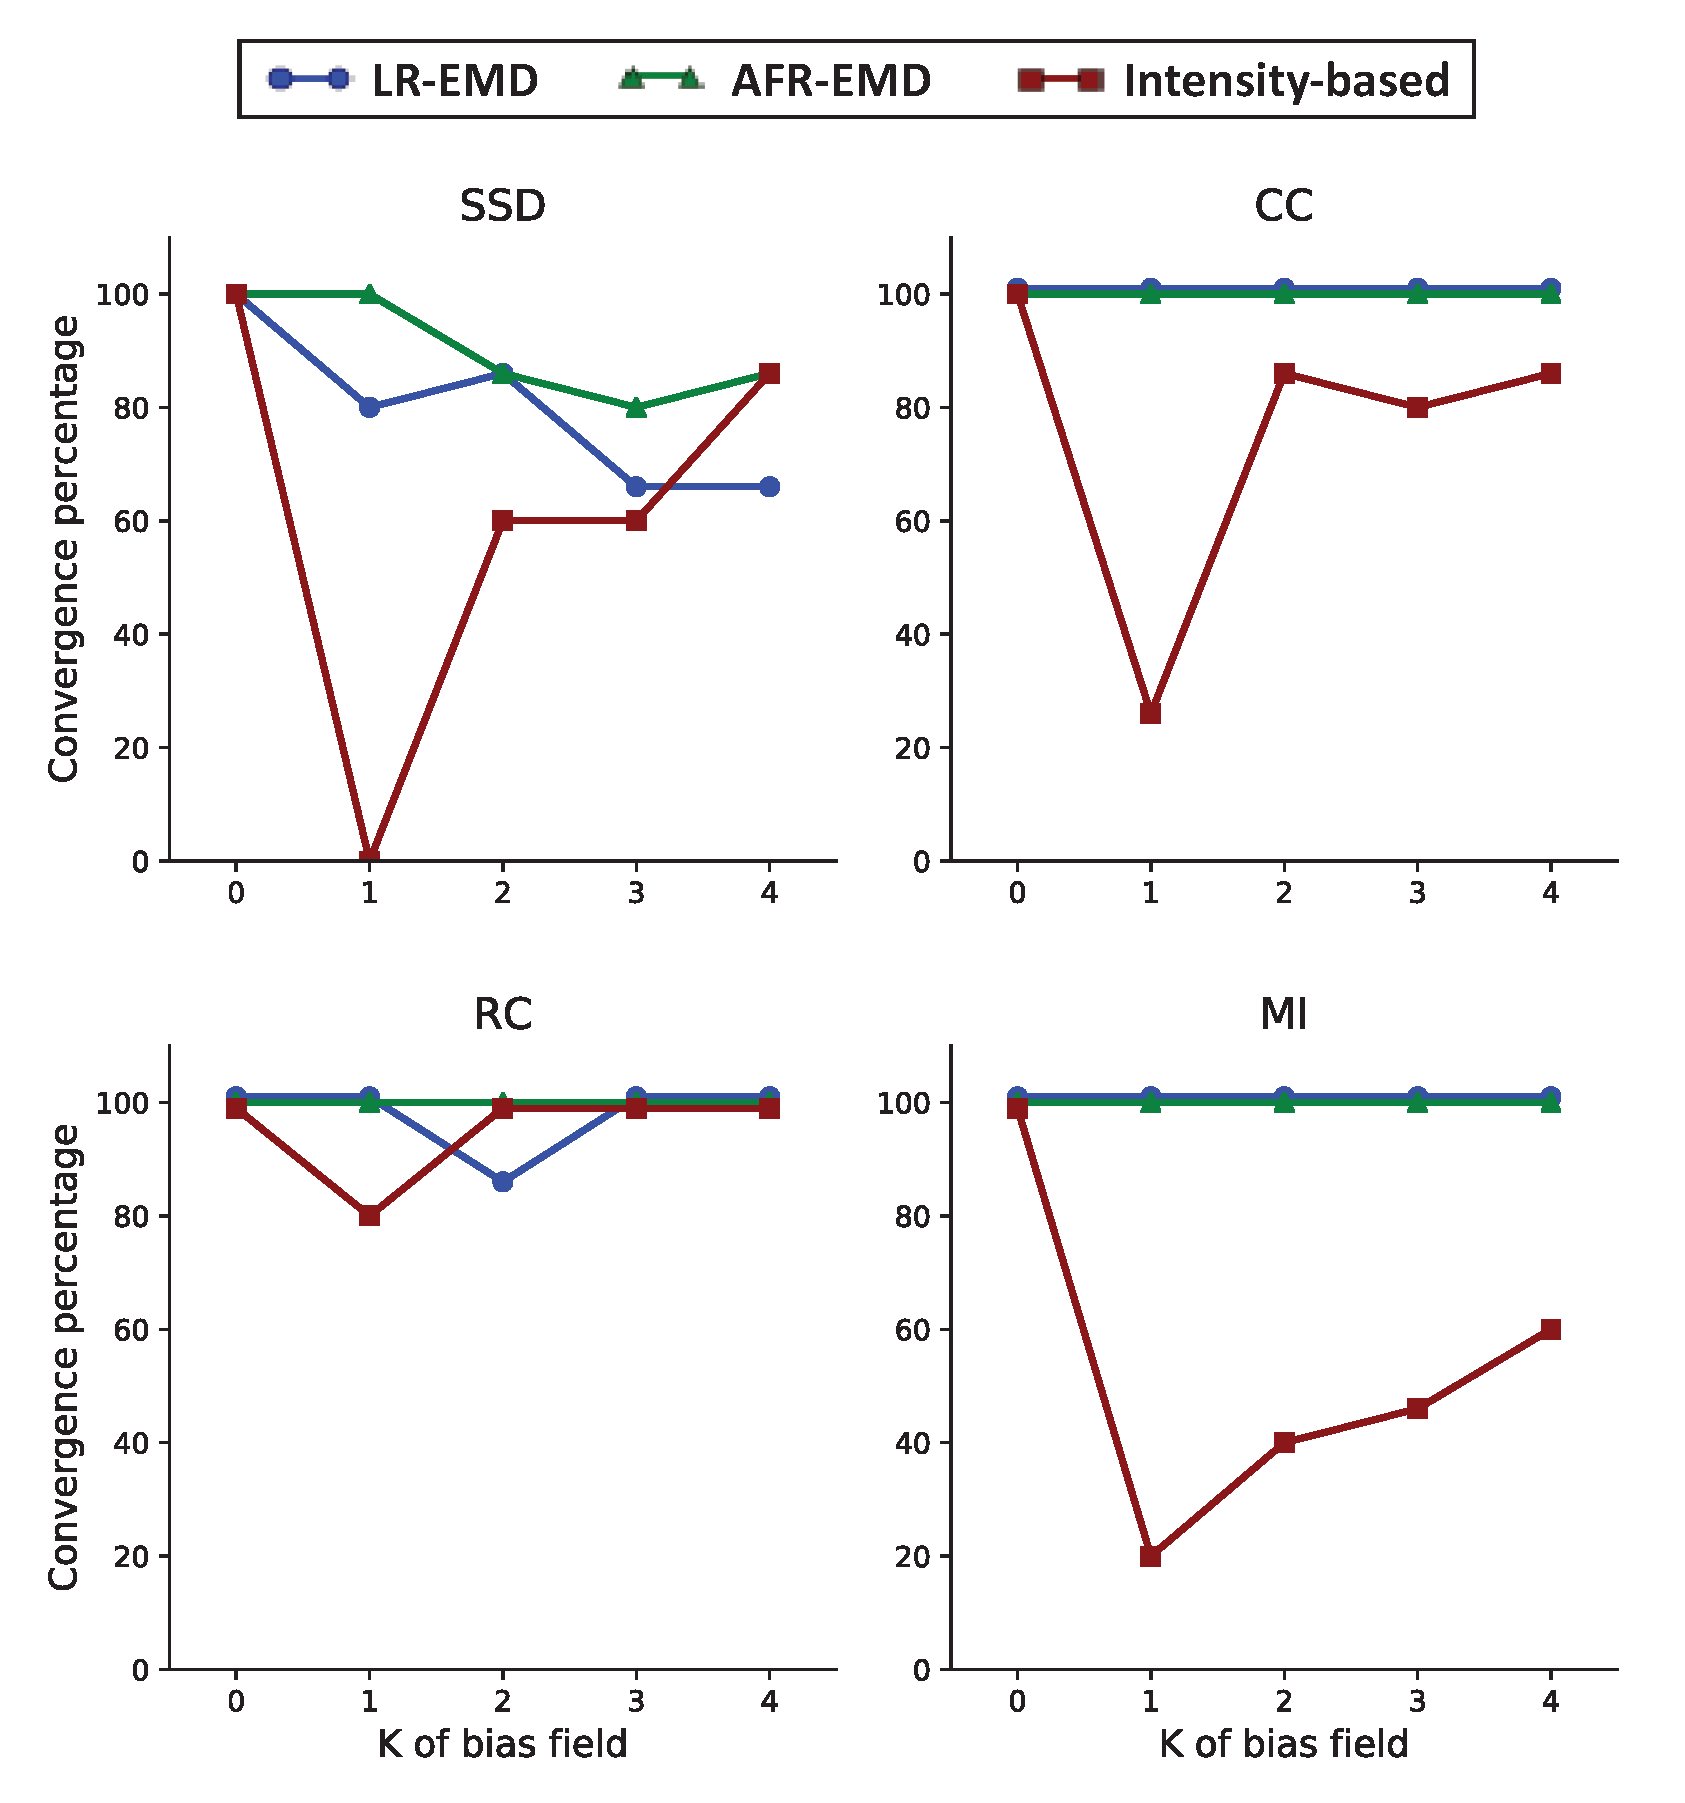
Next, we investigate the registration of the MR images in the presence of the bias field noise. This setting is particularly of interest to us because intensity-based algorithms often fail to converge when images are distorted by the bias field noise. Even converging algorithms have less accuracy compared to the registration of the same image without any bias field noise. To study the convergence of registration algorithms when images are noisy, we manually added Gaussian functions to both floating and reference images according to Equation (1). Then, we performed image registration using LR-EMD, AFR-EMD and the intensity-based benchmark algorithm. An algorithm is considered converged when the T-RMSE error is lower than four pixels. For each image in the BrainWeb dataset, we repeated the registration process for 15 random selection of the Gaussian kernel centers. The convergence rate is then defined as the number of converged algorithms divided by 15 (times 100 to get the percentage).
Figure 4 shows the convergence rate for each of the four similarity measures (SSD, CC, RC and MI). The number of Gaussian kernels are varied between (no bias field) to (four Gaussian kernels in each of the floating and reference images). For SSD, CC, and MI similarity measures, adding one Gaussian function remarkably degrades the convergence rate for the intensity-based algorithm (red curves in Figure 4). In particular, SSD never converged with one Gaussian kernel. This confirms previous observations that the intensity-based registration is not robust to the bias field noise. RC is the most robust similarity measure for the intensity-based registration with 80% convergence rate in the presence of one Gaussian kernel and 100% for two to four Gaussian kernels. Moving to our proposed EMD-based algorithms, we observe that both LR-EMD and AFR-EMD improve the convergence rate for almost all of the cases. Using MI or CC as the similarity measure, both LR-EMD and AFR-EMD converge 100% of the times while intensity-based registration converges in 20% to 60% of the times for MI and 25% to 80% of the times for CC. For SSD, both LR-EMD and AFR-EMD have higher convergence rate compared to benchmark registration for one to three Gaussian kernels. When four Gaussian kernels are present, LR-EMD has a lower convergence rate compared to the other two algorithms. This is primarily because of the low SNR in images. Overall, our results suggest that both EMD-based algorithms as well as the intensity-based registration with the RC similarity measure have a higher convergence rate compared to other similarity measures.
3.1.3. Registration Performance in the Presence of Bias Field
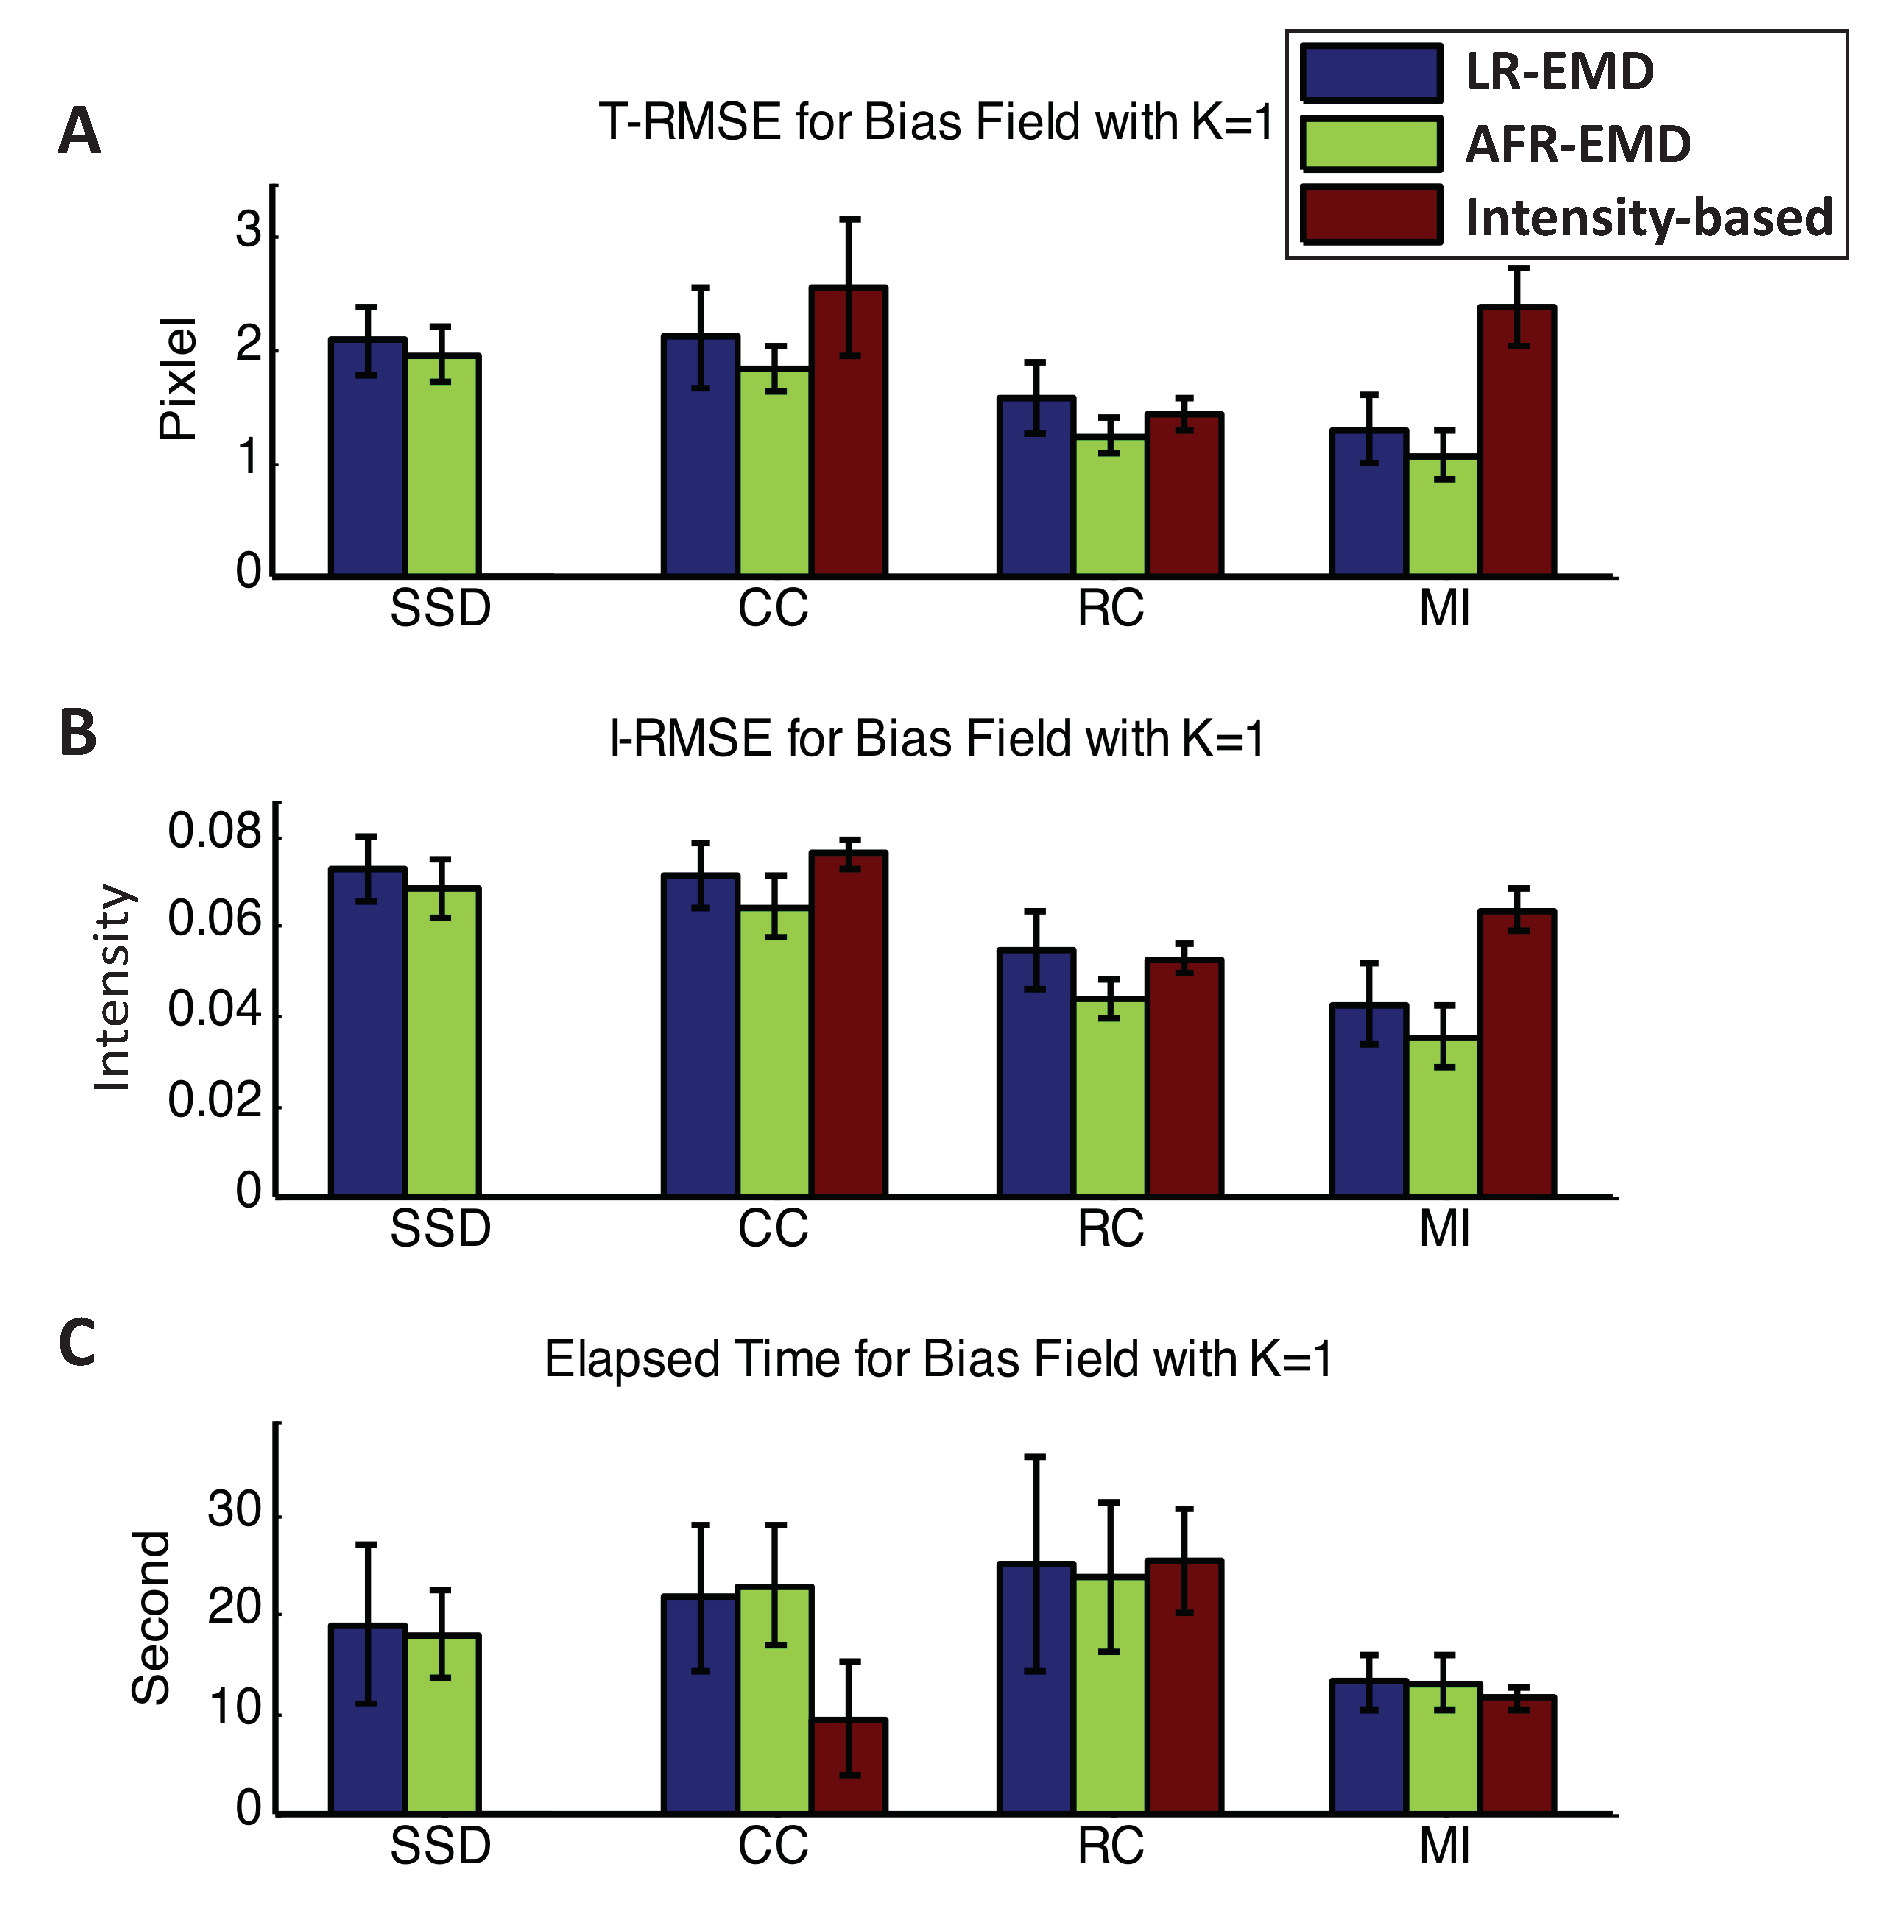
In this section, we study the performance of the registration algorithms across the experiments that have converged. First, we explore the case that each of the reference and floating images are corrupted by one Gaussian function (). The top two panels in Figure 5 show the T-RMSE and I-RMSE for the benchmark intensity-based algorithm as well as LR-EMD and AFR-EMD. For the SSD similarity measure, intensity-based registration has never converged, therefore, no corresponding error value is reported. For the MI similarity measure, both LR-EMD and AFR-EMD are remarkably more accurate compared to the intensity-based registration (50% lower T-RMSE and 40% lower I-RMSE). MI is a particularly interesting case because registration algorithms based on MI generally achieve a higher accuracy compared to the other three similarity measures and are often faster (Figure 5C). For the CC similarity measure, both EMD-based registrations have ∼20% lower average error rate. Using RC as the similarity measure, LR-EMD has a slightly higher average error rate compared to two other methods. The bottom panel in Figure 5 presents a comparison of the running time between the benchmark and two proposed algorithms. The intensity-based registration using CC similarity measure converges ∼50% faster compared to our two methods. All three algorithms have a similar running time when using MI as the similarity measure. Overall, both LR-EMD and AFR-EMD with the MI similarity measure achieve the highest accuracy with the lowest running time and are the best performing algorithms in the presence of one Gaussian kernel in the images.
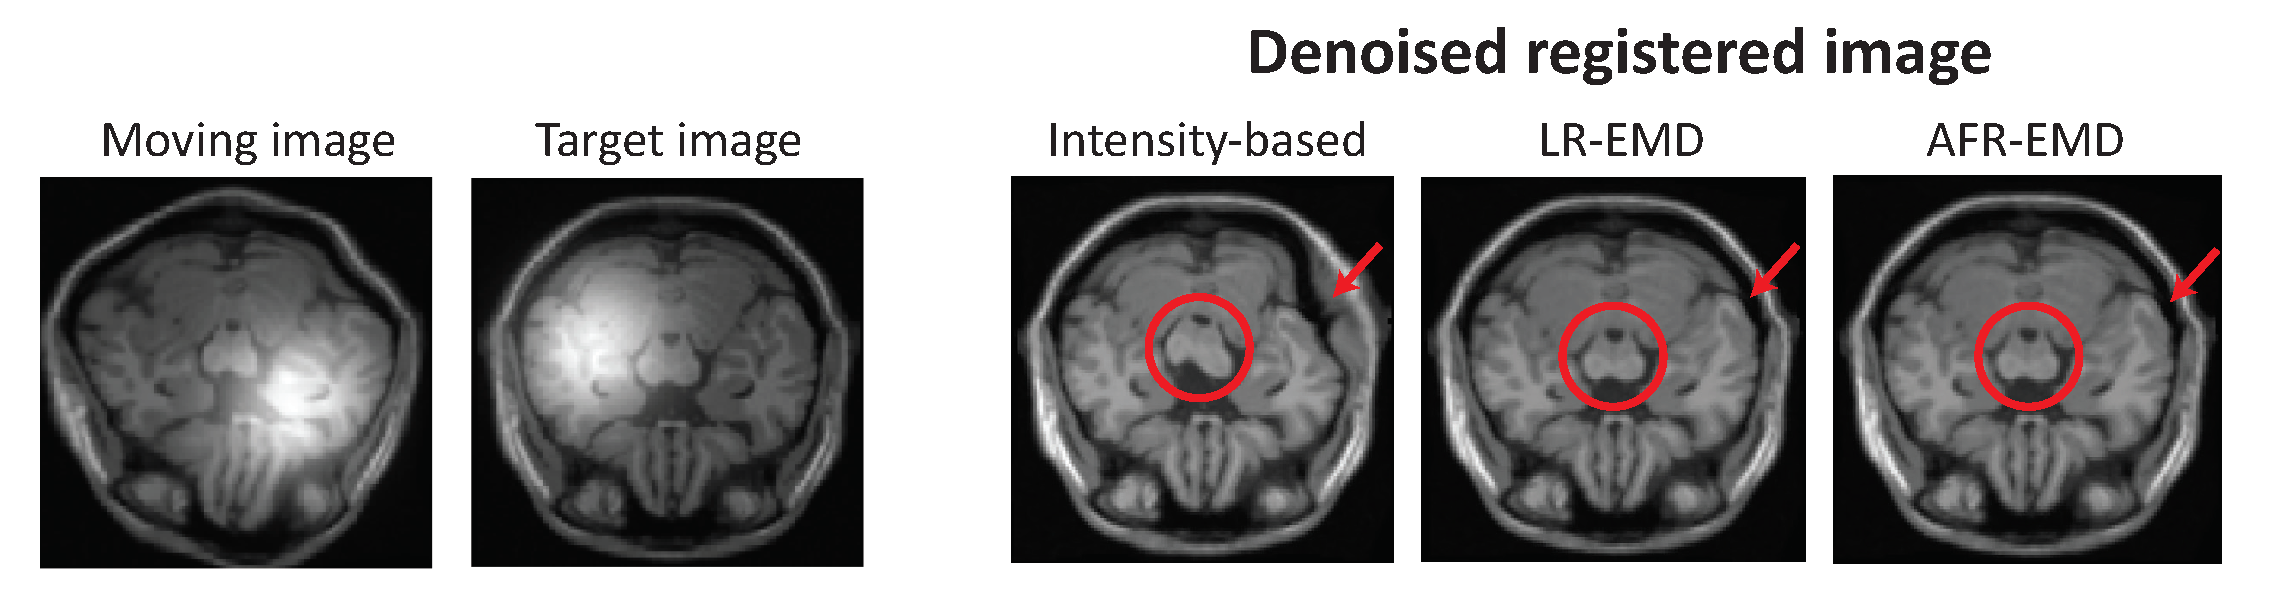
To present a more comprehensive comparison between our EMD-based registration algorithms and the benchmark method, one set of registered images is visualized in Figure 6. The image is randomly chosen from the BrainWeb dataset, then geometrically distorted using a random perturbation, and finally contaminated with Gaussian function. In this case, MI is used as the similarity measure. Two images in the left panel of Figure 6 are the moving and the target images, both contaminated with bias field noise. The denoised registered images are shown on the right for our two proposed algorithms and the intensity-based benchmark algorithm. Visually, both LR-EMD and AFR-EMD perform a more accurate registration compared to the intensity-based method for this image. The improvement is visible both in the cerebral peduncle (red circle) and within the top right area of the skull (red arrow).
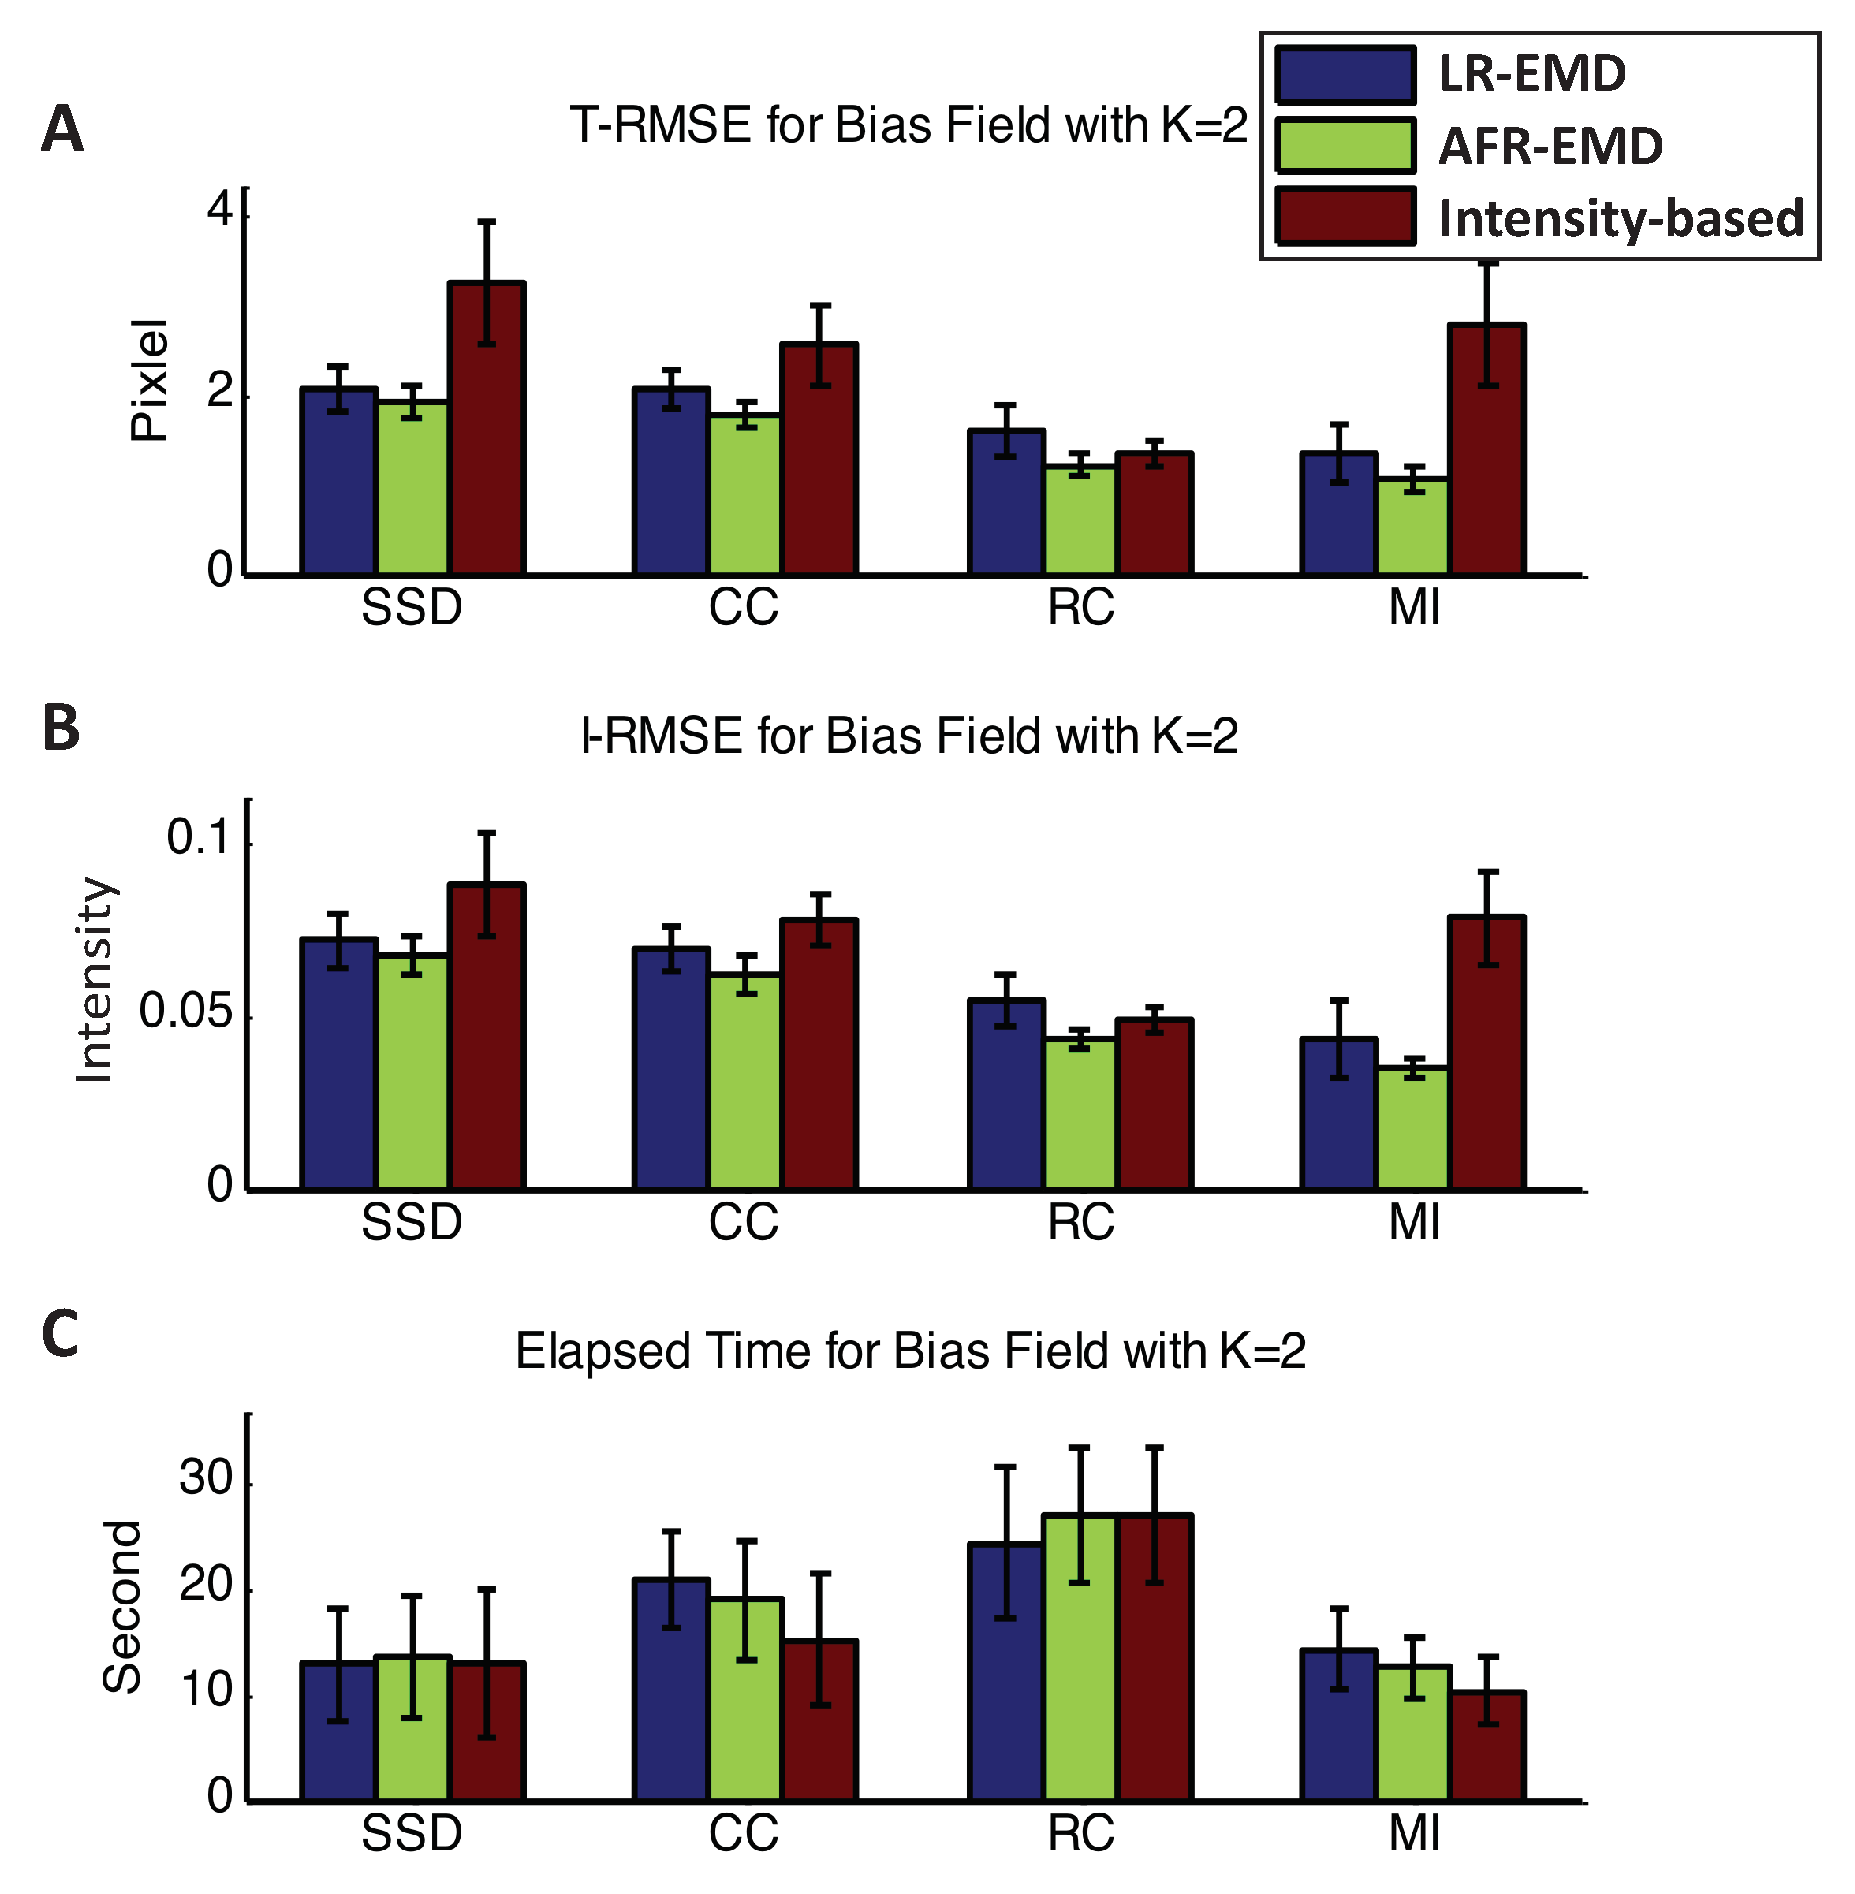
Figure 7 shows the accuracy and running time for registrations in the presence of two Gaussian kernels in each of the floating and reference images ( case). Two Gaussian kernels simulate a more intense bias field noise. Using any of the SSD, CC, or MI similarity measures, EMD-based registrations achieve higher accuracy both in T-RMSE and I-RMSE. For MI, EMD-based registrations have ∼60% lower T-RMSE and ∼50% lower I-RMSE compared to the benchmark method. For all similarity measures, LR-EMD has slightly higher accuracy compared to AFR-EMD.
Another observation that is worth noting is that, for the intensity-based benchmark algorithm, the RC similarity measure has at least ∼50% higher accuracy compared to any other similarity measures. This is consistent with observations in the previous studies on the robustness of RC to bias filed noise [22]. However, the running speed is at least ∼60% higher compared to other similarity measures. That is, there is a trade-off between accuracy and running speed for the RC similarity measure. Interestingly, this is not the case for the EMD-based algorithms when using MI similarity measures. Both LR-EMD and AFR-EMD achieve the highest accuracy and lowest running time compared to all other algorithms.
We have also determined the registration performance in the presence of three and four Gaussian kernels and reported the T-RMSE, I-RMSE, and the running time in Appendix A.1 (Figure A1 and Figure A2). For these two cases, the EMD-based methods have approximately similar performance to the intensity-based registration when SSD, CC, or RC are used as the similarity measure. When using MI as the similarity measure, EMD-based registrations achieve 40% to 65% higher accuracy both in T-RMSE and I-RMSE compared to the intensity-based registration. Overall, our results suggest that MI is the most suited similarity measure to the EMD-based registration techniques.
A summary of the quantitative performance measures is presented in Table 1. T-RMSE, I-RMSE, and the convergence percentages reported in this table are the average values across all the bias field noise conditions (). Using MI as the similarity measure, AFR-EMD achieves 42% lower error rate in intensity and 52% lower error rate in transformation compared to intensity-based hierarchical registration. AFR-EMD with MI achieves 27% lower error rate in intensity and 21% lower error rate for transformation compared to intensity-based registration with RC similarity measure (which is robust to bias field noise). For LR-EMD, the error rate is 32% lower for intensity and 41% lower for transformation when using MI similarity measure.
3.2. Evaluation of the Proposed Algorithms on the MRIs from the IBSR Dataset
To validate our proposed algorithms on real (non-simulated) MR images, we used both LR-EMD and AFR-EMD to register 18 brain MRIs in the Internet Brain Segmentation Repository (IBSR) dataset [46]. For this dataset, we performed registration across subjects and assessed the accuracy of registration based on alignment of the segmentation map for each image. More specifically, we computed the correlation coefficient between the segmentation maps of target and registered images. The segmentation map is manually-annotated and has been published by the Center for Morphometric Analysis at Massachusetts General Hospital (MGH). When there is no spatially varying noise present in the images, both LR-EMD and AFR-EMD registration methods as well as the intensity-based registration achieve an average of 73% overlap between the reference and registered images across all segmented areas. This is consistent with our observations in Section 3.1.1. Adding a Gaussian noise to both moving and target images (similar to the BrainWeb dataset with ) has no significant effect on the overlap ratio for the LR-EMD and AFR-EMD methods, but decreases the overlap ratio by an average of 13% for the intensity-based registration.
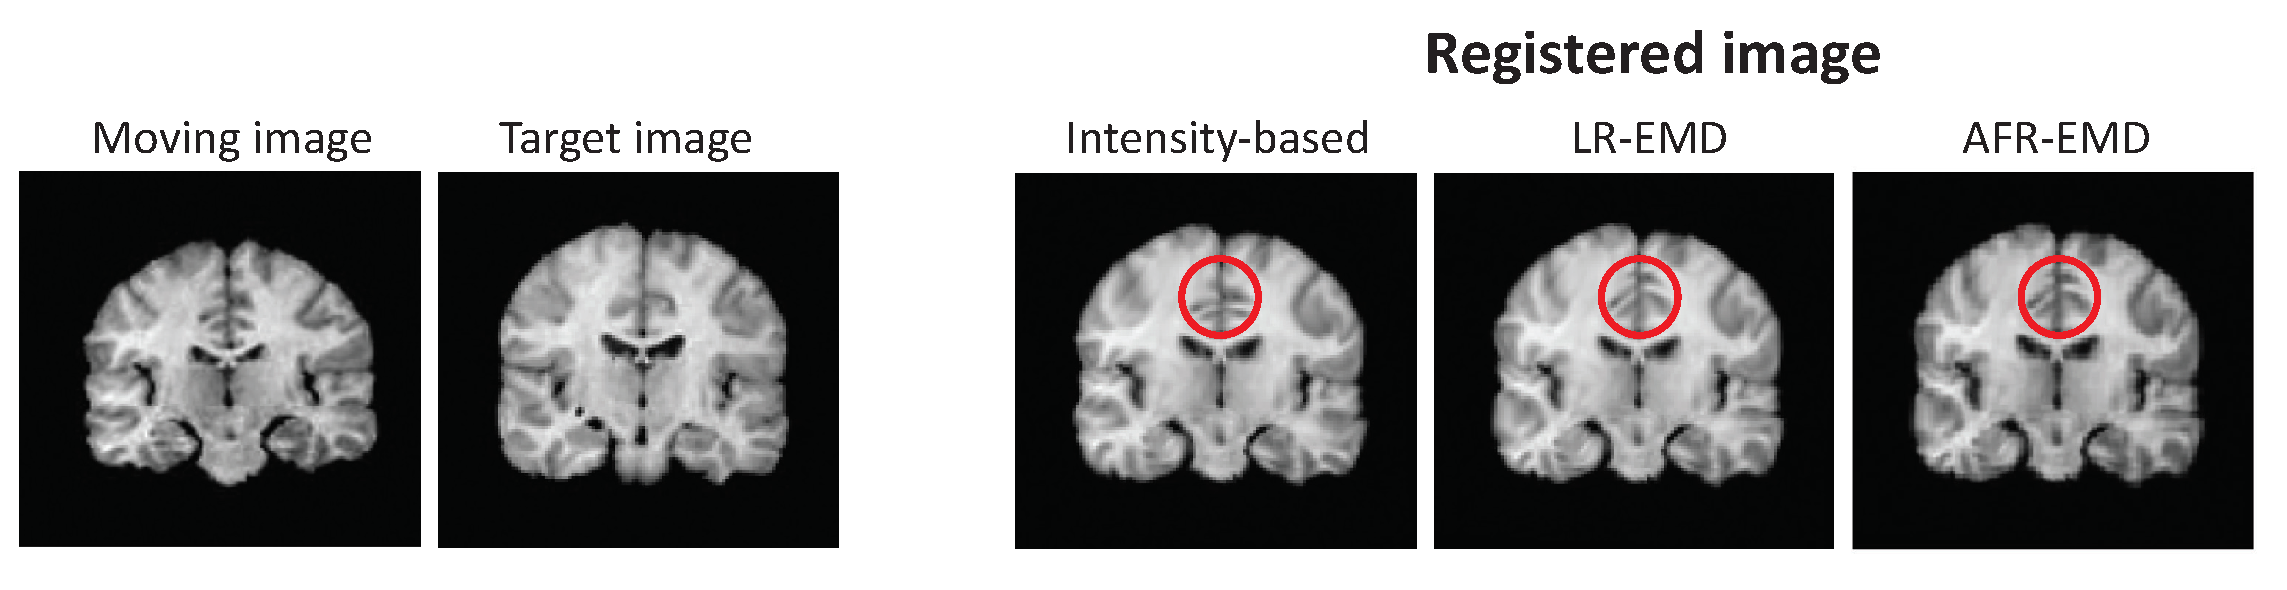
In Figure 8, the left two images show two examples of MR images from the IBSR dataset. The registered images using both LR-EMD, AFR-EMD as well as benchmark intensity-based registration are shown in Figure 8. Here, MI is used as similarity measure. All three registrations have visually similar performance. EMD-based registrations tend to have slightly more adaptation to the global structure of the reference image compared to intensity-based registration (red circle in Figure 8).
3.3. Evaluation of the Proposed Algorithms on Retina Images
So far, we have provided evidence for the superior performance of EMD-based registration methods for the registration of MR images compared to intensity-based methods. Here, we evaluate the proposed approach on retina images and in the presence of additive spatially varying intensity distortion. Retina images are frequently used in the diagnosis of various ophthalmological disorders. These images are often taken at different times. Hence image registration has a crucial role in the accurate comparison of the longitudinal retina images. However, these images are often distorted via a non-uniform background or spatially varying intensity noise. Previous studies have explored the application of vascular structures and landmarks in the registration of these noisy images [48,49]. However, the registration performance still remains far from perfect. Here, we investigate the application of LR-EMD and AFR-EMD in the registration of retina images.
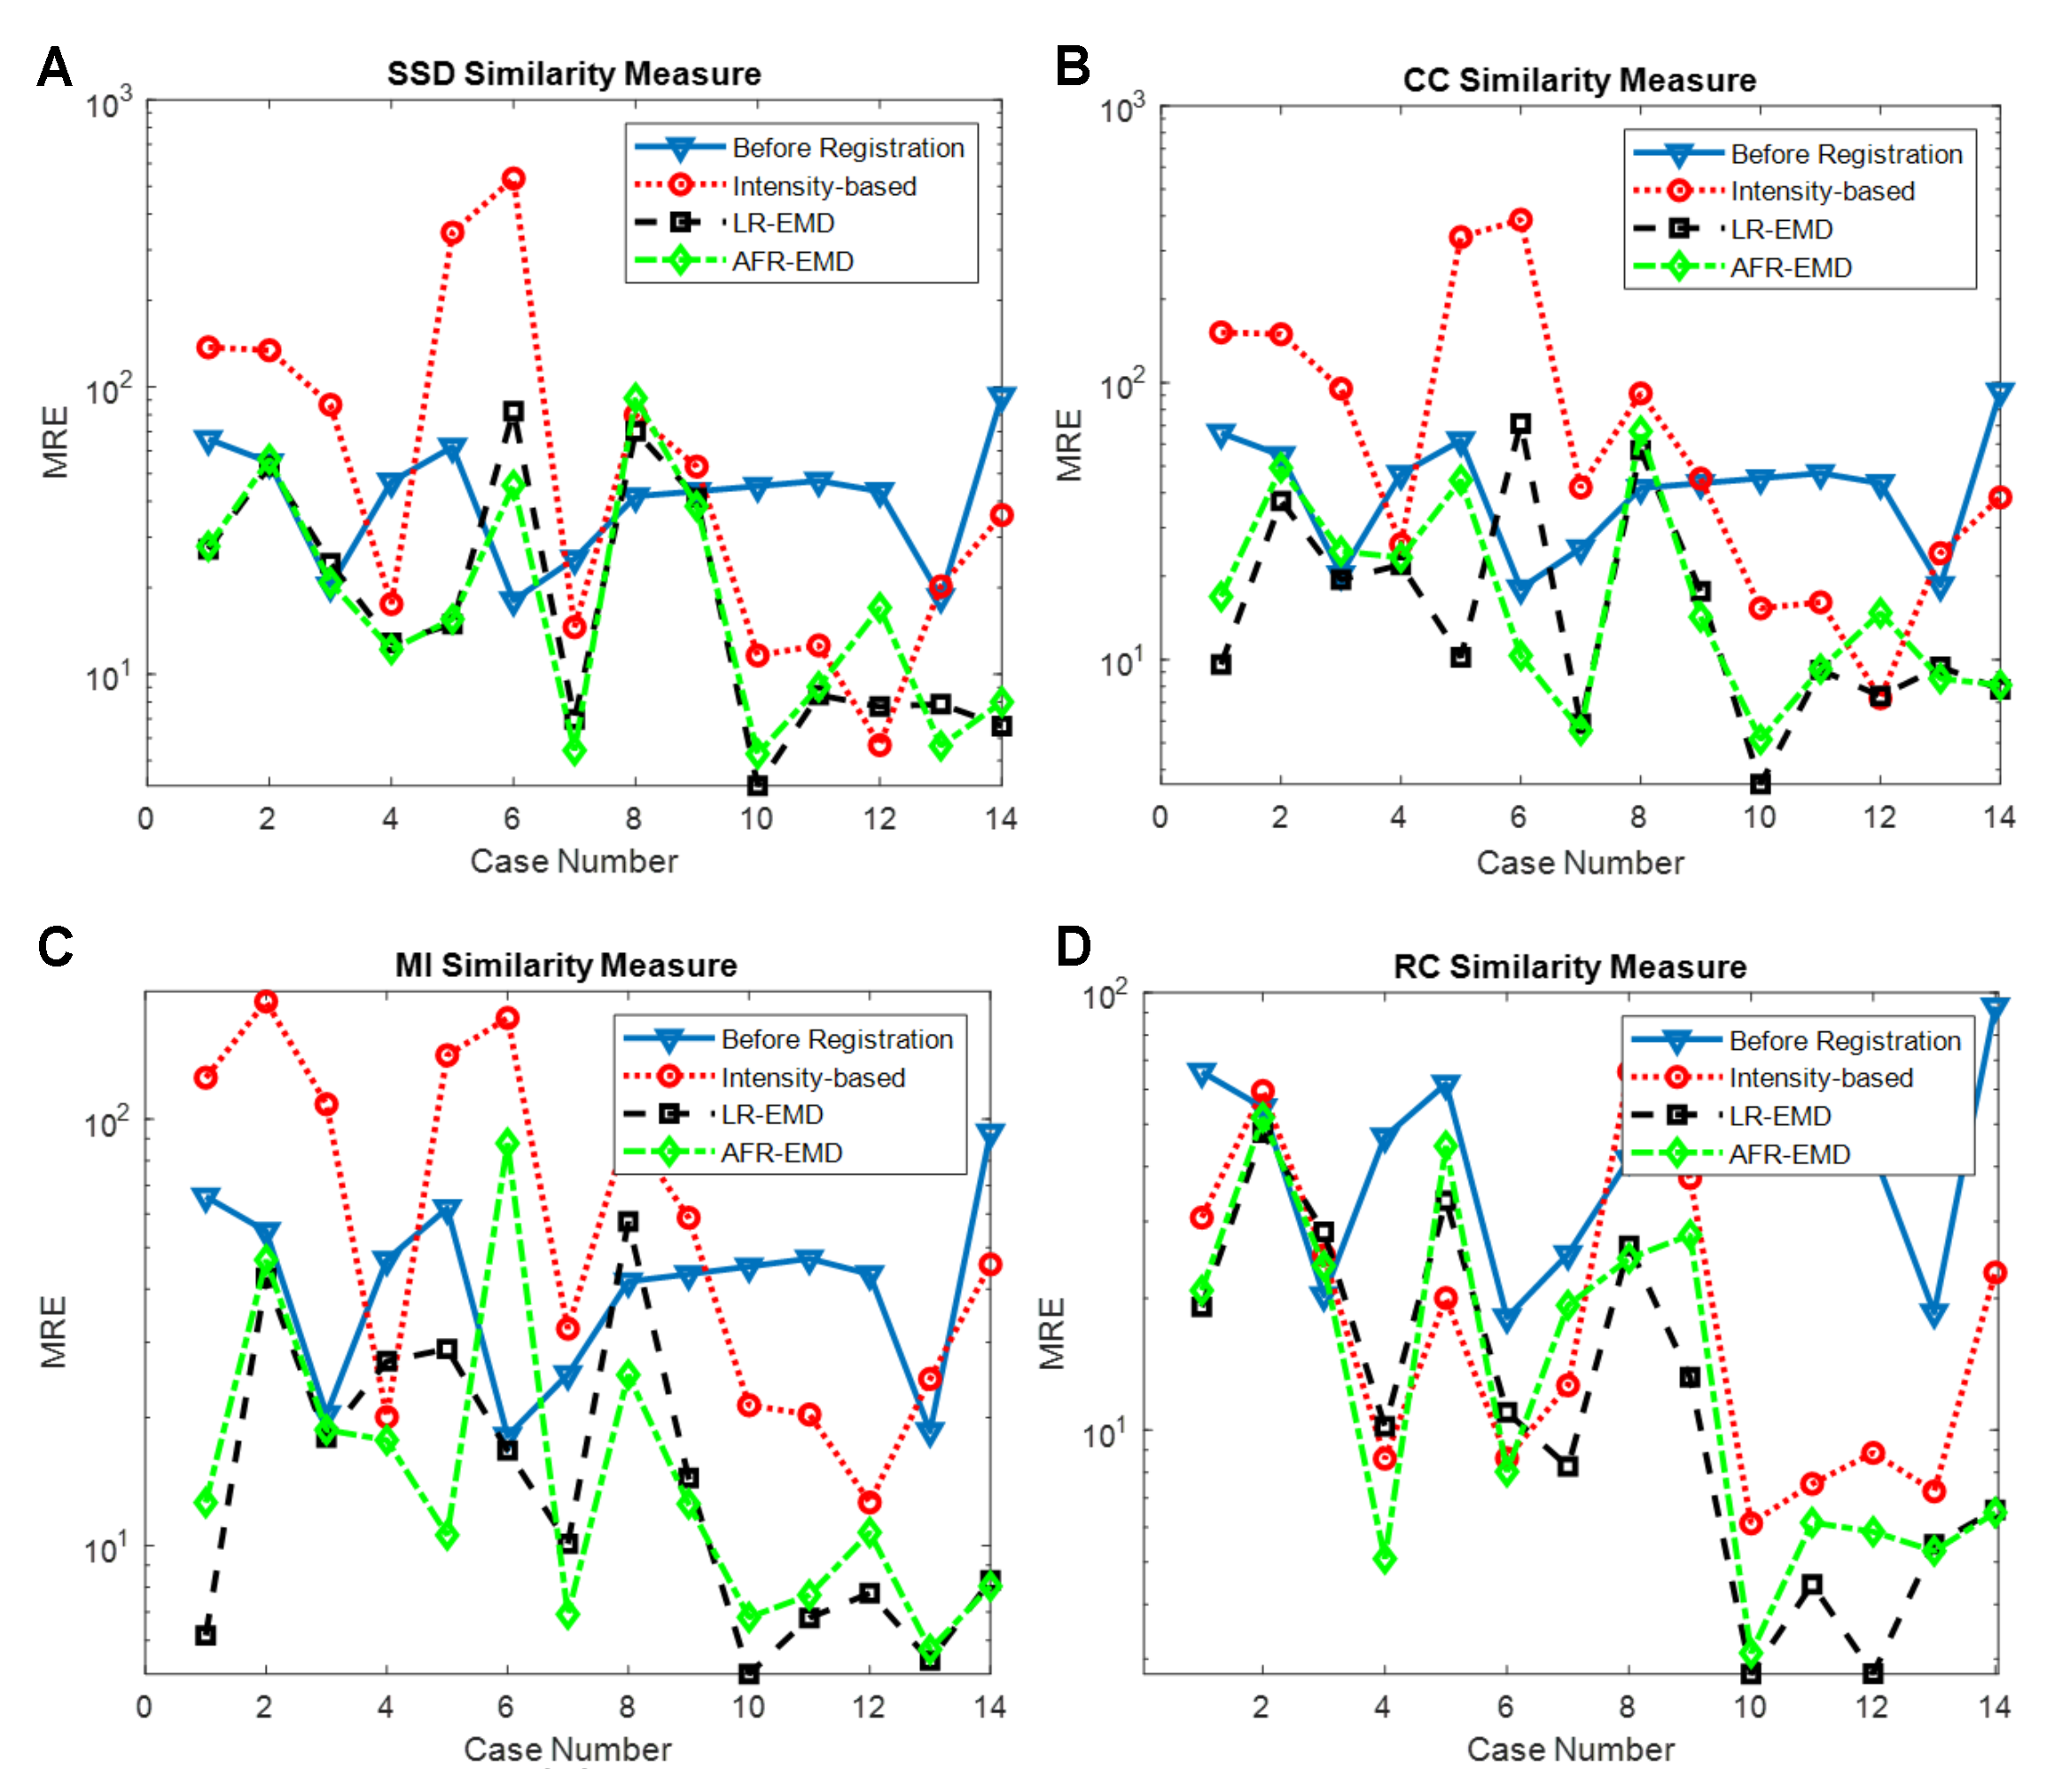
Here, we used category S of the Fundus Image Registration (FIRE) Dataset [47] to evaluate the proposed approaches. The two main challenges of this dataset are strong non-uniform spatially varying intensity distortion and outlier regions appearing in one image but not the other. In this dataset, the registration accuracy is quantified by the ten extracted anatomical landmarks. Hence, the error between landmarks in the reference and registered images as Mean Registration Error (MRE) is used to measure image registration performance. Figure 9 presents the registration performance of the proposed approaches in each case for different similarity measures. Table 2 also shows the average MRE for comparison of different similarity measures. It can be seen that the proposed approaches improve the performance of different similarity measures, especially for three measures of SSD, CC, and MI. These measures are not robust in the presence of spatially varying intensity distortion. The EMD based method results in improvement and robustness of these similarity measures.
In addition to the Fundus Image Registration (FIRE) Dataset, we used retina images in [50] taken two years apart (Figure 10A top panel) and visually evaluated the performance of our proposed registration methods. Both images were distorted via strong additive spatially-varying intensity noise. Figure 10A illustrates two levels of the IMFs and residuals for each image. The residuals contain a significant part of the spatially varying noise and the IMFs contain denoised patterns. Therefore, similar to brain MR images, the EMD-based features have decomposed the signal and noise into two separate components. Figure 10B demonstrates the performance of registration based on LR-EMD, AFR-EMD as well as the benchmark intensity-based algorithm for these retina images. Here, SSD is used as the similarity measure. From the figure, both LR-EMD, AFR-EMD visually outperform the intensity-based registration. This is demonstrated via the composite view through contour overlap after the registration in Figure 10B. In particular, the red circle shows the vascular pattern for which the intensity-based approach has failed to accurately register. Both LR-EMD and AFR-EMD are successful in registering this vascular pattern. This visual inspection suggests that both of the proposed methods are robust against the additive spatially varying intensity distortion in the retina images.
4. Discussion and Future Works
Throughout this paper, we presented evidence on the advantage of using empirical mode decomposition in the registration of single modal MR images. However, we believe that EMD has potentially a wide variety of applications in multi-modal image registration, image fusion, and image denoising. Particularly, multi-modal image registration has great potential for more investigations because EMD-based features are relatively robust to the modality. IMFs are made of normalized minimum and maximum envelopes of intensity. Therefore, the effect of modality-related variabilities is much less in IMFS. The idea of using EMD for multi-modal registration has been previously discussed [31], however, a more careful investigation of the applications of EMD in multi-modal image registration, such as CT-MR image registration, is still necessary.
Our findings in this study show the superior performance of EMD-based registration algorithms in registering 2D images. These image were either 2D planes from 3D MRIs or 2D retina images. In principle, both proposed algorithms could be used to register 3D images, however, the computational cost of determining EMD components could be considerably higher compared to 2D images. Our future work includes scaling up the implementation of EMD-based registration and explore the performance of proposed methods for 3D images. Additionally, our focus in this paper has been the correction of motion artifacts between acquisitions. Another type of motion artifact that is often present in medical images is distortions due to a patient’s inability to stay still during the acquisition. Correcting this type of motion artifact is beyond the scope of our proposed registration algorithms and require other motion correction techniques.
In regard to the nature of the spatially-varying noise, our simulation of the noise in the MR images is based on additive Gaussian noise. This model follows a strong body of previous studies [23,24,25,26]. However, the intensity non-uniformity in MRI could be also modeled via multiplication by a non-uniform distribution. The multiplicative artifact could be modeled as an additive artifact in the log-transformed MRI. Therefore, decomposition-based robust registration methods such as our proposed algorithms should be able to address the multiplicative noise in the log-space. In our future work, we will systematically assess the performance of our proposed algorithms in the presence of multiplicative spatial noise.
In this paper, we did not consider the problem of parametrization for the transformation. We have used free form deformation to formulate the transformation, however, EMD embedded in other transformation techniques needs further investigation. In particular, the application of nonlinear transforms such as neural networks [51] and random forest [52] in EMD-based registration needs extensive study. We believe that compressed non-linear networks [53] together with EMD could achieve fast and accurate registration in the presence of bias field noise. One advantage of these models is that the transform is more interpretable [54,55,56]. Other nonlinear modular techniques, such as the Hammerstein Wiener model, have shown impressive performance for applications such as nonlinear mapping in biomedical signal processing [57,58] and computational Neuroscience [59]. Employing these models as a core transformation technique between two images and possible EMD-based boost remains for future work.
Finally, we believe that EMD-based registration techniques generalize well to other registration applications. Remote sensing and satellite images, other medical applications such as retina and angiography image registration, and computer vision applications such as stereo vision, are a few examples. An extensive study on the performance of EMD-based registration for these applications is necessary for the future.
Author Contributions
R.A.-A. and E.F. conceived the experiments, R.A.-A. and A.G. conducted the experiments. All authors analyzed the data. R.A.-A. wrote the manuscript with contributions from A.G. and E.F. All authors have read and agreed to the published version of the manuscript.
Funding
R.A. gratefully acknowledges support from the Weill Neurohub.
Data Availability Statement
Conflicts of Interest
The authors declare no conflict of interest.
Appendix A
Appendix A.1. Registration Performance in the Presence of Three and Four Gaussian Kernels
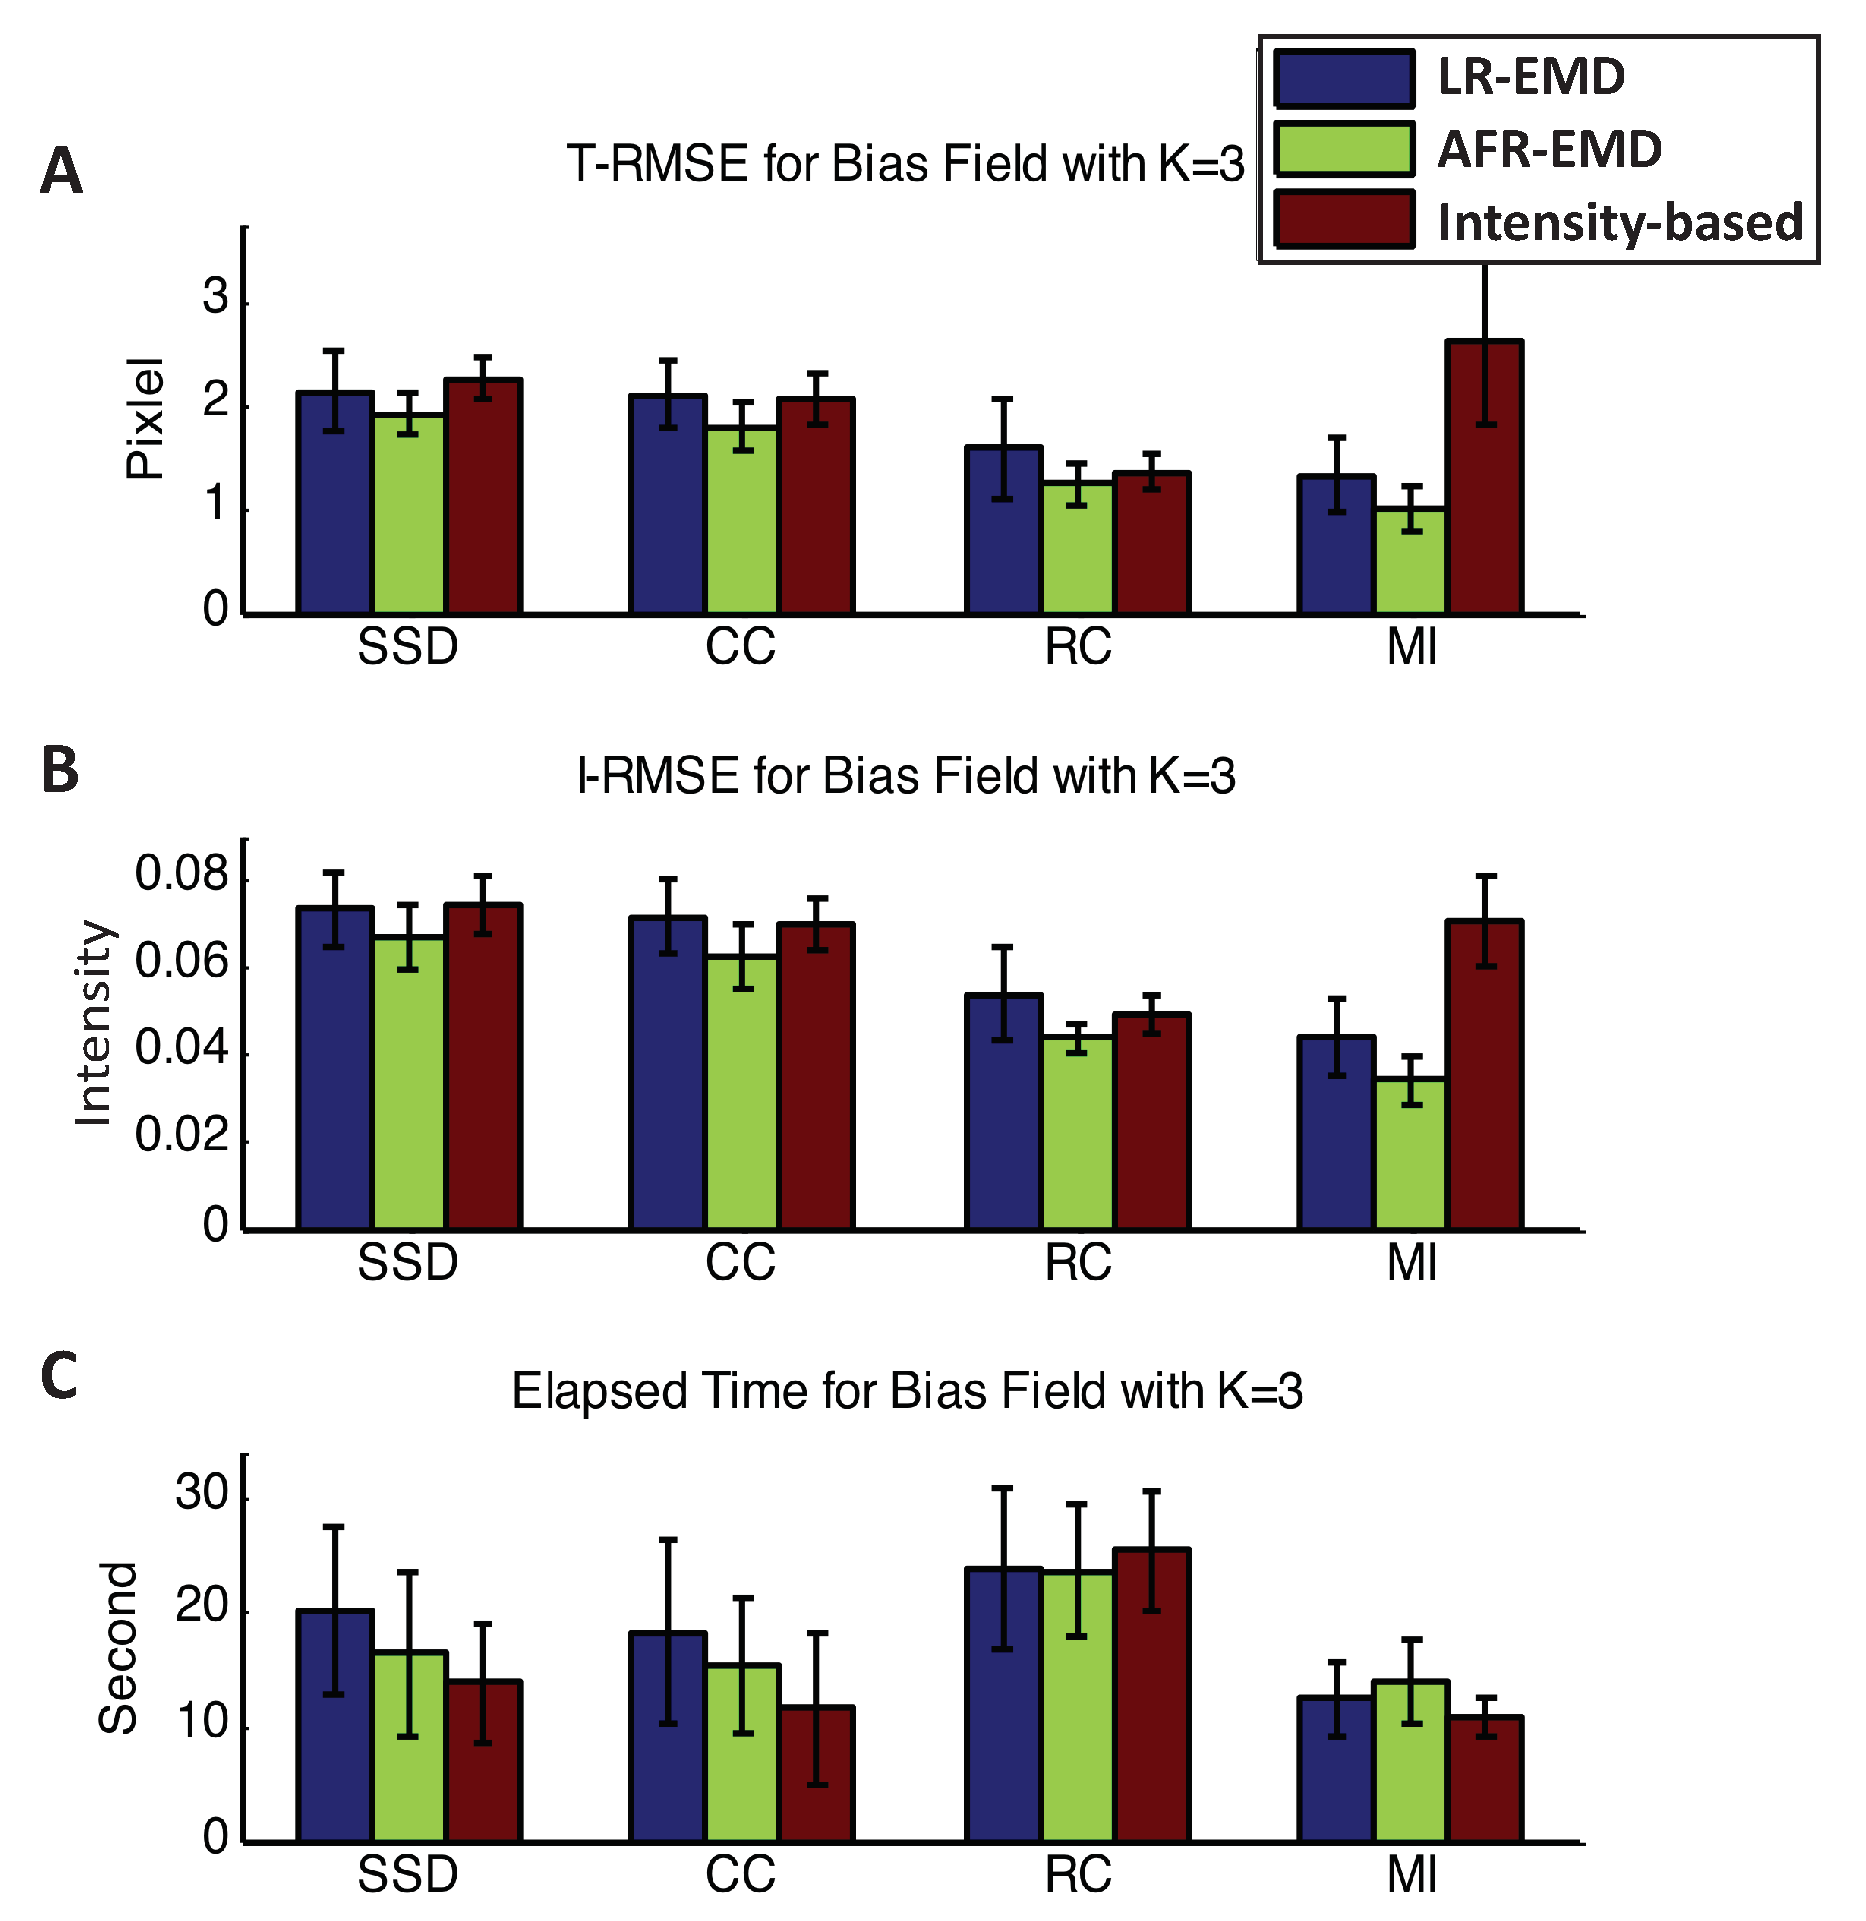
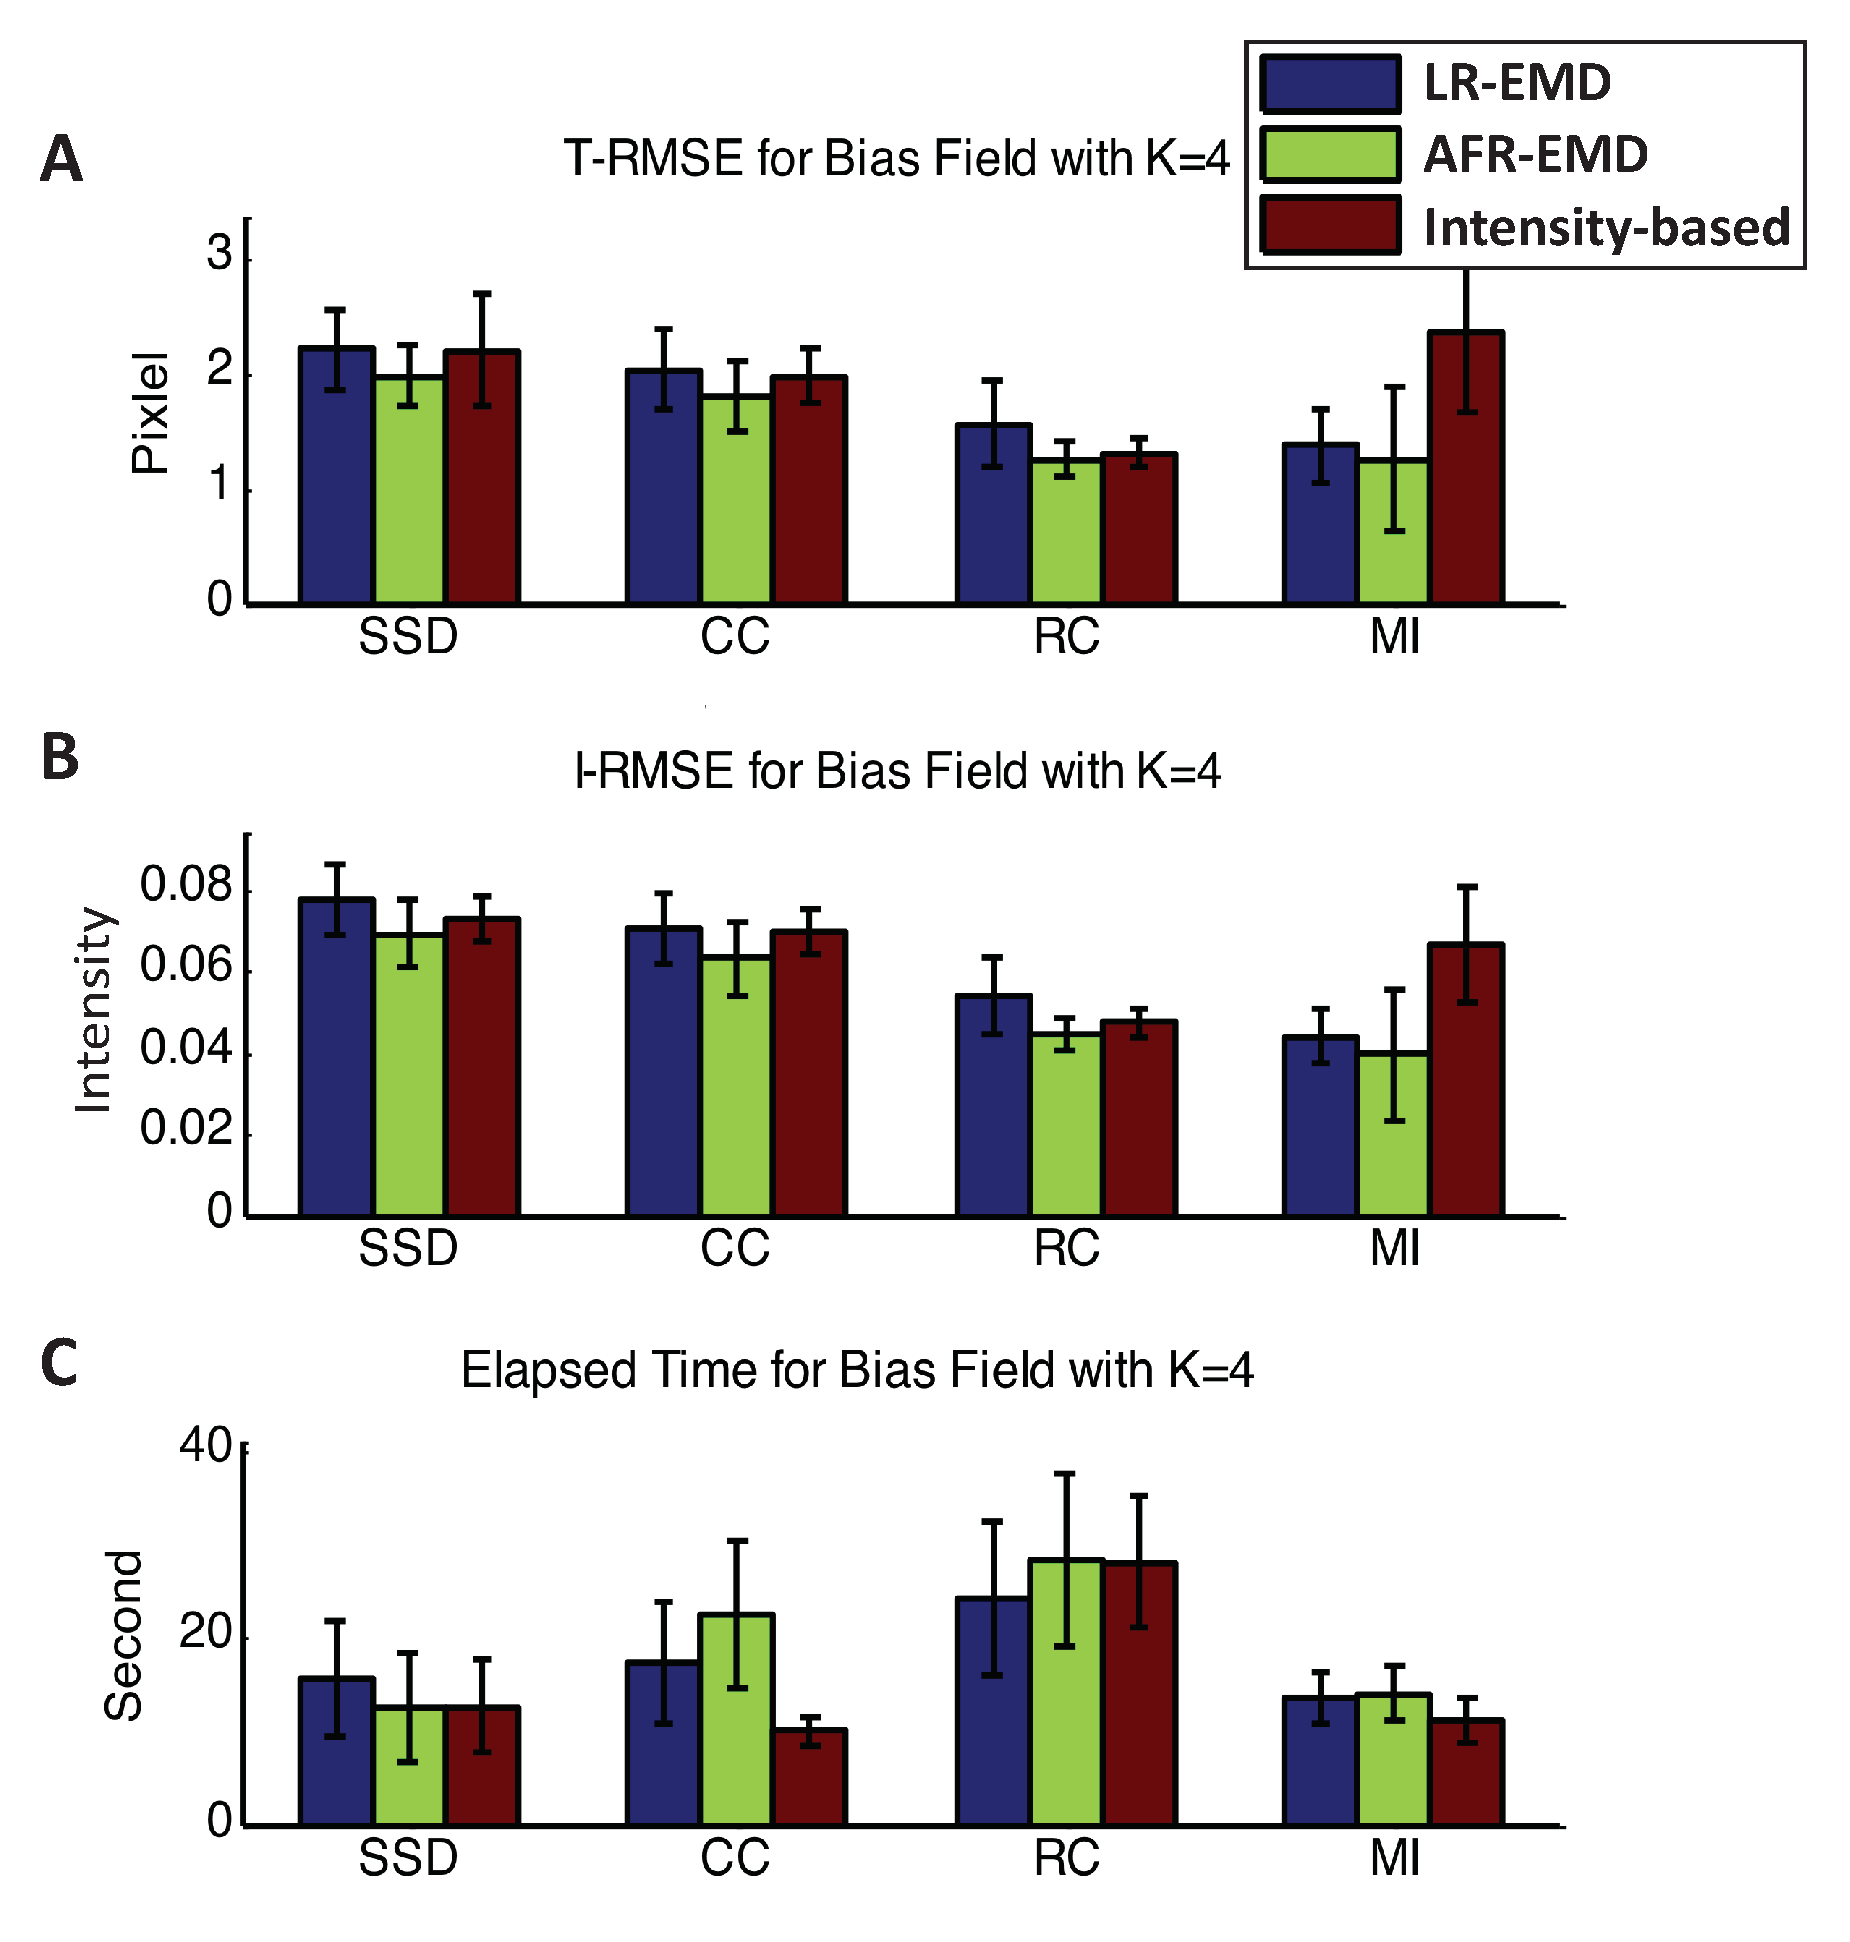
Figure A1 and Figure A2 presents the T-RMSE, I-RMSE, and the running time for the registration algorithms in the presence of three and four Gaussian kernels. Using SSD, CC, or RC as the similarity measure, EMD-based methods have approximately similar performance to the intensity-based registration. When using MI as the similarity measure, EMD-based registrations achieve 40% to 65% higher accuracy both in T-RMSE and I-RMSE compared to the intensity-based registration. Similar to the cases where one or two Gaussian kernels were present, MI attains the most accurate and the fastest registration compared to the other three similarity measures.
Figure A1.
Registration performance in the presence of three Gaussian kernels. Mean and variance of T-RMSE and I-RMSE for images in BrainWeb dataset are shown in (A,B) panels. (C) panel compares the running time for all methods.
Figure A1.
Registration performance in the presence of three Gaussian kernels. Mean and variance of T-RMSE and I-RMSE for images in BrainWeb dataset are shown in (A,B) panels. (C) panel compares the running time for all methods.

Figure A2.
Registration performance in the presence of four Gaussian kernels. Mean and variance of T-RMSE and I-RMSE for images in BrainWeb dataset are shown in (A,B) panels. (C) panel compares the running time for all methods.
Figure A2.
Registration performance in the presence of four Gaussian kernels. Mean and variance of T-RMSE and I-RMSE for images in BrainWeb dataset are shown in (A,B) panels. (C) panel compares the running time for all methods.

References
- Sotiras, A.; Davatzikos, C.; Paragios, N. Deformable medical image registration: A survey. IEEE Trans. Med. Imaging 2013, 32, 1153–1190. [Google Scholar] [CrossRef] [PubMed] [Green Version]
- Feng, Q.; Zhou, Y.; Li, X.; Mei, Y.; Lu, Z.; Zhang, Y.; Feng, Y.; Liu, Y.; Yang, W.; Chen, W. Liver DCE-MRI registration in manifold space based on robust principal component analysis. Sci. Rep. 2016, 6, 34461. [Google Scholar] [CrossRef] [Green Version]
- Brooks, R.R.; Iyengar, S.S. Multi-Sensor Fusion: Fundamentals and Applications with Software; Prentice-Hall, Inc.: Hillsdale, NJ, USA, 1998. [Google Scholar]
- Wang, C.W.; Gosno, E.B.; Li, Y.S. Fully automatic and robust 3D registration of serial-section microscopic images. Sci. Rep. 2015, 5, 15051. [Google Scholar] [CrossRef]
- Wang, C.W.; Ka, S.M.; Chen, A. Robust image registration of biological microscopic images. Sci. Rep. 2014, 4, 6050. [Google Scholar] [CrossRef] [PubMed] [Green Version]
- Matsuda, A.; Schermelleh, L.; Hirano, Y.; Haraguchi, T.; Hiraoka, Y. Accurate and fiducial-marker-free correction for three-dimensional chromatic shift in biological fluorescence microscopy. Sci. Rep. 2018, 8, 7583. [Google Scholar] [CrossRef] [Green Version]
- Lucas, B.D.; Kanade, T. An iterative image registration technique with an application to stereo vision. In Proceedings of the Image Understanding Workshop, Vancouver, BC, Canada, 24–28 August 1981. [Google Scholar]
- Wang, Y.J.; Chen, P.J.; Liang, X.; Lin, Y.H. Augmented reality with image registration, vision correction and sunlight readability via liquid crystal devices. Sci. Rep. 2017, 7, 433. [Google Scholar] [CrossRef] [Green Version]
- Brock, K.K.; Dawson, L.A.; Sharpe, M.B.; Moseley, D.J.; Jaffray, D.A. Feasibility of a novel deformable image registration technique to facilitate classification, targeting, and monitoring of tumor and normal tissue. Int. J. Radiat. Oncol. Biol. Phys. 2006, 64, 1245–1254. [Google Scholar] [CrossRef] [PubMed]
- Thompson, P.M.; Giedd, J.N.; Woods, R.P.; MacDonald, D.; Evans, A.C.; Toga, A.W. Growth patterns in the developing brain detected by using continuum mechanical tensor maps. Nature 2000, 404, 190–193. [Google Scholar] [CrossRef]
- Vemuri, B.C.; Ye, J.; Chen, Y.; Leonard, C.M. Image registration via level-set motion: Applications to atlas-based segmentation. Med. Image Anal. 2003, 7, 1–20. [Google Scholar] [CrossRef]
- Oliveira, F.P.; Tavares, J.M.R. Medical image registration: A review. Comput. Methods Biomech. Biomed. Eng. 2014, 17, 73–93. [Google Scholar] [CrossRef]
- Johnson, H.J.; Christensen, G.E. Consistent landmark and intensity-based image registration. IEEE Trans. Med. Imaging 2002, 21, 450–461. [Google Scholar] [CrossRef]
- Ghanbari, A.; Abbasi-Asl, R.; Ghaffari, A.; Fatemizadeh, E. Automatic b-spline image registration using histogram-based landmark extraction. In Proceedings of the 2012 IEEE-EMBS Conference on Biomedical Engineering and Sciences, Langkawi, Malaysia, 17–19 December 2012; pp. 1004–1008. [Google Scholar]
- Shen, D.; Davatzikos, C. HAMMER: Hierarchical attribute matching mechanism for elastic registration. IEEE Trans. Med. Imaging 2002, 21, 1421–1439. [Google Scholar] [CrossRef]
- Liao, S.; Chung, A.C. Feature based nonrigid brain MR image registration with symmetric alpha stable filters. IEEE Trans. Med. Imaging 2010, 29, 106–119. [Google Scholar] [CrossRef] [Green Version]
- Abbasi-Asl, R.; Fatemizadeh, E. MMRO: A feature selection criterion for mr images based on alpha stable filter responses. In Proceedings of the 7th Iranian Conference on Machine Vision and Image Processing (MVIP), Tehran, Iran, 16–17 November 2011; pp. 1–5. [Google Scholar]
- Wells, W.M.; Viola, P.; Atsumi, H.; Nakajima, S.; Kikinis, R. Multi-modal volume registration by maximization of mutual information. Med. Image Anal. 1996, 1, 35–51. [Google Scholar] [CrossRef]
- Maes, F.; Collignon, A.; Vandermeulen, D.; Marchal, G.; Suetens, P. Multimodality image registration by maximization of mutual information. IEEE Trans. Med. Imaging 1997, 16, 187–198. [Google Scholar] [CrossRef] [Green Version]
- Guyader, J.M.; Huizinga, W.; Poot, D.H.; van Kranenburg, M.; Uitterdijk, A.; Niessen, W.J.; Klein, S. Groupwise image registration based on a total correlation dissimilarity measure for quantitative MRI and dynamic imaging data. Sci. Rep. 2018, 8, 13112. [Google Scholar] [CrossRef] [PubMed]
- Studholme, C.; Drapaca, C.; Iordanova, B.; Cardenas, V. Deformation-based mapping of volume change from serial brain MRI in the presence of local tissue contrast change. IEEE Trans. Med. Imaging 2006, 25, 626–639. [Google Scholar] [CrossRef]
- Myronenko, A.; Song, X. Intensity-based image registration by minimizing residual complexity. IEEE Trans. Med. Imaging 2010, 29, 1882–1891. [Google Scholar] [CrossRef]
- Ghaffari, A.; Fatemizadeh, E. RISM: Single-modal image registration via rank-induced similarity measure. IEEE Trans. Image Process. 2015, 24, 5567–5580. [Google Scholar] [CrossRef]
- Ghaffari, A.; Fatemizadeh, E. Image Registration based on Low Rank Matrix: Rank-Regularized SSD. IEEE Trans. Med. Imaging 2018, 37, 138–150. [Google Scholar] [CrossRef] [PubMed]
- Afzali, M.; Ghaffari, A.; Fatemizadeh, E.; Soltanian-Zadeh, H. Medical image registration using sparse coding of image patches. Comput. Biol. Med. 2016, 73, 56–70. [Google Scholar] [CrossRef] [PubMed]
- Ghaffari, A.; Fatemizadeh, E. Robust Huber similarity measure for image registration in the presence of spatially-varying intensity distortion. Signal Process. 2015, 109, 54–68. [Google Scholar] [CrossRef]
- Pohl, K.M.; Fisher, J.; Levitt, J.J.; Shenton, M.E.; Kikinis, R.; Grimson, W.E.L.; Wells, W.M. A unifying approach to registration, segmentation, and intensity correction. In Proceedings of the Medical Image Computing and Computer-Assisted Intervention—MICCAI 2005, Palm Springs, CA, USA, 26–29 October 2005; pp. 310–318. [Google Scholar]
- Friston, K.; Ashburner, J.; Frith, C.D.; Poline, J.B.; Heather, J.D.; Frackowiak, R.S. Spatial registration and normalization of images. Hum. Brain Mapp. 1995, 3, 165–189. [Google Scholar] [CrossRef]
- Huang, N.E.; Shen, Z.; Long, S.R.; Wu, M.C.; Shih, H.H.; Zheng, Q.; Yen, N.C.; Tung, C.C.; Liu, H.H. The empirical mode decomposition and the Hilbert spectrum for nonlinear and non-stationary time series analysis. Proc. R. Soc. Lond. Math. Phys. Eng. Sci. R. Soc. 1998, 454, 903–995. [Google Scholar] [CrossRef]
- Riffi, J.; Mahraz, A.M.; Tairi, H. Medical image registration based on fast and adaptive bidimensional empirical mode decomposition. IET Image Process. 2013, 7, 567–574. [Google Scholar] [CrossRef]
- Jinsha, Y.; Zhenbing, Z.; Qiang, G.; Jie, D.; Meng, L. Multimodal image registration based on empirical mode decomposition and mutual information. Chin. J. Sci. Instrum. 2009, 10, 12. [Google Scholar]
- Guryanov, F.; Krylov, A. Fast medical image registration using bidirectional empirical mode decomposition. Signal Process. Image Commun. 2017, 59, 12–17. [Google Scholar] [CrossRef]
- Looney, D.; Mandic, D.P. Multiscale image fusion using complex extensions of EMD. IEEE Trans. Signal Process. 2009, 57, 1626–1630. [Google Scholar] [CrossRef]
- Schafer, R.W.; Rabiner, L.R. A digital signal processing approach to interpolation. Proc. IEEE 1973, 61, 692–702. [Google Scholar] [CrossRef] [Green Version]
- Antonini, M.; Barlaud, M.; Mathieu, P.; Daubechies, I. Image coding using wavelet transform. IEEE Trans. Image Process. 1992, 1, 205–220. [Google Scholar] [CrossRef] [Green Version]
- Wu, Z.; Huang, N.E. A study of the characteristics of white noise using the empirical mode decomposition method. Proc. R. Soc. Lond. Math. Phys. Eng. Sci. R. Soc. 2004, 460, 1597–1611. [Google Scholar] [CrossRef]
- Huang, N.E.; Wu, M.L.; Qu, W.; Long, S.R.; Shen, S.S. Applications of Hilbert–Huang transform to non-stationary financial time series analysis. Appl. Stoch. Model. Bus. Ind. 2003, 19, 245–268. [Google Scholar] [CrossRef]
- Ren, Y.; Suganthan, P.; Srikanth, N. A comparative study of empirical mode decomposition-based short-term wind speed forecasting methods. IEEE Trans. Sustain. Energy 2015, 6, 236–244. [Google Scholar] [CrossRef]
- Park, C.; Looney, D.; ur Rehman, N.; Ahrabian, A.; Mandic, D.P. Classification of motor imagery BCI using multivariate empirical mode decomposition. IEEE Trans. Neural Syst. Rehabil. Eng. 2013, 21, 10–22. [Google Scholar] [CrossRef] [Green Version]
- Hao, H.; Wang, H.; Rehman, N. A joint framework for multivariate signal denoising using multivariate empirical mode decomposition. Signal Process. 2017, 135, 263–273. [Google Scholar] [CrossRef]
- Nunes, J.C.; Bouaoune, Y.; Delechelle, E.; Niang, O.; Bunel, P. Image analysis by bidimensional empirical mode decomposition. Image Vis. Comput. 2003, 21, 1019–1026. [Google Scholar] [CrossRef]
- Chen, Y.; Feng, M.Q. A technique to improve the empirical mode decomposition in the Hilbert-Huang transform. Earthq. Eng. Eng. Vib. 2003, 2, 75–85. [Google Scholar] [CrossRef] [Green Version]
- Available online: http://www.bic.mni.mcgill.ca/brainweb/ (accessed on 10 January 2013).
- Rueckert, D.; Sonoda, L.I.; Hayes, C.; Hill, D.L.; Leach, M.O.; Hawkes, D.J. Nonrigid registration using free-form deformations: Application to breast MR images. IEEE Trans. Med. Imaging 1999, 18, 712–721. [Google Scholar] [CrossRef]
- Cocosco, C.A.; Kollokian, V.; Kwan, R.K.S.; Pike, G.B.; Evans, A.C. Brainweb: Online Interface to a 3D MRI Simulated Brain Database. NeuroImage. Citeseer. 1997. Available online: http://www.bic.mni.mcgill.ca/users/crisco/HBM97_poster/HBM97_poster.pdf (accessed on 10 January 2013).
- Available online: http://www.cma.mgh.harvard.edu/ibsr/ (accessed on 10 January 2013).
- Hernandez-Matas, C.; Zabulis, X.; Triantafyllou, A.; Anyfanti, P.; Douma, S.; Argyros, A.A. FIRE: Fundus image registration dataset. Model. Artif. Intell. Ophthalmol. 2017, 1, 16–28. [Google Scholar] [CrossRef]
- Ghassabi, Z.; Shanbehzadeh, J.; Sedaghat, A.; Fatemizadeh, E. An efficient approach for robust multimodal retinal image registration based on UR-SIFT features and PIIFD descriptors. EURASIP J. Image Video Process. 2013, 2013, 25. [Google Scholar] [CrossRef] [Green Version]
- Stewart, C.V.; Tsai, C.L.; Roysam, B. The dual-bootstrap iterative closest point algorithm with application to retinal image registration. IEEE Trans. Med. Imaging 2003, 22, 1379–1394. [Google Scholar] [CrossRef] [PubMed]
- Zana, F.; Meunier, I.; Klein, J. A region merging algorithm using mathematical morphology: Application to macula detection. Comput. Imaging Vis. 1998, 12, 423–430. [Google Scholar]
- Specht, D.F. A general regression neural network. IEEE Trans. Neural Netw. 1991, 2, 568–576. [Google Scholar] [CrossRef] [PubMed] [Green Version]
- Breiman, L. Random forests. Mach. Learn. 2001, 45, 5–32. [Google Scholar] [CrossRef] [Green Version]
- Abbasi-Asl, R.; Yu, B. Structural Compression of Convolutional Neural Networks with Applications in Interpretability. Front. Big Data 2021, 4, 704182. [Google Scholar] [CrossRef] [PubMed]
- Abbasi-Asl, R.; Yu, B. Interpreting Convolutional Neural Networks Through Compression. arXiv 2017, arXiv:1711.02329. [Google Scholar]
- Vellido, A.; Martín-Guerrero, J.D.; Lisboa, P.J. Making machine learning models interpretable. In Proceedings of the ESANN 2012 proceedings: European Symposium on Artificial Neural Networks, Computational Intelligence and Machine Learning, Bruges, Belgium, 25–27 April 2012; Volume 12, pp. 163–172. [Google Scholar]
- Murdoch, W.J.; Singh, C.; Kumbier, K.; Abbasi-Asl, R.; Yu, B. Definitions, methods, and applications in interpretable machine learning. Proc. Natl. Acad. Sci. USA 2019, 116, 22071–22080. [Google Scholar] [CrossRef] [Green Version]
- Abbasi-Asl, R.; Khorsandi, R.; Farzampour, S.; Zahedi, E. Estimation of muscle force with emg signals using hammerstein-wiener model. IFMBE Proc. BIOMED 2011, 35, 157–160. [Google Scholar]
- Hunter, I.W.; Korenberg, M.J. The identification of nonlinear biological systems: Wiener and Hammerstein cascade models. Biol. Cybern. 1986, 55, 135–144. [Google Scholar] [CrossRef]
- Abbasi-Asl, R.; Khorsandi, R.; Vosooghi-Vahdat, B. Hammerstein-Wiener Model: A New Approach to the Estimation of Formal Neural Information. Basic Clin. Neurosci. 2012, 3, 45–51. [Google Scholar]
Figure 1.
Simulated bias field noise in MR image. (A). Sample two-dimensional Gaussian function. (B). We manually add A Gaussian function with random mean to both floating and reference MR images.
Figure 1.
Simulated bias field noise in MR image. (A). Sample two-dimensional Gaussian function. (B). We manually add A Gaussian function with random mean to both floating and reference MR images.

Figure 2.
EMD separates bias field noise from the intrinsic components. The set of IMFs and residuals for three levels of EMD are shown for both floating and reference images. The Gaussian function is explained in the residuals and IMFs are noise free.
Figure 2.
EMD separates bias field noise from the intrinsic components. The set of IMFs and residuals for three levels of EMD are shown for both floating and reference images. The Gaussian function is explained in the residuals and IMFs are noise free.

Figure 3.
Registration performance when there is no bias field. Mean and variance of T-RMSE and I-RMSE for images in the BrainWeb dataset are shown in (A,B) panels. (C) panel compares the running time for all methods.
Figure 3.
Registration performance when there is no bias field. Mean and variance of T-RMSE and I-RMSE for images in the BrainWeb dataset are shown in (A,B) panels. (C) panel compares the running time for all methods.

Figure 4.
The convergence rate for baseline hierarchical registration with downsampling and our proposed algorithms based on EMD. Each panel corresponds to one similarity measure (SSD, CC, RC and MI). Here, the convergence is defined as T-RMSE error lower than four pixels.
Figure 4.
The convergence rate for baseline hierarchical registration with downsampling and our proposed algorithms based on EMD. Each panel corresponds to one similarity measure (SSD, CC, RC and MI). Here, the convergence is defined as T-RMSE error lower than four pixels.

Figure 5.
Registration performance in the presence of one Gaussian kernel. Mean and variance of T-RMSE and I-RMSE for images in BrainWeb dataset are shown in (A,B) panels. (C) panel compares the running time for all methods.
Figure 5.
Registration performance in the presence of one Gaussian kernel. Mean and variance of T-RMSE and I-RMSE for images in BrainWeb dataset are shown in (A,B) panels. (C) panel compares the running time for all methods.

Figure 6.
Target and reference images from BrainWeb MR dataset and registered images using our two methods and intensity-based hierarchical algorithm. MI is used as the similarity measure. Visually, both LR-EMD and AFR-EMD improve the registration accuracy in the center of image (red circle) and at the edge (red arrow).

Figure 7.
Registration performance in the presence of two Gaussian kernels. Mean and variance of T-RMSE and I-RMSE for images in BrainWeb dataset are shown in (A,B) panels. (C) panel compares the running time for all methods.
Figure 7.
Registration performance in the presence of two Gaussian kernels. Mean and variance of T-RMSE and I-RMSE for images in BrainWeb dataset are shown in (A,B) panels. (C) panel compares the running time for all methods.

Figure 8.
Target and reference images from IBSR MR dataset and registered images using our two methods and intensity-based hierarchical algorithm.
Figure 8.
Target and reference images from IBSR MR dataset and registered images using our two methods and intensity-based hierarchical algorithm.

Figure 9.
Registration accuracy of different similarity measures in three approaches of intensity-based, LR-EMD, and AFR-EMD. (A). SSD, (B). CC, (C). MI, (D). RC.
Figure 9.
Registration accuracy of different similarity measures in three approaches of intensity-based, LR-EMD, and AFR-EMD. (A). SSD, (B). CC, (C). MI, (D). RC.

Figure 10.
Registration of Retina images taken 2 years apart. (A) The set of IMFs and residuals for two levels of EMD are shown for both target and moving images. (B) Registered images using our two methods and intensity-based hierarchical algorithm. The second row shows the composite view through contour overlap after the registration.


Table 1.
Summary of the quantitative performance measures. The measures for the best-performing algorithms are highlighted in bold.
Table 1.
Summary of the quantitative performance measures. The measures for the best-performing algorithms are highlighted in bold.
| Similarity Measure | Method | Convergence % | T-RMSE | I-RMSE |
|---|---|---|---|---|
| SSD | Intensity-based | 61.33% | 2.393 ± 0.375 | 0.075 ± 0.008 |
| LR-EMD | 80% | 2.088 ± 0.309 | 0.073 ± 0.008 | |
| AFR-EMD | 90% | 1.927 ± 0.206 | 0.067 ± 0.007 | |
| CC | Intensity-based | 76% | 2.167 ± 0.341 | 0.069 ± 0.007 |
| LR-EMD | 100% | 2.032 ± 0.323 | 0.069 ± 0.008 | |
| AFR-EMD | 100% | 1.777 ± 0.213 | 0.062 ± 0.007 | |
| RC | Intensity-based | 96% | 1.331 ± 0.142 | 0.048 ± 0.003 |
| LR-EMD | 97.33% | 1.544 ± 0.357 | 0.053 ± 0.009 | |
| AFR-EMD | 100% | 1.217 ± 0.153 | 0.043 ± 0.003 | |
| MI | Intensity-based | 53% | 2.205 ± 0.516 | 0.062 ± 0.009 |
| LR-EMD | 100% | 1.299 ± 0.325 | 0.042 ± 0.008 | |
| AFR-EMD | 100% | 1.054 ± 0.266 | 0.035 ± 0.007 |
Table 2.
Registration performance of different approaches in the application of retina images.
| Average MRE | |||
|---|---|---|---|
| Similarity Measure | Intensity-Based | LR-EMD | AFR-EMD |
| SSD | 106.19 | 26.27 | 25.6 |
| CC | 106.19 | 26.27 | 25.6 |
| RC | 22.97 | 15.7 | 18.06 |
| MI | 76.27 | 18.18 | 19.85 |
Publisher’s Note: MDPI stays neutral with regard to jurisdictional claims in published maps and institutional affiliations. |
© 2022 by the authors. Licensee MDPI, Basel, Switzerland. This article is an open access article distributed under the terms and conditions of the Creative Commons Attribution (CC BY) license (https://creativecommons.org/licenses/by/4.0/).
Share and Cite
MDPI and ACS Style
Abbasi-Asl, R.; Ghaffari, A.; Fatemizadeh, E. Robust Registration of Medical Images in the Presence of Spatially-Varying Noise. Algorithms 2022, 15, 58. https://doi.org/10.3390/a15020058
AMA Style
Abbasi-Asl R, Ghaffari A, Fatemizadeh E. Robust Registration of Medical Images in the Presence of Spatially-Varying Noise. Algorithms. 2022; 15(2):58. https://doi.org/10.3390/a15020058
Chicago/Turabian StyleAbbasi-Asl, Reza, Aboozar Ghaffari, and Emad Fatemizadeh. 2022. "Robust Registration of Medical Images in the Presence of Spatially-Varying Noise" Algorithms 15, no. 2: 58. https://doi.org/10.3390/a15020058
Note that from the first issue of 2016, this journal uses article numbers instead of page numbers. See further details here.