Article

Yeast Surface Dual Display Platform for Rapid Discovery of Shark VNAR from a Semi-Synthetic Library Followed by Next-Generation Sequencing

1
Anilink Biotech Ltd., Changhua 50056, Taiwan
2
Department of Aquaculture, National Pingtung University of Science and Technology, Pingtung 91201, Taiwan
*
Author to whom correspondence should be addressed.
Appl. Sci. 2023, 13(20), 11520; https://doi.org/10.3390/app132011520
Submission received: 13 September 2023 / Revised: 17 October 2023 / Accepted: 17 October 2023 / Published: 20 October 2023
(This article belongs to the Section Applied Biosciences and Bioengineering)

Abstract

:
The shark-derived single-domain antibody VNAR (variable domain of new antigen receptor) has many advantageous features that make the VNAR suitable for improving current monoclonal antibody therapy deficiencies or disease diagnosis methods. In order to discover more VNARs, it is necessary to improve the efficiency of the isolation process. This research aims to enhance the VNAR discovery platform by dual displaying the semi-synthetic VNAR library and green fluorescent protein tag on the yeast surface. The GFP tag can be used to determine the degree of VNAR expression. The diversity of the semi-synthetic VNAR library constructed in this study is verified to be 1.97 × 10⁹ by next-generation sequencing (NGS). We conveniently screened VNARs against the feline neonatal Fc receptor or feline infectious peritonitis virus nucleocapsid protein by sequential MACS and FACS. To find more diverse VNARs, we analyzed the NGS data of VNAR CDR3 genes before and after biopanning. By comparing the frequency change of each sequence, we found that the amplification factor of sequences was increased by biopanning. Four VNAR candidates selected by the high-frequency and high-amplification factor criteria showed an antigen-binding ability. The results demonstrate that biopanning from a yeast surface displaying a semi-synthetic VNAR library followed by the NGS assay can generate antigen binders rapidly without the need for shark rearing and long-term immunization.

1. Introduction

Since the in vitro method of monoclonal antibodies (mAbs) isolation by the hybridoma technology was proposed in 1975 [1], mAbs have become a hot topic in drug research today. Bamlanivimab and Etesevimab, which can be used to detect and treat coronavirus disease 2019 (COVID-19), have played an enormous role in controlling the pandemic [2]. Multiple disulfide bonds combine two heavy-chain and two light-chain proteins to form a mAb with a molecular weight of about 150 kDa. The heavy and light chain’s complementary-determining region (CDR) is responsible for recognizing and binding a specific amino acid sequence or protein conformation. The considerable molecular weight of mAbs has caused some limitations in their further application, such as their poor performance in identifying hapten antigens [3], which also makes it challenging to penetrate tissues or solid tumors [4]. The induced anti-drug antibodies against therapeutic mAbs hindered the efficacy of clinical treatment. Moreover, the slow metabolism of labeled mAbs generated severe background signals in immunoimaging [4]. In order to solve the problems above, partial mAb, like the antigen-binding fragment (Fab, 55 kDa) and single-chain variable fragment (scFv, ~25 kDa), are recombinantly produced. However, the affinity of those non-natural and incomplete mAb fragments is lower than the complete antibody. Furthermore, the cost of production is also higher than conventional antibodies because of the unstable molecular structure [5,6].
In 1993, the Hamers-Casterman team found the heavy-chain-only antibodies (HCAbs) in camelid animals (camelids and alpacas) which lack the light-chain and the heavy-chain constant region 1. The variable domain of the heavy-chain-only antibody (VHH) is recombinantly expressed as the single-domain antibody or Nanobody [7]. VHH is small (15 kDa) and has a long CDR3 that can recognize the structure of the antigen. Therefore, the VHH is often conformation-dependent when isolated from the antibody library [8]. Nevertheless, VHH has other advantages against a conventional antibody, as it is more resistant to proteolytic enzymes, chemical denaturants, extreme pH, and temperature changes due to its natural molecular composition [9]. Many hydrophilic amino acids and intramolecular disulfide bonds in VHH also provide excellent solubility and thermostability [9,10,11]. Other HCAbs also found in cartilaginous fishes are called immunoglobulin new antigen receptors (IgNARs) [12]. Although the molecular weight of the variable domain of new antigen receptors (VNAR) is only 12 kDa, its CDR3 is longer than VHH, and the molecule has advantageous features similar to VHH [13,14,15,16].
Various techniques for screening mAbs were also applied to isolate antigen-specific single-domain antibodies. The phage display, ribosome display, and yeast surface display were used to build the VNAR antibody library [17,18,19]. Before the screening, constructing an immune antibody library or non-immune antibody libraries, such as a naïve antibody library or synthetic antibody library, is necessary. High-affinity VNAR can be extracted from the immune antibody library, which is generated from immunization against the infectious agent as the shark’s in vivo immune mechanisms mature the antibody repertoire to yield high-affinity antibodies. But the cost of rearing animals and immunization is far greater than constructing the VHH immune antibody library [20]. Although the VNAR affinity is moderate when isolated from non-immune antibody libraries, it has still shown a broad spectrum of specificity against antigens [21,22,23]. The moderate-to-low affinity can be improved by increasing the library diversity [24] and in vitro affinity maturation, such as the target-site mutation or saturation mutation of CDR1 [25,26,27]. Another aspect of improving the affinity is to increase the diversity of the non-immune antibody library. The naïve antibody libraries are antibody libraries constructed from B cells of nonimmunized sharks. The VNAR gene sequence is isolated from a large portion of white blood cells and then cloned into display platforms for screening, requiring a large quantity of animal tissues and potentially causing some ethical issues. In contrast, the starting material for building a semi-synthetic VNAR antibody library only needs the unrearranged IgNAR-genes from B cells or the VNAR antibody gene scaffold. And at least one hypervariable loop of VNAR was genetically randomized to build the diversity of a semi-synthetic library. For example, Nuttall et al. used the striped shark VNAR as the gene scaffold and randomized the CDR3 region by saturation mutation to construct the first semi-synthetic phage VNAR library. They have successfully sorted out the VNARs against AMA-1, Tom70, or Gingipain K protease and proved that these recombinantly expressed VNARs can bind with its antigen [18,27,28,29]. In addition to the CDR3 region, the VNAR contains another three hypervariable loops, designated as CDR1, hypervariable loop 2 (HV2), and hypervariable loop 4 (HV4), respectively. The HV2 region of the VNAR gene can also be randomized to generate a new antigen-binding site for screening bispecific VNAR antibodies. Zielonka et al. employed the anti-epithelial cell adhesion molecule (EpCAM) VNAR gene as the scaffold and mutated its HV2 region to construct a semi-synthetic yeast VNAR library. Thereafter, the bispecific VNARs against EpCAM and with a cluster of differentiation of 3ε (CD3ε) or human Fcγ were screened and isolated [30].
During the screening process to identify high-affinity binders from the yeast VNAR library, a peptide tag must be fused to VNARs to aid the analysis of the display level of the VNAR library on the surface of the yeast cell. Further, in cases where no direct fluorophore-labeled antibodies against the peptide tags are available, a tag-specific primary antibody and a fluorophore-conjugated secondary antibody might be needed for fluorescence-activated cell sorting (FACS). The complexity of the analysis and possible batch-to-batch differences of antibodies may pose reproducibility challenges to the screening process. Therefore, an improved yeast surface display platform for screening nanobody immune libraries is designed to overcome these hurdles [31]. The nanobody library fused to the N-terminus end of Aga2p and an orthogonal acyl carrier protein (ACP) linked to the C-terminus end of Aga2p. After Sfp synthase attaches fluorophore-labeled CoA derivatives to the ACP tag, the display level of the Nanobody on the yeast cell can be monitored by fluorometry. Although this Nanobody-Aga2p-ACP fusion avoided the possible steric hindrance by a peptide tag and can be easily stained in a one-step reaction, specific reagents and extra steps are still needed in the staining process. A more straightforward strategy is employed in this study, where the GFP protein replaces the ACP tag and leads to the skipping of staining [32]. Additionally, to speed up the VNAR discovery, a work flow was taken advantage of using the animal-free semi-synthetic yeast VNAR library and the efficient selection of antigen-specific VNAR by sequential magnetic activated cell sorting (MACS) and FACS. Eventually, a comprehensive survey of the candidate binders was done by next-generation sequencing. To prove this strategy, we screened VNARs against a feline neonatal Fc receptor (fFcRn) or feline infectious peritonitis virus (FIPV) nucleocapsid protein and verified that the selected VNARs expressed on yeast could specifically bind to the antigen.

2. Materials and Methods

2.1. Strains, Plasmids, Media, and Antibodies

Saccharomyces cerevisiae yeast display strain EBY100 (ATCC MYA-4941) was cultured at 30 °C with shaking in yeast extract peptone–dextrose (YPD) medium. The yeast cells harboring surface display vector were cultivated in synthetic dextrose casamino acids (SD-CAA) medium (14.7 g/L sodium citrate dihydrate, 4.29 g/L citric acid monohydrate, 20 g/L D(+)-glucose, 6.7 g/L yeast nitrogen base without amino acids, 5 g/L Bacto™ (ThermoFisher Scientific, Waltham, MA, USA) casamino acids, 1% penicillin-streptomycin antibiotics, 100 μg/mL ampicillin, and 50 μg/mL kanamycin). The yeast cells were grown at 20 °C in synthetic galactose casamino acids (SG-CAA) medium (7.44 g/L sodium phosphate monobasic, 5.4 g/L sodium phosphate dibasic, 20 g/L D-galactose, 2 g/L D(+)-glucose, 6.7 g/L yeast nitrogen base without amino acids, 5 g/L Bacto™ casamino acids, 1% penicillin-streptomycin antibiotics, 100 μg/mL ampicillin, and 50 μg/mL kanamycin) during induction for surface display. The Escherichia coli strain DH5α was used for cloning and propagation of plasmid DNA. The pHEL5A7-GFP plasmid was constructed based on the sequence of the pNACP plasmid [32]. There was a modified pNACP vector in which the acyl carrier protein (ACP) was replaced with the green fluorescent protein (GFP) [32,33]. The HEL-5A7 [34] or other antigen-specific VNAR sequence was cloned into the N-terminus of Aga2p with Hind III and Bam HI sites in the modified pNACP cloning vector. The surface-displayed VNAR fusion protein was detected by cell-based enzyme-linked immunosorbent assay (ELISA), using Myc (human c-myc proto-oncogene) epitope tag mouse monoclonal antibody (Proteintech, Rosemont, IL, USA, catalog: 66004-1-Ig) and HRP-conjugated goat anti-mouse IgG (H + L) (Proteintech, catalog: SA00001-1). The detection of yeast clones binding to lysozyme (Sigma-Aldrich, St. Louis, MO, USA, catalog: L4919) was verified by cell-based ELISA, using rabbit polyclonal anti-lysozyme antibody (Abcam, Cambridge, UK, catalog: ab391) and HRP-conjugated goat anti-rabbit IgG (H + L) (Abcam, catalog: ab205718). When biotinylated lysozyme (Genetex, Irvine, CA, USA, catalog: GTX82960-pro) or antigen binds to yeast clones, phycoerythrin (PE)-conjugated streptavidin (Genetex, catalog: GTX85910) or peridinin–chlorophyll-protein (PerCP)-conjugated streptavidin (Biolegend, San Diego, CA, USA, catalog: 405213) is used to detect the binding complex in the fluorescence-related analysis. Allophycocyanin (APC)-conjugated streptavidin (Biolegend, catalog: 405207), biotinylated fFcRn (ACROBiosystems, Newark, DE, USA, catalog: FCN-F82W3), FIPV vaccine (Felocell® FIP, Zoetis, San Diego, CA, USA), and biotinylated mouse anti-feline coronavirus nucleocapsid mAb (Bio-Rad, Hercules, CA, USA, catalog: MCA2594B) were also employed in the MACS and FACS analysis.

2.2. Construction of Semi-Synthetic VNAR Library

The method of constructing a semi-synthetic VNAR library was modified based on the research of Shao et al. [35]. Using HEL-5A7 gene as PCR template, sets of NNK saturation-mutated DNA cassettes were introduced into the CDR3 loop by splice-overlap polymerase chain reaction (PCR). The first round of PCR used For-1st as forward primer, with Rev12-X3CX2CX5, Rev13-X6CX1CX4, Rev16-X6CX3CX5, Rev18-X6CX4CX6, Rev20-X5CX5CX8, or Rev23-X6CX5CX10 as the reverse primer to create six various CDR3 loop lengths (12, 13, 16, 18, or 20 and 23 amino acids) with 10, 11, 14, 16, or 18 and 21 randomized residues. The primer sequences used in this study were listed in Table 1. Fifty microliters of the first PCR components are 11.5 μL H2O, 10 μL 5 × Q5 buffer, 10 μL 5 × Q5 enhancer, 4 μL 2.5 mM dNTP, 5 μL 1 mM forward primer, 5 μL 1 mM reverse primer, 4 μL 2.5 ng/μL HEL-5A7 DNA template, and 0.5 μL 2 U/μL Q5 DNA polymerase (New England Biolabs, Ipswich, MA, USA). The amplification was carried out with an initial denaturing step of 98 °C for 30 s, 35 cycles of 98 °C for 5 s, 60 °C for 15 s, and 72 °C for 15 s. The second PCR with the first PCR product as a template to create 40 bp flanks was compatible with the yeast display vector, pHEL5A7-GFP, allowing cloning by yeast homologous recombination [36]. Fifty microliters of the second PCR components are 11.5 μL H2O, 10 μL 5 × Q5 buffer, 10 μL 5 × Q5 enhancer, 4 μL 2.5 mM dNTP, 5 μL 1 mM forward primer (For-TU1mod-40fl), 5 μL 1 mM reverse primer (Rev-TU58mod-40fl), 4 μL 25 ng/μL purified first PCR product, and 0.5 μL 2 U/μL Q5 DNA polymerase (New England Biolabs). The amplification was carried out with an initial denaturing step of 98 °C for 30 s, 35 cycles of 98 °C for 5 s, 68 °C for 15 s, and 72 °C for 15 s. The primers used in PCR were synthesized by Sangon Biotech, Shanghai, China. The primer sequences are shown in Table 1, and the PCR products were purified with QIAquick PCR purification kit (Qiagen) before proceeding to the next step. The pHEL5A7-GFP plasmid was digested with Hind III and Bam HI restriction enzymes before transformation.
A yeast surface display library was generated by electroporation-mediated transformation of the second PCR product and the digested pHEL5A7-GFP vector into EBY100 yeast using the lithium acetate method [37]. The method of electroporation-mediated transformation was modified based on the protocol by Grzeschik et al. [38]. Each electroporation was performed using a MicroPulser electroporator (Bio-Rad), where 3 μg of PCR product and 1 μg of digested vector were added to 400 μL of electrocompetent EBY100 yeast. The electroporation was performed at 2.5 kV, 25 μF, and 200 Ω. After twelve electroporation rounds were finished, 10 mL of yeast recovery medium (1:1 mixed 1 M sorbitol and YPD medium) was added to each batch of electroporated yeast cells and incubated at 30 °C with shaking for 1 h. As the control, an electroporation reaction containing only the digested or undigested pHEL5A7-GFP vector was also performed. After incubation, the yeast cells in the recovery medium were recovered, and cells were resuspended in 1 L of SD-CAA medium. The yeast cells in SD-CAA medium were cultured at 30 °C with shaking for 36 h. Following cultivation, cells were cryopreserved and stored at −80 °C. Each cryopreservation tube contained about 1.1 × 10¹⁰ cells.

2.3. Validation of Yeast-Surface-Displayed VNAR-GFP Fusion Protein

EBY100 yeast harboring pHEL5A7-GFP plasmid was induced in SG-CAA medium for 24, 48, or 72 h. After harvesting and washing the cells, samples were evaluated using a fluorescent microscope (Olympus® BX40F-3, Olympus, Tokyo, Japan) under the FITC filter set and bright field. The quantification of GFP fluorescence was calculated by adding 1 × 10⁷ of induced yeast cells into a 96-well microwells plate (Corning, Corning, NY, USA, catalog: 3916), then measuring the GFP fluorescence intensity by a fluorescent ELISA reader (SpectraMax Gemini XPS/EM, Molecular Devices, San Jose, CA, USA). The GFP-positive population of induced yeast cells (~1 × 10⁴) was estimated by a BD FACS Aria II machine (BD Biosciences, Franklin Lakes, NJ, USA) and BD FACSDiva software ver. 8.0 (BD Biosciences).
Cell-based ELISA was used to confirm that the VNAR-GFP fusion protein is indeed expressed on the yeast surface. To this end, 2 × 10⁷ induced yeast cells were washed with PBS once and incubated at room temperature for 1 h with 100 µL of the respective Myc tag mouse monoclonal antibody, which was applied in a dilution range of 100- down to 5000-fold dilution series (1% BSA in PBS). After washing three times using PBS, 100 µL of a 1:800 dilution of HRP-conjugated goat anti-mouse IgG (H + L) in PBS with 1% BSA was applied and incubated at room temperature for 1 h. Subsequently, the cells were washed three times and incubated with 100 µL stabilized chromogen (Thermofisher, Waltham, MA, USA, catalog: SB01). The reaction was stopped by adding 100 µL of stop solution (Thermofisher, catalog: SS03100). The absorbance of cell-free supernatant was measured at 450 nm by BioTek Epoch ELISA reader (BioTek Instruments, Inc., Winooski, VT, USA).

2.4. Binding Assays for Yeast Clones against Lysozyme

In the cell-based ELISA assay, 2 × 10⁷ induced yeast cells were washed with PBS once and incubated at room temperature for 1 h with 100 µL of lysozyme (1% BSA in PBS). After washing three times using PBS, 100 µL of a 1:5000 dilution of rabbit polyclonal anti-lysozyme antibody in PBS with 1% BSA was applied and incubated at room temperature for 1 h. Following three PBS washing steps, 100 µL of a 1:20,000 dilution of HRP-conjugated goat anti-rabbit IgG (H + L) in PBS with 1% BSA was applied and incubated for 1 h at room temperature. Subsequently, the cells were washed three times and incubated with 100 µL stabilized chromogen (Thermofisher, catalog: SB01). The reaction was stopped by adding 100 µL of stop solution (Thermofisher, catalog: SS03100). The absorbance of cell-free supernatant was measured at 450 nm by BioTek Epoch ELISA reader (Bio-Tek Instruments, Inc., USA).
In the cell-based fluorescent assay, 2 × 10⁷ induced yeast cells were washed with PBS once and incubated at room temperature for 1 h with 100 µL of biotinylated lysozyme (1% BSA in PBS). After washing three times using PBS, 100 µL of a 1:100 dilution of PE-conjugated streptavidin in PBS with 1% BSA was applied and incubated at room temperature for 1 h. Subsequently, the cells were washed three times and resuspended with PBS. These cells were added into a 96-well microwells plate (Corning, catalog: 3916), then the GFP and PE fluorescence intensity were measured by a fluorescent ELISA reader (SpectraMax Gemini XPS/EM, Molecular Devices, San Jose, CA, USA). The PE to GFP ratio is calculated by dividing PE readings by GFP readings.
In the flow cytometry binding assay, 5 × 10⁷ induced yeast cells were washed with PBS once and incubated with biotinylated lysozyme (1% BSA in PBS) at room temperature for 1 h. After washing three times using PBS, 100 µL of a 1:100 dilution of PE-conjugated streptavidin in PBS with 1% BSA was applied and incubated at room temperature for 1 h. The cells were washed three times and resuspended with PBS for subsequent flow cytometry analysis by Moflo™ XDP high-performance cell sorter (Beckman Coulter, Brea, CA, USA). The data were analyzed using Summit software ver. 5.3 (Summit Software, Little Rock, AR, USA). At least 3.5 × 10⁵ yeast cells per sample were analyzed and grouped based on discrimination of GFP and PE fluorescence intensity, representing those yeast cells displaying VNAR on the surface and binding biotinylated lysozyme.

2.5. Screening Feline Neonatal Fc Receptor-Specific VNAR Displaying Yeast Clones by Sequential MACS and FACS

2.5.1. Magnetic-Activated Cell Sorting

The negative selection against magnetic beads was performed to selectively remove streptavidin and bead-specific clones. Briefly, 5 × 10⁹ induced semi-synthetic VNAR library cells were incubated with 4 × 10⁷ magnetic beads (Dynabeads™ Biotin Binder, Invitrogen, Waltham, MA, USA, catalog: 11047) at 4 °C for 2 h. After removing the magnetic beads by a DynaMag magnet (DynaMag™-Spin Magnet, Invitrogen, catalog: 12320D), new magnetic beads were added to start the next round of negative selection.
After three rounds of negative selection, one round of positive MACS selection against fFcRn was conducted before FACS. To prepare the fFcRn-labeled magnetic beads, 4 × 10⁷ magnetic beads were incubated at 4 °C for 2 h with 33 pM biotinylated fFcRn (ACROBiosystems, catalog: FCN-F82W3) in PBS with 1% BSA. Magnetic beads were collected by a DynaMag magnet and washed with PBS twice. Finally, the magnetic beads were resuspended in PBS of pH 6 with 1% BSA and stored at 4 °C. After the negative MACS selection, yeast-displayed VNAR library cells were incubated with 4 × 10⁷ fFcRn-labeled magnetic beads at 4 °C for 2 h (1% BSA in PBS of pH 6). The yeast bound magnetic beads were washed three times and resuspended with SD-CAA medium. The MACS-sorted yeasts were cultured at 30 °C with shaking in SD-CAA medium. The enriched MACS-sorted yeasts were induced in SG-CAA medium at 20 °C for 72 h. After induction, the cells were washed with PBS once and resuspended in PBS of pH 6 with 1% BSA and stored at 4 °C.

2.5.2. Fluorescence-Activated Cell Sorting

After a round of positive MACS selection, 5 × 10⁷ induced VNAR library cells were incubated at 4 °C for 1 h with or without 500 nM biotinylated fFcRn in PBS of pH 6. To monitor the enrichment of unwanted clones during sorting, cells not incubated with the antigen were used as the control group. These control cells were incubated with fluorescent-conjugated streptavidin but without the addition of the biotinylated antigen. The cells were washed with PBS once and incubated at 4 °C for 1 h with 100 μL of a 1:100 dilution of APC-conjugated streptavidin in PBS of pH 6. After the cells were washed with PBS once and resuspended in PBS of pH 6 with 1% BSA, a two-color flow sort was performed through a MoFlo XDP Flow Cytometry Sorter. The data were analyzed using Summit software ver. 5.3. The sorted cells were grown in SD-CAA medium and induced in SG-CAA medium before the next round of selection. The concentration of the biotinylated fFcRn used was 500 nM in each round of sorting. Control experiments in which the library yeasts were incubated with the APC-conjugated streptavidin alone were performed to evaluate the undesired enrichment of clones that bind to the fluorescent dye. Plasmids from an aliquot of post-sorted yeast cells were extracted utilizing the Zymoprep Yeast Plasmid Miniprep kit I (Zymoresearch, Irvine, CA, USA, catalog: D2001) for further identification of the clone’s sequence.

2.6. Screening Feline Infectious Peritonitis Virus Nucleocapsid-Binding VNAR Displaying Yeast Clones by Sequential MACS and FACS

2.6.1. Magnetic-Activated Cell Sorting

The negative selection against magnetic beads was performed to selectively remove mouse mAb, streptavidin and bead-specific clones. Firstly, 4 × 10⁷ magnetic beads were incubated at 4 °C for 2 h with 6 μL of biotinylated mouse anti-feline coronavirus monoclonal antibody (Bio-Rad, catalog: MCA2594B) in 1 mL PBS with 1% BSA. Magnetic beads were collected by a DynaMag magnet and washed with PBS twice. The magnetic beads were resuspended in 5 × 10⁹ induced semi-synthetic VNAR library cells and incubated at 4 °C for 2 h. After removing the magnetic beads with a DynaMag magnet, new mouse anti-feline coronavirus mAb-labeled magnetic beads were added to start the next round of negative selection.
After three rounds of negative selection, one round of positive MACS selection against FIPV nucleocapsid was conducted before FACS. To prepare the FIPV nucleocapsid-labeled magnetic beads, 4 × 10⁷ mouse anti-feline coronavirus mAb-labeled magnetic beads were incubated at 4 °C for 2 h with 1/10 of the reconstituted FIPV vaccine (Felocell® FIP, Zoetis) in PBS with 1% BSA. Magnetic beads were collected by a DynaMag magnet and washed with PBS twice. Finally, the magnetic beads were resuspended in PBS with 1% BSA and stored at 4 °C.
After the negative MACS selection, the yeast-displayed VNAR library cells were incubated with 4 × 10⁷ FIPV nucleocapsid-labeled magnetic beads at 4 °C for 2 h (1% BSA in PBS). The yeast-bound magnetic beads were washed three times and resuspended with SD-CAA medium. The MACS-sorted yeasts were cultured at 30 °C with shaking in SD-CAA medium. The enriched MACS-sorted yeasts were induced in SG-CAA medium at 20 °C for 72 h. After induction, the cells were washed with PBS once and resuspended in PBS with 1% BSA and stored at 4 °C.

2.6.2. Fluorescence-Activated Cell Sorting

After a round of positive MACS selection, 5 × 10⁷ induced VNAR antibody library cells were incubated at 4 °C for 1 h with 1/3 of the reconstituted FIPV vaccine in PBS with 1% BSA. The cells were washed with PBS once and incubated at 4 °C for 1 h with 100 μL of a 1:100 dilution of biotinylated mouse anti-feline coronavirus mAb in PBS with 1% BSA. After, the cells were washed and 100 μL of a 1:100 dilution of APC-conjugated streptavidin in PBS with 1% BSA was added and incubated at 4 °C for 1 h. Finally, the cells were washed with PBS once and resuspended in PBS with 1% BSA. A two-color flow sort was performed through a MoFlo XDP Flow Cytometry Sorter. The data were analyzed using Summit software ver. 5.3. The sorted cells were grown in SD-CAA medium and induced in SG-CAA medium before the next round of selection. The ratio of the reconstituted FIPV vaccine used was 1/3 in each round of sorting. Control experiments in which the library yeasts were incubated with the biotinylated mouse anti-feline coronavirus mAb alone were performed to evaluate the undesired enrichment of clones that bind to the mAb. Plasmids from an aliquot of post-sorted yeast cells were extracted using the Zymoprep Yeast Plasmid Miniprep kit I to identify the clone’s sequence.

2.7. Binding Assay for FACS-Sorted Yeast Clones against Antigen

The cell-based fluorescent assay was employed to verify the binding of fFcRn-specific yeast clones to fFcRn and the binding of FIPV nucleocapsid-specific yeast clones to FIPV nucleocapsid. VNAR sequences from post-sorted sequences analysis were picked and subcloned into the modified pNACP vector via Hind III and Bam HI sites. These constructed plasmids were transformed into EBY100 yeast. VNAR-displaying yeast clones were inoculated and induced for the binding assay.
For the analysis of fFcRn-specific yeast clones, 2 × 10⁷ induced VNAR-displaying yeast cells were washed with PBS once and incubated at 4 °C for 1 h with 250 nM biotinylated fFcRn or biotinylated lysozyme in PBS of pH 6 with 1% BSA. The cells were washed with PBS once and incubated at 4 °C for 1 h with 100 μL of a 1:100 dilution of PerCP-conjugated streptavidin in PBS of pH 6. Subsequently, the cells were washed three times and resuspended with PBS. These cells were added into a 96-well microwells plate, then the GFP and PerCP fluorescence intensity were measured by a SpectraMax Gemini XPS/EM reader. The PerCP to GFP ratio is calculated by dividing PerCP readings by GFP readings.
For the analysis of FIPV nucleocapsid-specific yeast clones, 2 × 10⁷ induced VNAR-displaying yeast cells were washed with PBS once and incubated at 4 °C for 1 h with 1/10 of the reconstituted FIPV vaccine or 250 nM biotinylated lysozyme in PBS with 1% BSA. The cells were washed with PBS once and incubated at 4 °C for 1 h with 100 μL of a 1:100 dilution of biotinylated mouse anti-feline coronavirus monoclonal antibody in PBS with 1% BSA. After, the cells were washed and 100 μL of a 1:100 dilution of PerCP-conjugated streptavidin in PBS with 1% BSA was added and incubated at 4 °C for 1 h. Subsequently, the cells were washed three times and resuspended with PBS. These cells were added into a 96-well microwells plate, then the GFP and PerCP fluorescence intensity were measured by a SpectraMax Gemini XPS/EM reader. The PerCP to GFP ratio is calculated by dividing PerCP readings by GFP readings.

2.8. The Calculation of Normalization and Fold Enrichment after FACS Sorting

The fraction of all GFP-positive cells and GFP+APC+ cells can be obtained in each round of FACS screening. The ratio of observed double-positive cells was normalized to all GFP-expressing cells. The normalization is calculated using the following equation:
GFP + APC normalized + = number   of   GFP + APC +   cells number   of   GFP +   cells
The FACS enrichment factor is calculated from the normalized frequency of GFP+APC+ cells after the FACS sort divided by the normalized frequency of the pre-sorted cells using the following equation:
Fold   enrichment = ( GFP + APC normalized + ) Treatment ( GFP + APC normalized + ) Control

2.9. Next-Generation Sequencing

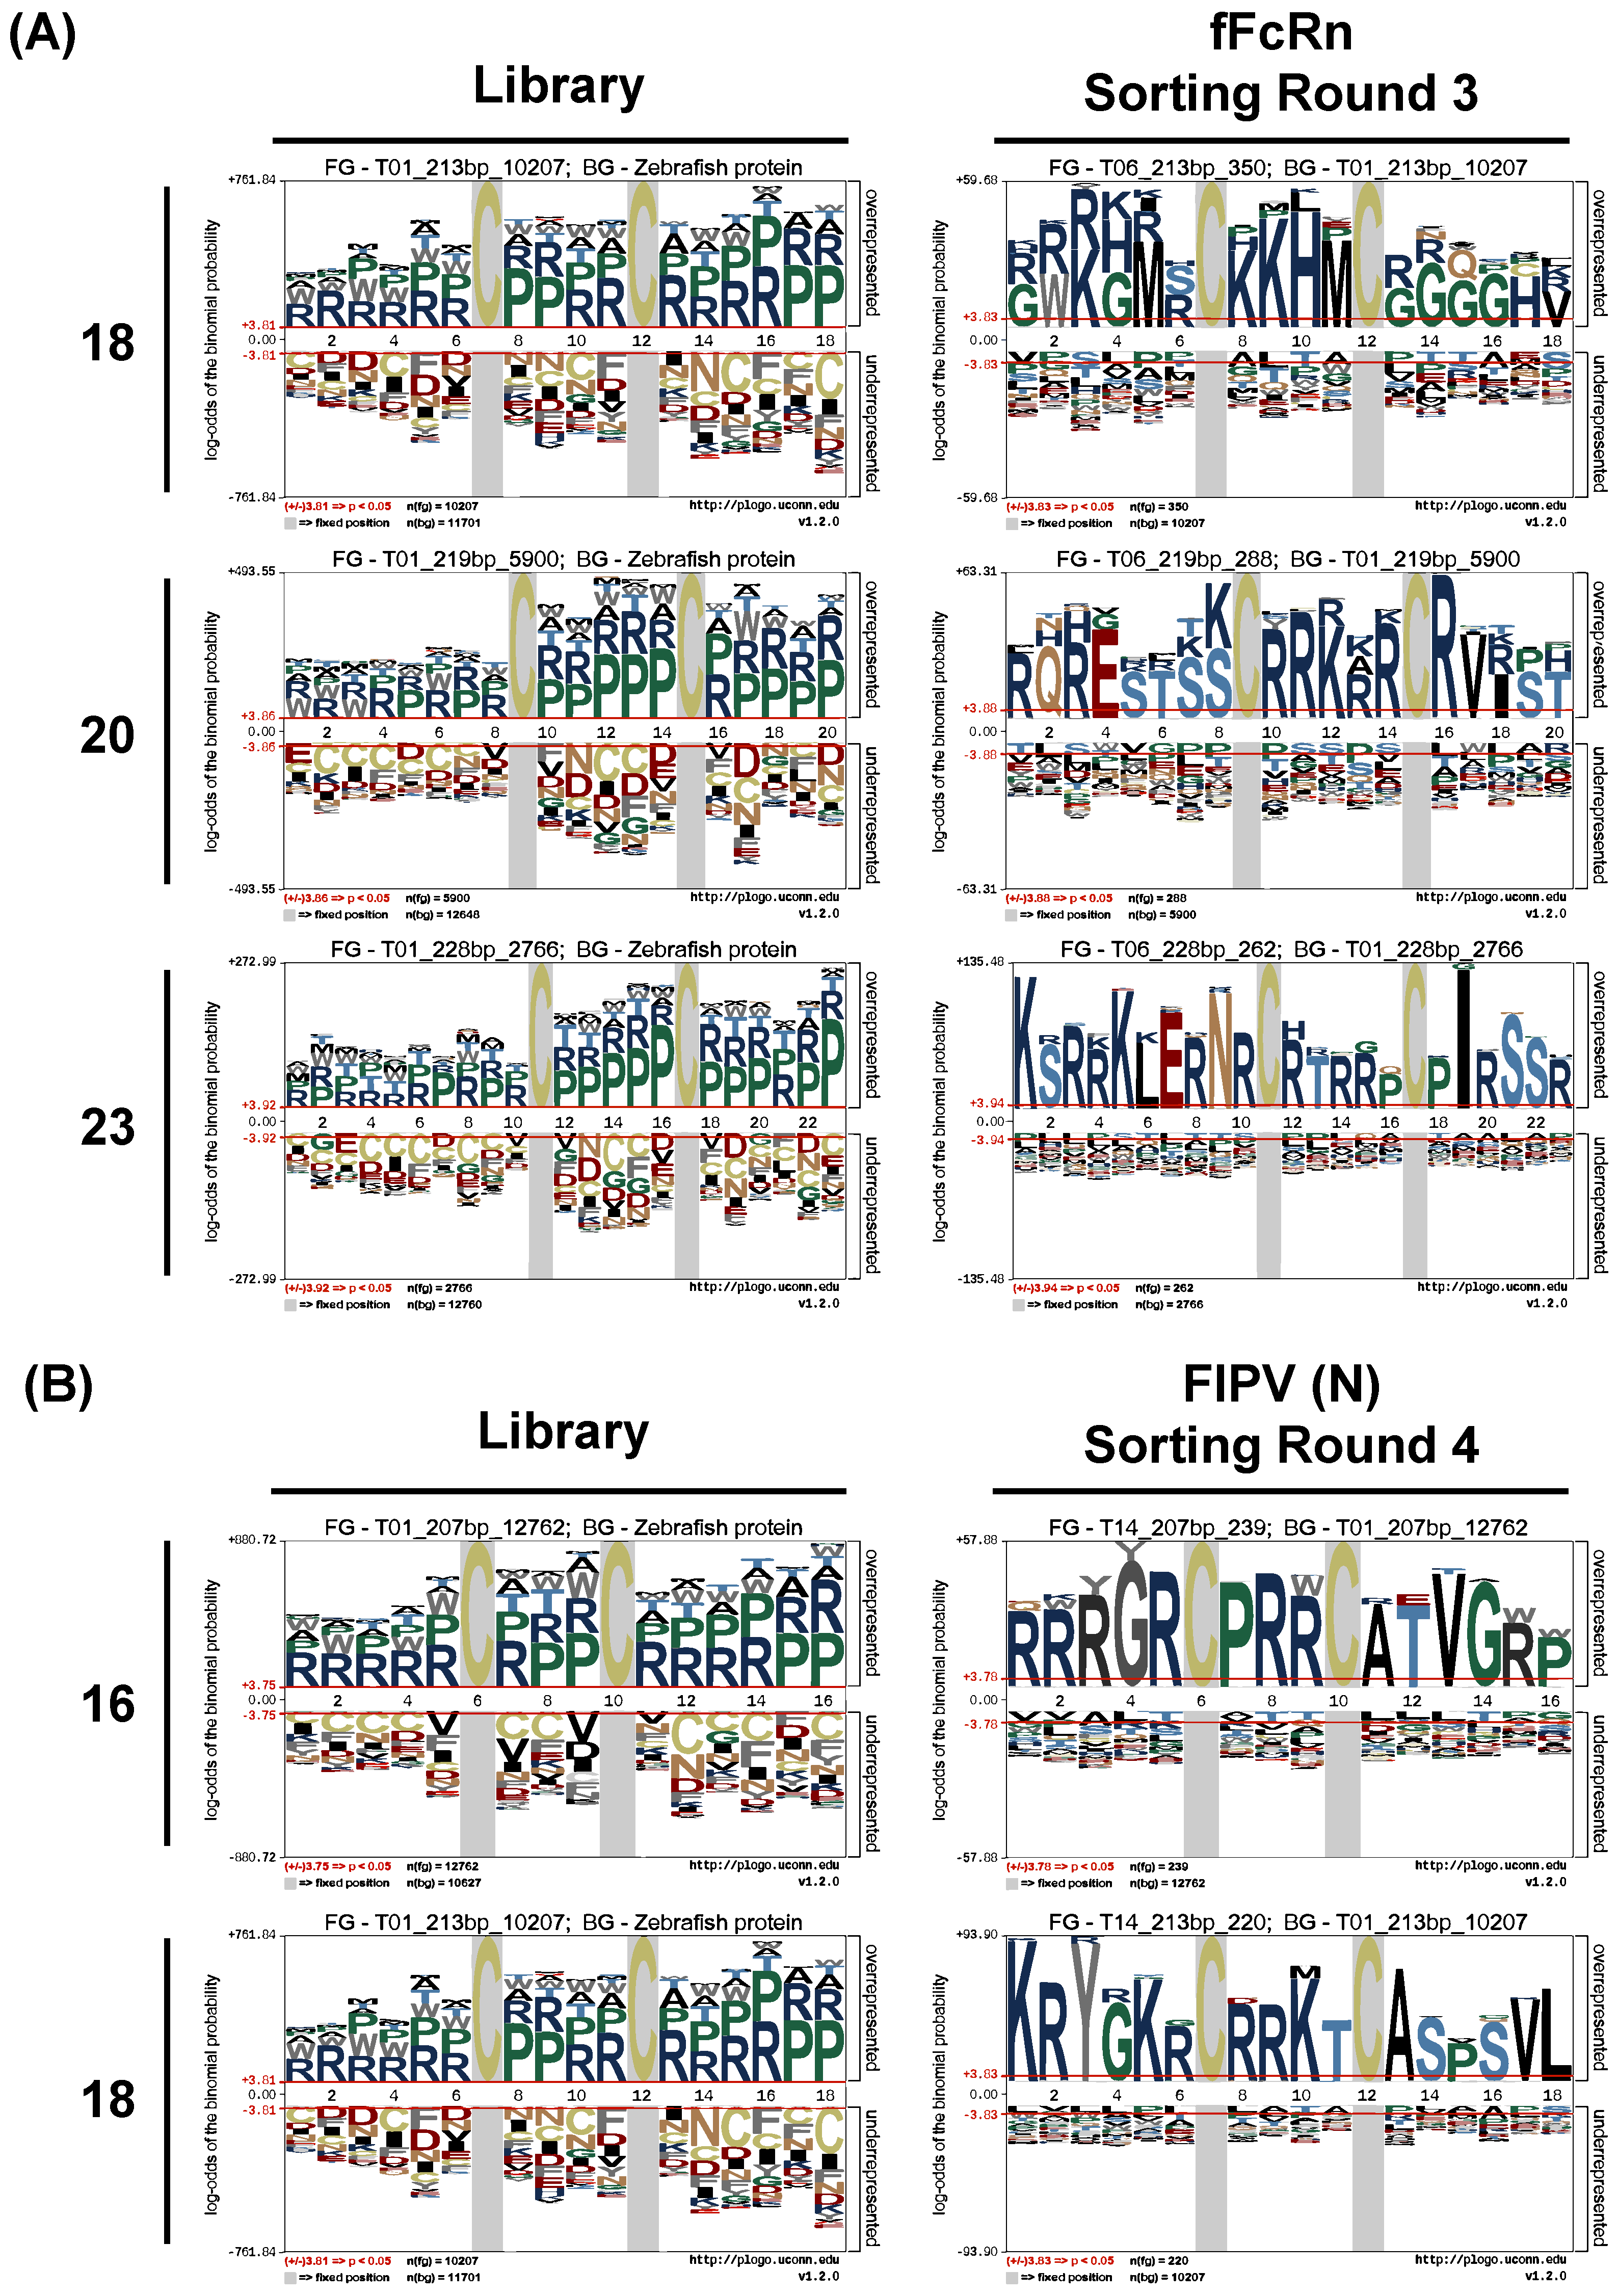
Next-generation sequencing was performed on the input library and every round of sorted samples using the Illumina MiSeq platform on VNAR CDR3 region amplified from the yeast plasmids. Plasmids from an aliquot of pre- and post-sorted yeast cells were used as the PCR template, using primers NGS-F (5′-GAAACGAGGAGAGCATATCG-3′) and NGS-F (5′-ATCCATTCACAGTCACGG-3′) to amplify the gene fragment containing VNAR CDR3. PCR reactions to add short universal adaptor sequences on the 5′ and 3′ ends and add barcoded adaptor sequences were accomplished by Topgen Biotechnology (Kaohsiung City, Taiwan). Amplicons were sequenced on an Illumina MiSeq system using 2 × 250-bp paired-end reads. Acquired NGS data were also processed by Topgen Biotechnology. Briefly, Trim Galore! (v0.4.3.1) was used to check the quality of the original data and remove the barcode sequence, and then the paired-end sequences were merged into a single sequence by Fastq-join (v1.1.2-806). FastQC (v0.72) and MultiQC (v1.8) were employed to ensure that the PHRED scores are greater than 30 and that the sequence length and type must be within the preset gene mutation scaffold. The amplification factor was calculated from the frequency of a sequence before FACS sorting divided by the frequency of the sequence after sorting. The amino acid frequency was calculated using Microsoft Excel scripts. The identification of consensus amino acid sequence before and after FACS sorting was based on the statistical significance of the individual residues in contrast to a background frequency, and was calculated and visually presented by the pLogo [39].

2.10. Statistical Analysis

Student’s t-test and one-way analysis of variance (ANOVA) was used to analyze the data. When ANOVA identified differences among the groups, Duncan’s multiple range test was conducted to examine significant differences among the treatments in SAS software 9.4 (SAS Institute, Cary, NC, USA). The level of significance was p < 0.05.

3. Results

3.1. The Dual Display of VNAR and GFP on the Surface of Yeast

We utilized an altered yeast α-agglutinin display expression system to express the semi-synthetic yeast VNAR library on the surface of yeast. The display of fusion proteins mainly includes a VNAR followed by Aga2p, GFP, and Myc tag. To validate this expression system, we cloned a well-characterized lysozyme-binding VNAR (HEL-5A7) into a modified pNACP cloning vector (pNACP-GFP). When constructing pHEL5A7-GFP plasmids, the secretion signal peptide and HEL-5A7 VNAR gene were connected to the N-terminus of Aga2p via a GS (Glycine-Serine) linker, while the GFP and Myc tags were connected to the C-terminus of Aga2p to form the fusion protein gene (Figure 1A). A time-course experiment was performed to investigate the appropriate induction period after the pHEL5A7-GFP plasmid was transformed into EBY100 yeast cells. Figure 1B shows that after 24, 48, or 72 h of induction, the yeast can emit green fluorescence under a fluorescent microscope, indicating that the GFP protein at the C-terminus of the Aga2p fusion protein is expressed after being induced for at least 24 h. The GFP fluorescence intensity after induction was quantified by a fluorescent ELISA reader. Figure 1C shows that the GFP fluorescence from the unit of yeast cells increased with the prolonged induction time. The examination of GFP-positive cells by flow cytometry showed that after 72 h of induction, 54.2% of the yeast was GFP-positive cells (Figure 1D). These results indicated that the fusion protein is expressed in EBY100 yeast, but not certainly on the yeast surface.
To verify whether the fusion protein is expressed on the surface of yeast, the anti-Myc antibody was used to detect the Myc tag at the C-terminus of the fusion protein in a cell-based ELISA. Since the conventional antibody is too large to enter the cells, if the anti-Myc antibody can detect the Myc tag at the C-terminus of the fusion protein, the target protein must be located on the surface of the yeast. The results of the cell-based ELISA, presented in Figure 1E, show that the induced yeast harboring pHEL5A7-GFP plasmid yielded a significant OD450 signal after being treated with different levels of the anti-Myc antibody. In contrast, the yeast-harboring pNACP-GFP plasmid had no obvious signal and it was revealed that after the plasmid pHEL5A7-GFP was transformed and induced for 72 h, the GFP of the fusion protein was correctly folded and transferred to the surface of the yeast.
Next, we thought to demonstrate that VNAR fused to Aga2p and GFP could bind its antigen. The specific binding of the yeast surface’s displayed HEL-5A7 fusion protein to lysozyme was verified by conducting a cell-based ELISA, a cell-based fluorescent assay, and a flow cytometry binding assay. Lysozyme or biotinylated lysozyme was co-incubated with the induced yeast, and the anti-lysozyme antibody or PE-conjugated streptavidin was used to detect the lysozyme bound to HEL-5A7. Figure 2A shows the results of the cell-based ELISA where lysozyme was detected by the anti-lysozyme antibody. As the lysozyme concentration increased, the OD450nm of the yeast-harboring pHEL5A7-GFP also increased significantly, while the signal in the negative control group had no increment. In the experiment of biotinylated lysozyme detected by PE-conjugated streptavidin, the GFP signal was normalized to reveal the actual binding ratio of the GFP-expressing yeasts. As shown in Figure 2B, the resulting PE/GFP ratio increased with the biotinylated lysozyme concentration. The signal yielded by the lysozyme-binding yeast can prove that VNAR at the N-terminus end of Aga2p is correctly expressed and functional. Another cell-based fluorescent assay was conducted and investigated by flow cytometry. It was found that after the yeast bound with the biotinylated lysozyme, the proportion of GFP+PE cells decreased from 70.03% to 39.33%, and the proportion of GFP+PE+ cells increased from 0.01% to 21.09% (Figure 2C). The results of the lysozyme binding assays demonstrated that the HEL-5A7 VNAR expressed by yeast could bind with its ligand and be located on the surface of yeast, as expected.

3.2. Generation of VNAR CDR3-Targeted Mutagenesis Library

The design of a randomized CDR3 loop of a VNAR antibody library is adapted from the work of Shao et al. [35], with the change of the phage display system to a yeast surface display system. Six CDR3 sizes (12, 13, 16, 18, or 20 and 23 amino acids) of the HEL-5A7 VNAR protein sequence were randomized by a splice-overlap polymerase chain reaction, while two atypical cysteines remained unchanged. The library DNA cassettes were mixed with linearized pNACP-GFP and electroporated into EBY100 yeast cells to generate a semi-synthetic VNAR antibody library by in vivo homologous recombination.
The library was induced and subjected to three rounds of negative selection against streptavidin-coated magnetic beads, resulting in a yield of 6.4 × 10⁹ transformants. To calculate the diversity of the library, we extracted plasmids from yeast cells and performed next-generation sequencing (NGS). The NGS results are exhibited in Table 2. After trimming and merging the original sequence, 249,437 sequences were used for subsequent analysis. There were 10,092 (4%) scaffold gene (HEL-5A7) sequences, and 118,791 sequences (47.6%) were in line with the expected six lengths of the CDR3 open reading frame. Overall, 76,780 sequences (30.08%) were unique. Within the unique sequences, the percentage of the VNAR sequences with 12, 13, 16, 18, 20, or 23 residues of CDR3 were 36.5, 22.2, 16.7, 13.3, 7.7, or 3.6%, respectively (Figure 3). It seems that the frequency of the individual set of unique sequences is CDR3 length-dependent. The proportion of unique sequences can be used to deduce that the diversity of the semi-synthetic VNAR antibody library is 1.97 × 10⁹.
To ensure the NNK site-saturation mutagenesis was successfully covering all kinds of amino acids in the mutation sites, the analysis of the amino acid composition in the library was performed. As in Figure 4, the amino acid percentage on each loop length of the randomized CDR3 sequence in the library is shown in a heatmap. The amino acids distribution is similar between different lengths of randomized CDR3 sequences. The most abundant amino acids are arginine (12.20%), proline (11.90%), serine (8.80%), alanine (8.70%), threonine (8.60%), and leucine (8.00%), while others are ranged from 1.4% to 6.1%.

3.3. Selection of VNAR-Displaying Yeasts against Antigens

After establishing the surface display of a GFP-tagged VNAR fusion protein on yeast, we tested this system for selecting a VNAR from the semi-synthetic library by MACS followed by FACS. Two different antigens were chosen, from a purified protein to a non-purified antigen: the feline neonatal Fc receptor (fFcRn), designated purified protein, and the nucleocapsid protein of the feline infectious peritonitis virus (FIPV) from a commercial vaccine representing the non-purified antigen. FcRn is located on antigen-presenting cells and neutrophils and can bind to immunoglobulin IgG and serum albumin. Its primary function is to reduce the degradation and recycling of the IgG protein, thereby prolonging the half-life of IgG. Thus, FcRn can extend the half-life of biologics, and its antagonist is expected to treat autoimmune diseases [40]. Thus, the isolating of fFcRn-binding VNAR could be helpful to antibody therapy in feline species.
To identify fFcRn-binding VNAR, the biotinylated feline FcRn (fFcRn) was conjugated with streptavidin-coated magnetic microbeads and then incubated with the yeast library. After magnetic cell sorting, yeast cells were grown, induced, and incubated with the biotinylated fFcRn. Furthermore, the desired clones were labeled with APC-conjugated streptavidin and isolated by FACS. Each yeast cell was examined and sorted for its VNAR display level (GFP fluorescence) and antigen binding level (APC fluorescence). Yeast cells scoring above a gating threshold in both fluorescence channels were collected, grown, and induced as the sample for the following selection round. In three subsequent selection rounds, it was found that the frequencies of GFP-positive cells increased between rounds (Table 3), indicating that VNAR-expressing yeasts were specifically enriched. The frequency of GFP+APC+ cells in the control group decreased to about 1/10 after first round of panning (Table 3, from 0.00124 to 0.00012), suggesting that MACS-sorted false-positive clones are mostly excluded after FACS sorting. Moreover, the increased frequency of GFP+APC+ cells in the control group after the second round of panning (Table 3, from 0.00012 to 0.00047) indicated the undesired enrichment of VNARs that bind to the fluorescent-conjugated streptavidin. To evaluate the enrichment of targeted sorting between FACS rounds, the normalization procedure by calculating the ratio of the GFP+APC+ cells in all VNAR-expressing cells was completed before the fold enrichment analysis. Table 3 shows the results of the enrichment fold analysis, which compares the ratio change of the target population before and after biopanning. It shows that the enrichment folds of the first, second, and third round of screening are 3.88, 3.37, and 5.86, respectively. The final round showed a more significant increase, indicating that FACS effectively enriches the fFcRn-specific yeast. To find the whole spectrum of VNARs that possibly recognize fFcRn epitopes, we analyzed the protein sequences and their frequencies from the sorted clones before and after FACS biopanning. The NGS data of fFcRn-binding VNARs were summarized in Table 4. After three rounds of FACS screening, the unique fFcRn-specific VNAR protein sequences decreased from 7327 to 1962, and their frequencies in the library were calculated for further analysis. The amplification factor of individual sequences could be a helpful parameter to narrow down the possible candidates of antigen-specific binders [41]. The amplification factor can be defined as the frequency of a VNAR protein sequence in the library after biopanning divided by its frequency before biopanning. As shown in Table 4, the number of sequences with the increased frequency (amplification factor > 1) decreased from 5000 in the first round to 558 in the last round. When the stringency of selection was increased by 10-fold (amplification factor > 10), the number of sequences decreased from 2853 in the first round to 48 in the final round. The composition of the post-sorting fractions within the three rounds of sorting also changed due to antigen-binding selection. While the sequences are distributed according to the CDR3 length in the library, the distribution is shifted towards certain kinds of abundant sequences after rounds of sorting. As shown in Figure 3, the distribution shift of VNAR sequences with 18, 20, or 23 residues of CDR3 results in 1.6-, 2.2-, and 4.3-fold increases, respectively, over their frequency in the library after three rounds of sorting for fFcRn. On the contrary, the VNAR sequences with 12 or 13 CDR3 residues show a decreased frequency, with a 0.5- and 0.4-fold reduction, respectively. Meanwhile, there is a slight increase in the frequency of VNAR sequences with 16 residues of CDR3 after the sorting process.
To determine whether specific CDR3 sequences are associated with target-binding after FACS sorting, we used pLogo (Probability Logo Generator) to identify and visualize statistically significant motifs within sorted sequences. The pLogo analysis was applied to every mutation site in CDR3 and the calculation was based on the individual residues in context to the library as the background frequency. Logos generated with pLogo are shown for the library and for the sorted fractions of fFcRn biopanning round 3 (Figure 5A). The pLogo result of the library shows that the two most highly abundant amino acids, which are arginine and proline, frequently occurred at each position in the randomized CDR3 sequence (Supplementary Figure S1). The most common CDR3 motifs are represented by the sequence GWKGMRCKKHMCGGGGHV, RQRESTSSCRRKRRCRVIST, and KSRRKLERNRCRTRRPCPIRSSR in the 18-, 20-, or 23-mer CDR3 region, respectively (Figure 5A).
Another target for isolating antigen-specific VNAR in this study is the FIPV nucleocapsid. FIPV is the pathogen of feline infectious peritonitis (FIP). After feline coronavirus infects cats, it mutates to FIPV and causes a fatal hyper-inflammatory response [42]. Although there is a commercial live feline infectious peritonitis virus vaccine (FELOCELL® FIP) from Zoetis, its preventive effect is controversial [43]. The success of mAb treatment in COVID-19 sheds some light on saving cats from FIP, but only a few studies on feline mAb treatment against viral diseases worked [44,45]. The nucleocapsid of the FIPV has been developed as a subunit vaccine and showed a positive result in a vaccination/challenge experiment [46]. Therefore, identifying FIPV nucleocapsid-specific binders may be valuable for developing FIPV diagnostic kits and vaccines.
To identify FIPV nucleocapsid-binding VNARs, one round of MACS followed by four rounds of FACS were performed essentially as described above. First, the feline coronavirus nucleocapsid mAb conjugated magnetic beads were incubated with the reconstituted FIPV vaccine mixture to capture FIPV nucleocapsid. After the FIPV nucleocapsid was presented by magnetic beads, the VNAR library was added to initiate MACS screening. Bound yeast cells are isolated by magnet-based separation and subjected to four rounds of FACS selection. The MACS-sorted yeasts were grown, induced, and incubated with the reconstituted FIPV vaccine mixture, then labeled with the biotinylated feline coronavirus nucleocapsid mAb. Finally, the bound yeasts were detected by APC-conjugated streptavidin and isolated by FACS. After four selection rounds, the yeast cells with a high display density and high capacity to bind the FIPV nucleocapsid were enriched for the NGS assay. The enrichment fold and amplification factor were calculated as described above. Table 3 shows that the enrichment folds of the first, second, third, and fourth round of screening are 1.38, 2.07, 6.44, and 8.80, respectively. The enrichment fold change between FIPV nucleocapsid sorting rounds reveals a noticeable increasing tendency compared to the result of fFcRn FACS sorting (from 1.38 to 8.80 versus 2.88 to 5.86). The frequency of GFP+APC+ cells in the control group changed from 0.00242 to 0.00042, then 0.00008, and rebound to 0.00016 after the third panning. The NGS data revealed that the number of unique FIPV nucleocapsid-binding VNARs decreased from 2649 to 981 after sorting. Among them, 288 sequences had an increased amplification factor, and 26 sequences had an amplification factor of 10 at least (Table 4). As shown in Figure 3, the distribution shifts of the VNAR sequences with 16, 18, 20, or 23 residues of CDR3 result in 1.6-, 1.9-, 1.3-, and 2.2-fold increases, respectively, over their frequency in the library after four rounds of sorting for FIPV nucleocapsids. On the contrary, the VNAR sequences with 12 or 13 CDR3 residues show a decreased frequency, with a 0.5- and 0.4-fold reduction, respectively.
The pLogo analysis was also applied to identify significant motifs in the sorted FIPV nucleocapsid-associated VNAR sequence. The results of the pLogo analysis are shown for the comparison of the library and four rounds of FIPV nucleocapsid-specific FACS sorting (Supplementary Figure S2). The fractions of biopanning round 4 significantly indicate the emergence of the consensus sequence RRRGRCPRRCATVGWP and KRYGKRCRRKTCA-SPSVL in the 16- and 18-mer CDR3 regions, respectively (Figure 5B).

3.4. Validation of Selective Binding to Target Antigen by the Isolated VNAR-Displaying Yeast

The antigen-specific VNAR-displaying yeasts, selected from the biopanning that presented the high frequency and amplification factor from the NGS data, were subjected to a cell-based fluorescent assay to test their binding to the antigen.
The V6 (KSRRKLERNRCRTRRPCPIRSSR) and V5 (RQRESTSSCRRKRRCRVRST) VNAR sequences from the final round of fFcRn FACS sorting were cloned, grown, and induced for a cell-based fluorescent assay. The frequency and amplification factor of V6 are 33.31% and 37.79, while the frequency and amplification factor of V5 are 14.68% and 23.99. The VNAR-expressing yeasts were incubated with biotinylated fFcRn or biotinylated lysozyme, and the antigen-binder complexes were detected by PerCP-conjugated streptavidin. The result of the cell-based fluorescent assay reveals that the PerCP/GFP ratio of the V6 and V5 groups was higher than the negative control groups (Figure 6A), demonstrating that the picked V6- and V5-expressing yeast can specifically bind to fFcRn. A similar result was found when two VNAR sequences from the final round of FIPV nucleocapsid FACS sorting, namely V3 (KRYGKRCRRKTCASPSVL) and V2 (RRRGRCPRRCATVGRP), were subjected to validate their binding to antigens. The frequency and amplification factor of V3 are 48.98% and 12.42, while the frequency and amplification factor of V2 are 38.79% and 8.51. As shown in Figure 6B, V3 and V2 VNAR-expressing yeast can generate the elevated ratio of PerCP/GFP, and the negative control groups were unresponsive to antigens.

4. Discussion

We developed a rapid and improved platform for screening affinity VNARs by MACS and FACS, followed by next-generation sequencing analysis. By the property of GFP, our system allows us to monitor the VNAR display level on each yeast clone. We validated this platform by selecting affinity VNARs against purified and non-purified proteins. The entire process does not involve animal immunization, which is the crucial step of antibody isolation. Generally, the immunization process for preparing immune antibody libraries takes 2 to 4 months. Milligrams of highly purified antigens are required for immunization [8], and it is necessary to consider whether the antigen is immunogenic or toxic to animals. The in vitro antibody discovery process can strictly control the screening environment, such as screening antibodies under different pH environments [47] or screening for antibodies that can bind to different conformations of antigens without re-immunization. The yeast clones evaluated by NGS analysis can avoid losing potential VNAR candidates. The frequency and amplification factor analysis based on NGS data can also help exclude many non-target clones in the last screening stage to accurately select the functional VNAR sequence. The pLogo analysis can be used to extract consensus antigen-binding CDR3 motifs which may be helpful to design the in vitro affinity maturation experiment.
The yeast agglutinin display expression system can be divided into α-agglutinin and a-agglutinin display expression systems. The C-terminus of the anchoring protein in an α-agglutinin display expression system is used for connecting to the yeast surface [48]. Therefore, only the N-terminus of the anchoring protein is available for expressing the heterologous protein. In contrast, the anchoring protein Aga2p of the a-agglutinin display expression system uses disulfide bonds to connect with the yeast surface, so the N-terminus and C-terminus of Aga2p are unrestricted to express heterologous proteins [49]. Thus, a dual display of proteins on the yeast cell surface was established to quantify binding reactions or enzymatic bioconjugation reactions between both ends of Aga2p [49]. In this study, the GFP protein was expressed at the C-terminus of Aga2p, and the VNAR antibody library was placed at the N-terminus, since the orientation of protein expression in a eukaryotic cell is from the N-terminus to the C-terminus. If the GFP protein is functionally expressed, the VNAR antibody is also well expressed. Moreover, the cell-based ELISA results prove that this study’s co-expressed GFP and VNAR are functional. Generally, before the FACS sorting of yeast, it is necessary to fluorescently specify the surface-expressed protein and the antigen bound to it. In this dual display system, an anchored VNAR fusion protein can emit GFP fluorescence spontaneously and then label the bound antigen for screening. After that, the dual fluorescence can be detected by a fluorescent ELISA reader or analyzed and sorted by a flow cytometer.
The VNAR antibody library established in this study retains two conserved cysteines and four atypical cysteines in the HEL-5A7 gene scaffold. Other than the variation of the cysteine number, the two-cysteine CXnC motifs in the CDR3 region are discovered in the variable domain of the antibody heavy chain by NGS analysis [50]. This mega research can be a start point to design a new antibody with long CDR3 or cross-reactive activity. Some studies of synthetic antibody libraries choose to remove cysteines to reduce the formation of disulfide bonds because it will limit the choice of subsequent antibody expression systems [38,51]. The study of Li et al. mutated the non-canonical cysteines of CDR1 and CDR3, because they want to improve the likeness to the variable domain of human heavy chains [52]. However, disulfide bonds can form tighter protein structures, increasing protein stability and assisting the finger-like structure formed by CDR3 in recognizing antigenic epitopes deep in protein clefts [53]. Another study also shows that the number of cysteines in the synthetic VNAR antibody library does not affect the screening efficiency, which means that the high-affinity binders can be screened and produced [54].
The diversity of the antibody library is the key to screening high-affinity binders. To yield nM affinity binders, the library capacity must be higher than 109 [55]. But the diversity of a typical yeast-derived library does not exceed 107, becoming the bottleneck of the isolating high-affinity binder. In this study, the method of maximizing the diversity of the VNAR library is based on Shao et al.’s research on the semi-synthetic VNAR phage display library, which contains greater than 1 × 10⁸ unique phage clones [35]. An entirely random NNK trinucleotide combination was used to create different lengths of site mutations in the CDR3 region by PCR, and the theoretical diversity can be as high as 1014~1027 in this study. Although the theoretical diversity is high, many factors will affect the actual diversity. For example, the efficient transformation of foreign DNA into yeast could be a limitation. The library bias created by the NNK mutagenesis also affects the expected diversity with the distorted amino acid frequency. The NNK codon covers 32 codons that include all amino acids, but with redundancy for 8 amino acids (Arg, Ser, Leu, Pro, Ala, Thr, Gly, and Val). The most abundant amino acids observed in our library mostly fit the expected frequency based on the NNK codon which means that the frequency bias does exist in our study (Figure 4). The frequency bias also has impact on the pLogo analysis. The two most frequent amino acids, arginine and proline, occupied almost all the positions of randomized CDR3 before sorting (Figure 4). This phenomenon may hinder the finding of the high-affinity binder because the translation-based bias might force the antigen binds to the less suitable clone. Each NNK mutation site also has a chance of mutating into a stop codon (3%), undesired cysteine (3%), or hydrophobic residues (27%), which may cause the low efficiency of the VNAR display. Therefore, the longer the CDR3 is, the higher the chance of a difficult translation. In our study, for the CDR3 with lengths of 12, 13, 16, 18, 20, or 23 residues, the proportion of complete VNAR sequences decreased with the CDR3 length, suggesting that another translational bias happened in our library. Nevertheless, the actual diversity in this study could still maintain a level of more than 109 after checking the library quality by the NGS assay. Even though the library’s capacity is larger than usual, the bio-panning efficiency is low when the input library overreaches the FACS workload [56]. Hence, we employed the strategy of sequential MACS and FACS to process a large quantity of library yeast. At first, the MACS filtered out possible binders from the whole library regardless of the low sorting purity. Next, these MACS-sorted clones, which contained true-positive or false-positive clones, were purified by FACS. Our data show that after the final round of fFcRn FACS sorting, the frequency of GFP+APC+ cells in the control group increased. A similar result was found in the isolation of FIPV nucleocapsid-specific VNARs, showing that the enrichment of off-target clones is designed to happen in the end. To avoid this phenomenon, a more rigid negative selection during MACS or changing fluorescent dye between rounds of panning could be the solution. However, it means more delays and costs in the development process. We thought to speculate that if the NGS assay can be applied to compare the sorted sequences in every round of the control group, the unwanted sequences can be excluded from sorted candidates easily without needing more work and changing reagents.
Biopanning is a standard process for screening affinity clones from the phage antibody library. In each round of screening, the bound phage must be stripped from the antigen-coated ELISA plate. Many strongly bound phages cannot be detached from the antigen and disappear in the next round of screening. In addition, after multiple rounds of biopanning, the screened clones can be dominated by phages with moderate affinity or rapid replication. Usually, 104~6 phages were panned out, but only 100~1000 phages will be hand-selected for sequencing, and the opportunity to find high-affinity clones is diminished [41]. Although biopanning by FACS does not lose the strong bound clones during sorting, the sorted populations may still be occupied by the fast-replication clones. In this study, all sorted yeasts were sequenced by NGS, so the influence of fast-replication clones could be reduced. The study of Deschaght et al. combined two analysis methods (sequence frequency > 10 and amplification factor > 10) to narrow the 2.7 × 10⁵ VHH phage clones down to 5173 clones. In total, 28 clones were selected for expression and validation for antigen binding, and 25 of 28 clones were high-affinity binders. However, the affinity of VHH phage clones is not highly correlated with the sequence frequency and amplification factor [57]. Another method to remove fast-propagating sequences or biased sequences is the bioinformatics processing tools such as the pLogo analysis to extract specific-binding sequences. In our platform, two antigens were screened for high-affinity binders, and the results of the NGS sequencing were grouped according to the sequence frequency and amplification factor analysis. Two of each most abundant and enriched antigen-specific CDR3 sequences are selected for further validation. Interestingly, these sequences are identical or highly consistent to the pLogo extracted motif (V6 sequence KSRRKLERNRC-RTRRPCPIRSSR versus 23-mer motif KSRRKLERNRCRTRRPCPIRSSR; V5 sequence RQRESTSSCRRKRRCRVRST versus 20-mer motif RQRESTSSCRRKRRCRVIST; V3 sequence KRYGKRCRRKTCASPSVL versus 18-mer motif KRYGKRCRRKTCASPSVL; and V2 sequence RRRGRCPRRCATVGRP versus 16-mer motif RRRGRCPRRCATVGWP). The frequent occurrence of arginine and proline in the CDR3 motif may be due to the influence of frequency bias. But arginine and proline can be served as protecting osmolytes to stabilize protein folding and increase protein solubility, inhibiting protein aggregation [58]. Thus, the retained arginine and proline in the consensus CDR3 motif might be the result of a secondery selection pressure other than the target-binding. The VNAR protein structure with medium affinity may be robust compared to the high-affinity one and then stably presented on the yeast surface during biopanning. Although it seems that the result of biopanning is affected by the translation-based bias, the cell-based fluorescent assay results verified that the selected VNAR-displaying clones are able to bind to their ligand. In the end, their affinity needs to be determined after being solely expressed to verify the readiness of the grouping strategy. Such VNAR-displaying yeasts may also represent a kind of powerful point-of-care diagnostic tool for replacing current immunomagnetic beads due to the high-density, organized and robust VNAR presented on the yeast surface. We will look forward to developing a rapid FIPV detection kit in the future.

5. Conclusions

In summary, the established synthetic library and selection schemes facilitate the selection of diverse and applicable VNAR binders. Compared to the traditional antibody discovery platform, which needs shark rearing, immunization, and phage biopanning, the hands-on time and cost are reduced, and the overall experimental complexity can also be simplified. We believe this platform will allow the rapid and in vitro identification of usable tools for fundamental science and clinical applications.

Supplementary Materials

The following supporting information can be downloaded at: https://www.mdpi.com/article/10.3390/app132011520/s1, Figure S1: Sequence logos of the randomly mutated CDR3 motif before and after 3 rounds of biopanning against the fFcRn. The sequence plot was generated with the pLogo-tool using the unique sequences from different lengths of mutated CDR3 region and comparing them to correspond fractions of the pre-sort library. The horizontal red line indicates the threshold of the Bonferroni corrected p-value of p < 0.05; Figure S2: Sequence logos of the randomly mutated CDR3 motif before and after 4 rounds of biopanning against the FIPV nucleocapsid protein. The sequence plot was generated with the pLogo-tool using the unique sequences from different lengths of mutated CDR3 region and comparing them to correspond fractions of the pre-sort library. The horizontal red line indicates the threshold of the Bonferroni corrected p-value of p < 0.05.

Author Contributions

C.-H.T., X.G. and T.-M.W. conceived the original idea. C.-H.T. and K.-T.W. performed the experiments, analyzed the data, and co-wrote the draft manuscript. X.G. advised and helped supervise the project. T.-M.W. supervised the project and co-wrote the manuscript. All authors have read and agreed to the published version of the manuscript.

Funding

This research was partially the Ministry of Science and Technology (MOST) (MOST 108-2637-B-020-004) of Taiwan to T.-M.W.

Institutional Review Board Statement

Not applicable.

Informed Consent Statement

Not applicable.

Data Availability Statement

The authors confirm that the data supporting the findings of this study are available within the article.

Acknowledgments

We thank Yuh Tzean for English editing. The authors are grateful to the Genomics and Proteomics Medical Laboratory, the Department of Medical Research, and Kaohsiung Medical University Chung-Ho Memorial Hospital for the technical assistance. This work is partially supported by the Ministry of Science and Technology (MOST) (MOST 108-2637-B-020-004) of Taiwan to T.-M.W.

Conflicts of Interest

Authors Chia-Hung Tsai and Xuan Guo were employed by the company Anilink Biotech Ltd. The remaining authors declare that the research was conducted in the absence of any commercial or financial relationships that could be construed as a potential conflict of interest.

References

  1. Köhler, G.; Milstein, C. Continuous cultures of fused cells secreting antibody of predefined specificity. Nature 1975, 256, 495–497. [Google Scholar] [CrossRef]
  2. Dougan, M.; Nirula, A.; Azizad, M.; Mocherla, B.; Gottlieb, R.L.; Chen, P.; Hebert, C.; Perry, R.; Boscia, J.; Heller, B. Bamlanivimab plus etesevimab in mild or moderate COVID-19. N. Engl. J. Med. 2021, 385, 1382–1392. [Google Scholar] [CrossRef] [PubMed]
  3. Wesolowski, J.; Alzogaray, V.; Reyelt, J.; Unger, M.; Juarez, K.; Urrutia, M.; Cauerhff, A.; Danquah, W.; Rissiek, B.; Scheuplein, F. Single domain antibodies: Promising experimental and therapeutic tools in infection and immunity. Med. Microbiol. Immunol. 2009, 198, 157–174. [Google Scholar] [CrossRef] [PubMed]
  4. Lipman, N.S.; Jackson, L.R.; Trudel, L.J.; Weis-Garcia, F. Monoclonal versus polyclonal antibodies: Distinguishing characteristics, applications, and information resources. ILAR J. 2005, 46, 258–268. [Google Scholar] [CrossRef] [PubMed]
  5. Nelson, A.L. Antibody fragments: Hope and hype. mAbs 2010, 2, 77–83. [Google Scholar] [CrossRef]
  6. Chames, P.; Van Regenmortel, M.; Weiss, E.; Baty, D. Therapeutic antibodies: Successes, limitations and hopes for the future. Br. J. Pharmacol. 2009, 157, 220–233. [Google Scholar] [CrossRef] [PubMed]
  7. Hamers-Casterman, C.; Atarhouch, T.; Muyldermans, S.; Robinson, G.; Hammers, C.; Songa, E.B.; Bendahman, N.; Hammers, R. Naturally occurring antibodies devoid of light chains. Nature 1993, 363, 446–448. [Google Scholar] [CrossRef]
  8. Pardon, E.; Laeremans, T.; Triest, S.; Rasmussen, S.G.F.; Wohlkönig, A.; Ruf, A.; Muyldermans, S.; Hol, W.G.J.; Kobilka, B.K.; Steyaert, J. A general protocol for the generation of nanobodies for structural biology. Nat. Protoc. 2014, 9, 674–693. [Google Scholar] [CrossRef]
  9. Hussack, G.; Hirama, T.; Ding, W.; MacKenzie, R.; Tanha, J. Engineered single-domain antibodies with high protease resistance and thermal stability. PLoS ONE 2011, 6, e28218. [Google Scholar] [CrossRef]
  10. Dumoulin, M.; Conrath, K.; VanMeirhaeghe, A.; Meersman, F.; Heremans, K.; Frenken, L.G.J.; Muyldermans, S.; Wyns, L.; Matagne, A. Single-domain antibody fragments with high conformational stability. Protein Sci. 2002, 11, 500–515. [Google Scholar] [CrossRef]
  11. Pérez, J.M.J.; Renisio, J.G.; Prompers, J.J.; van Platerink, C.J.; Cambillau, C.; Darbon, H.; Frenken, L.G.J. Thermal unfolding of a llama antibody fragment: A two-state reversible process. Biochemistry 2001, 40, 74–83. [Google Scholar] [CrossRef]
  12. Greenberg, A.S.; Avila, D.; Hughes, M.; Hughes, A.; McKinney, E.C.; Flajnik, M.F. A new antigen receptor gene family that undergoes rearrangement and extensive somatic diversification in sharks. Nature 1995, 374, 168–173. [Google Scholar] [CrossRef]
  13. English, H.; Hong, J.; Ho, M. Ancient species offers contemporary therapeutics: An update on shark VNAR single domain antibody sequences, phage libraries and potential clinical applications. Antib. Ther. 2020, 3, 1–9. [Google Scholar] [CrossRef]
  14. Griffiths, K.; Dolezal, O.; Parisi, K.; Angerosa, J.; Dogovski, C.; Barraclough, M.; Sanalla, A.; Casey, J.; González, I.; Perugini, M.; et al. Shark variable new antigen receptor (VNAR) single domain antibody fragments: Stability and diagnostic applications. Antibodies 2013, 2, 66–81. [Google Scholar] [CrossRef]
  15. Streltsov, V.A.; Carmichael, J.A.; Nuttall, S.D. Structure of a shark IgNAR antibody variable domain and modeling of an early-developmental isotype. Protein Sci. 2005, 14, 2901–2909. [Google Scholar] [CrossRef] [PubMed]
  16. Zielonka, S.; Empting, M.; Grzeschik, J.; Könning, D.; Barelle, C.J.; Kolmar, H. Structural insights and biomedical potential of IgNAR scaffolds from sharks. mAbs 2015, 7, 15–25. [Google Scholar] [CrossRef] [PubMed]
  17. Kopsidas, G.; Roberts, A.S.; Coia, G.; Streltsov, V.A.; Nuttall, S.D. In vitro improvement of a shark IgNAR antibody by Qβ replicase mutation and ribosome display mimics in vivo affinity maturation. Immunol. Lett. 2006, 107, 163–168. [Google Scholar] [CrossRef]
  18. Nuttall, S.D.; Krishnan, U.V.; Hattarki, M.; DeGori, R.; Irving, R.A.; Hudson, P.J. Isolation of the new antigen receptor from wobbegong sharks, and use as a scaffold for the display of protein loop libraries. Mol. Immunol. 2001, 38, 313–326. [Google Scholar] [CrossRef]
  19. Zielonka, S.; Weber, N.; Becker, S.; Doerner, A.; Christmann, A.; Christmann, C.; Uth, C.; Fritz, J.; Schäfer, E.; Steinmann, B.; et al. Shark attack: High affinity binding proteins derived from shark vNAR domains by stepwise in vitro affinity maturation. J. Biotechnol. 2014, 191, 236–245. [Google Scholar] [CrossRef] [PubMed]
  20. Crouch, K.; Smith, L.E.; Williams, R.; Cao, W.; Lee, M.; Jensen, A.; Dooley, H. Humoral immune response of the small-spotted catshark, Scyliorhinus canicula. Fish Shellfish Immunol. 2013, 34, 1158–1169. [Google Scholar] [CrossRef]
  21. Liu, J.L.; Anderson, G.P.; Delehanty, J.B.; Baumann, R.; Hayhurst, A.; Goldman, E.R. Selection of cholera toxin specific IgNAR single-domain antibodies from a naïve shark library. Mol. Immunol. 2007, 44, 1775–1783. [Google Scholar] [CrossRef] [PubMed]
  22. Buffington, J.; Duan, Z.; Kwon, H.J.; Hong, J.; Li, D.; Feng, M.; Xie, H.; Ho, M. Identification of nurse shark VNAR single-domain antibodies targeting the spike S2 subunit of SARS-CoV-2. FASEB J. 2023, 37, e22973. [Google Scholar] [CrossRef] [PubMed]
  23. Wrapp, D.; DeVlieger, D.; Corbett, K.; Torres, G.; Van Breedam, W.; Roose, K.; van Schie, L.; Hoffmann, M.; Pöhlmann, S.; Graham, B.; et al. Structural basis for potent neutralization of betacoronaviruses by single-domain camelid antibodies. Cell 2020, 181, 1004–1015. [Google Scholar] [CrossRef] [PubMed]
  24. Feng, M.; Bian, H.; Wu, X.; Fu, T.; Fu, Y.; Hong, J.; Fleming, B.D.; Flajnik, M.F.; Ho, M. Construction and next-generation sequencing analysis of a large phage-displayed VNARsingle-domain antibody library from six naïve nurse sharks. Antib. Ther. 2018, 1, 1–11. [Google Scholar] [CrossRef]
  25. Kumar, R. Simplified protocol for faster transformation of (a large number of) Pichia pastoris strains. Yeast 2019, 36, 399–410. [Google Scholar] [CrossRef]
  26. Fennell, B.J.; Darmanin-Sheehan, A.; Hufton, S.E.; Calabro, V.; Wu, L.; Müller, M.R.; Cao, W.; Gill, D.; Cunningham, O.; Finlay, W.J.J. Dissection of the IgNAR V domain: Molecular scanning and orthologue database mining define novel IgNAR hallmarks and affinity maturation mechanisms. J. Mol. Biol. 2010, 400, 155–170. [Google Scholar] [CrossRef]
  27. Nuttall, S.D.; Humberstone, K.S.; Krishnan, U.V.; Carmichael, J.A.; Doughty, L.; Hattarki, M.; Coley, A.M.; Casey, J.L.; Anders, R.F.; Foley, M. Selection and affinity maturation of IgNAR variable domains targeting Plasmodium falciparum AMA1. Proteins Struct. Funct. Bioinform. 2004, 55, 187–197. [Google Scholar] [CrossRef] [PubMed]
  28. Nuttall, S.D.; Krishnan, U.V.; Doughty, L.; Pearson, K.; Ryan, M.T.; Hoogenraad, N.J.; Hattarki, M.; Carmichael, J.A.; Irving, R.A.; Hudson, P.J. Isolation and characterization of an IgNAR variable domain specific for the human mitochondrial translocase receptor Tom70. Eur. J. Biochem. 2003, 270, 3543–3554. [Google Scholar] [CrossRef]
  29. Nuttall, S.D.; Krishnan, U.V.; Doughty, L.; Nathanielsz, A.; Ally, N.; Pike, R.N.; Hudson, P.J.; Kortt, A.A.; Irving, R.A. A naturally occurring NAR variable domain binds the Kgp protease from Porphyromonas gingivalis. FEBS Lett. 2002, 516, 80–86. [Google Scholar] [CrossRef]
  30. Zielonka, S.; Empting, M.; Könning, D.; Grzeschik, J.; Krah, S.; Becker, S.; Dickgießer, S.; Kolmar, H. The shark strikes twice: Hypervariable loop 2 of shark IgNAR antibody variable domains and its potential to function as an autonomous paratope. Mar. Biotechnol. 2015, 17, 386–392. [Google Scholar] [CrossRef]
  31. Huang, D.; Shusta, E.V. Secretion and surface display of green fluorescent protein using the yeast Saccharomyces cerevisiae. Biotechnol. Prog. 2005, 21, 349–357. [Google Scholar] [CrossRef]
  32. Uchański, T.; Zögg, T.; Yin, J.; Yuan, D.; Wohlkönig, A.; Fischer, B.; Rosenbaum, D.M.; Kobilka, B.K.; Pardon, E.; Steyaert, J. An improved yeast surface display platform for the screening of nanobody immune libraries. Sci. Rep. 2019, 9, 382. [Google Scholar] [CrossRef]
  33. Kaishima, M.; Ishii, J.; Matsuno, T.; Fukuda, N.; Kondo, A. Expression of varied GFPs in Saccharomyces cerevisiae: Codon optimization yields stronger than expected expression and fluorescence intensity. Sci. Rep. 2016, 6, 35932. [Google Scholar] [CrossRef] [PubMed]
  34. Dooley, H.; Flajnik, M.F.; Porter, A.J. Selection and characterization of naturally occurring single-domain (IgNAR) antibody fragments from immunized sharks by phage display. Mol. Immunol. 2003, 40, 25–33. [Google Scholar] [CrossRef]
  35. Shao, C.-Y.; Secombes, C.J.; Porter, A.J. Rapid isolation of IgNAR variable single-domain antibody fragments from a shark synthetic library. Mol. Immunol. 2007, 44, 656–665. [Google Scholar] [CrossRef]
  36. Orr-Weaver, T.L.; Szostak, J.W. Yeast recombination: The association between double-strand gap repair and crossing-over. Proc. Natl. Acad. Sci. USA 1983, 80, 4417–4421. [Google Scholar] [CrossRef] [PubMed]
  37. Wu, S.; Letchworth, G.J. High efficiency transformation by electroporation of Pichia pastoris pretreated with lithium acetate and dithiothreitol. Biotechniques 2004, 36, 152–154. [Google Scholar] [CrossRef] [PubMed]
  38. Grzeschik, J.; Könning, D.; Hinz, S.C.; Krah, S.; Schröter, C.; Empting, M.; Kolmar, H.; Zielonka, S. Generation of semi-synthetic shark IgNAR single-domain antibody libraries. In Phage Display: Methods and Protocols; Hust, M., Lim, T.S., Eds.; Springer: New York, NY, USA, 2018; pp. 147–167. ISBN 978-1-4939-7447-4. [Google Scholar]
  39. O’Shea, J.P.; Chou, M.F.; Quader, S.A.; Ryan, J.K.; Church, G.M.; Schwartz, D. pLogo: A probabilistic approach to visualizing sequence motifs. Nat. Methods 2013, 10, 1211–1212. [Google Scholar] [CrossRef] [PubMed]
  40. Roopenian, D.C.; Akilesh, S. FcRn: The neonatal Fc receptor comes of age. Nat. Rev. Immunol. 2007, 7, 715–725. [Google Scholar] [CrossRef]
  41. Miyazaki, N.; Kiyose, N.; Akazawa, Y.; Takashima, M.; Hagihara, Y.; Inoue, N.; Matsuda, T.; Ogawa, R.; Inoue, S.; Ito, Y. Isolation and characterization of antigen-specific alpaca (Lama pacos) VHH antibodies by biopanning followed by high-throughput sequencing. J. Biochem. 2015, 158, 205–215. [Google Scholar] [CrossRef]
  42. Tekes, G.; Thiel, H.J. Feline coronaviruses: Pathogenesis of feline infectious peritonitis. Adv. Virus Res. 2016, 96, 193–218. [Google Scholar] [PubMed]
  43. Tizard, I.R. Feline vaccines. Vaccines Vet. 2021, 167–178. [Google Scholar] [CrossRef]
  44. Doki, T.; Toda, M.; Hasegawa, N.; Hohdatsu, T.; Takano, T. Therapeutic effect of an anti-human-TNF-alpha antibody and itraconazole on feline infectious peritonitis. Arch. Virol. 2020, 165, 1197–1206. [Google Scholar] [CrossRef]
  45. Cubillos-Zapata, C.; Angulo, I.; Almanza, H.; Borrego, B.; Zamora-Ceballos, M.; Castón, J.R.; Mena, I.; Blanco, E.; Bárcena, J. Precise location of linear epitopes on the capsid surface of feline calicivirus recognized by neutralizing and non-neutralizing monoclonal antibodies. Vet. Res. 2020, 51, 59. [Google Scholar] [CrossRef] [PubMed]
  46. Hohdatsu, T.; Yamato, H.; Ohkawa, T.; Kaneko, M.; Motokawa, K.; Kusuhara, H.; Kaneshima, T.; Arai, S.; Koyama, H. Vaccine efficacy of a cell lysate with recombinant baculovirus-expressed feline infectious peritonitis (FIP) virus nucleocapsid protein against progression of FIP. Vet. Microbiol. 2003, 97, 31–44. [Google Scholar] [CrossRef]
  47. Könning, D.; Hinz, S.; Grzeschik, J.; Schröter, C.; Krah, S.; Zielonka, S.; Kolmar, H. Construction of histidine-enriched shark IgNAR variable domain antibody libraries for the isolation of pH-sensitive vNAR fragments. In Antibody Engineering: Methods and Protocols; Nevoltris, D., Chames, P., Eds.; Springer: New York, NY, USA, 2018; pp. 109–127. ISBN 978-1-4939-8648-4. [Google Scholar]
  48. Ueda, M.; Tanaka, A. Cell surface engineering of yeast: Construction of arming yeast with biocatalyst. J. Biosci. Bioeng. 2000, 90, 125–136. [Google Scholar] [CrossRef]
  49. Lim, S.; Glasgow, J.E.; Filsinger Interrante, M.; Storm, E.M.; Cochran, J.R. Dual display of proteins on the yeast cell surface simplifies quantification of binding interactions and enzymatic bioconjugation reactions. Biotechnol. J. 2017, 12, 1600696. [Google Scholar] [CrossRef]
  50. Prabakaran, P.; Chowdhury, P.S. Landscape of non-canonical cysteines in human VH repertoire revealed by immunogenetic analysis. Cell Rep. 2020, 31, 107831. [Google Scholar] [CrossRef] [PubMed]
  51. Koide, S.; Koide, A.; Lipovšek, D. Chapter six—Target-binding proteins based on the 10th human fibronectin type III domain (10Fn3). In Protein Engineering for Therapeutics, Part B; Wittrup, K.D., Verdine, G.L., Eds.; Academic Press: Cambridge, MA, USA, 2012; Volume 503, pp. 135–156. ISBN 0076-6879. [Google Scholar]
  52. Li, D.; English, H.; Hong, J.; Liang, T.; Merlino, G.; Day, C.-P.; Ho, M. A novel PD-L1-targeted shark VNAR single-domain-based CAR-T cell strategy for treating breast cancer and liver cancer. Mol. Ther. 2022, 24, 849–863. [Google Scholar] [CrossRef]
  53. Diaz, M.; Stanfield, R.L.; Greenberg, A.S.; Flajnik, M.F. Structural analysis, selection, and ontogeny of the shark new antigen receptor (IgNAR): Identification of a new locus preferentially expressed in early development. Immunogenetics 2002, 54, 501–512. [Google Scholar] [CrossRef]
  54. Cabanillas-Bernal, O.; Dueñas, S.; Ayala-Avila, M.; Rucavado, A.; Escalante, T.; Licea-Navarro, A.F. Synthetic libraries of shark vNAR domains with different cysteine numbers within the CDR3. PLoS ONE 2019, 14, e0213394. [Google Scholar] [CrossRef] [PubMed]
  55. Hentrich, C.; Ylera, F.; Frisch, C.; TenHaaf, A.; Knappik, A. Monoclonal antibody generation by phage display: History, state-of-the-art, and future. In Handbook of Immunoassay Technologies; Elsevier: Amsterdam, The Netherlands, 2018; pp. 47–80. [Google Scholar]
  56. Cheng, Z.; Zhou, X.; Gu, M.; Deng, J.; Dong, M.; Liu, M. High-throughput fluorescence-activated cell sorting based on a rigid microfluidic chip. SSRN 2023, preprint. [Google Scholar] [CrossRef]
  57. Deschaght, P.; Vintém, A.P.; Logghe, M.; Conde, M.; Felix, D.; Mensink, R.; Gonçalves, J.; Audiens, J.; Bruynooghe, Y.; Figueiredo, R.; et al. Large diversity of functional nanobodies from a camelid immune library revealed by an alternative analysis of next-generation sequencing data. Front. Immunol. 2017, 8, 420. [Google Scholar] [CrossRef] [PubMed]
  58. Gil, D.; Schrum, A.G. Strategies to stabilize compact folding and minimize aggregation of antibody-based fragments. Adv. Biosci. Biotechnol. 2013, 4, 73. [Google Scholar] [CrossRef] [PubMed]
Figure 1. Characterization of the VNAR-GFP expression platform. (A) Schematic representation of the pHEL5A7-GFP. (B) Images of yeast cells expressing HEL5A7-GFP fusion protein. Bright field images and fluorescence images were generated for the following samples: yeast induced for 24, 48, or 72 h. Hpi, hours post induction. Bar indicates 50 μm. (C) Whole-yeast GFP fluorescence measurement after 24, 48, or 72 h of induction. Values are averages of three biological replicates, and bars show standard error. The asterisk indicates significant difference (p < 0.05) between each group after induction (t-test). (D) Histogram of the flow cytometric analysis of pHEL5A7-GFP plasmid harboring yeasts (orange) after 72 h of induction, compared to yeast cells that do not display fusion (green). (E) Surface-displayed protein was detected with defined concentrations of Myc tag mouse monoclonal antibody via cell-based ELISA. Yeasts harboring the pNACP-GFP plasmid were the negative control group. Data are mean ± SE (n = 3). The asterisk indicates significant difference (p < 0.05) between each group (t-test) in the presence of different amounts of Myc antibody.
Applsci 13 11520 g001
Figure 2. Determination of surface-displayed HEL5A7 binding against lysozyme. (A) HEL5A7-displaying yeasts were incubated with various concentrations of lysozyme. The detection of bound yeast was employed by rabbit polyclonal anti-lysozyme antibody and HRP-conjugated goat anti-rabbit IgG via cell-based ELISA. Yeasts harboring the pNACP-GFP plasmid were the negative control group. Data are mean ± SE (n = 3). “ns” indicates not significant (p > 0.05), whereas the asterisk indicates significant difference (p < 0.05) between each group (t-test) in the presence of different amounts of lysozyme. (B) HEL5A7-displaying yeasts were incubated with various concentrations of biotinylated lysozyme. The bound yeast was detected by PE-conjugated streptavidin, and the fluorescence intensity of GFP and PE were measured by fluorescent plate reader. Data are mean ± SE (n = 3). Means with different letters among groups are significantly different (p < 0.05) by Duncan’s multiple range test. (C) The biotinylated lysozyme-bound yeasts were incubated with PE-conjugated streptavidin, and the percentage changes of GFP+PE and GFP+PE+ cells were analyzed by flow cytometry while at least 3.5 × 10⁵ yeast cells per sample were analyzed (n = 1). The HEL5A7-displaying yeasts without biotinylated lysozyme were the untreated control group.
Applsci 13 11520 g002
Figure 3. The distribution profile for different lengths of mutated CDR3 sequences before and after rounds of biopanning against the fFcRn or FIPV nucleocapsid protein. The frequencies of unique CDR3 sequences were obtained from the NGS data, then processed and portrayed as the stacked bar chart.
Applsci 13 11520 g003
Figure 4. The amino acid composition of the different lengths of mutated CDR3 sequences. Shown in heatmaps is the percentage of each amino acid on each length of the randomly mutated CDR3 sequence.
Applsci 13 11520 g004
Figure 5. Sequence logos of the randomly mutated CDR3 motif. The sequence plot was generated with the pLogo-tool using the unique sequences from different lengths of mutated CDR3 region and comparing them to corresponding fractions of the pre-sort library. The horizontal red line indicates the threshold of the Bonferroni corrected p-value of p < 0.05. Two invariant cysteines are depicted with a grey background. Only the mutation sites of the 18-, 20-, and 23-mer CDR3 region were fully extracted after 3 rounds of biopanning against the fFcRn (A) while the 16- and 18-mer CDR3 regions were fully extracted after 4 rounds of biopanning against the FIPV nucleocapsid protein (B).
Applsci 13 11520 g005
Figure 6. Validation of FACS-sorted VNAR-expressing yeast binding to its ligand. VNAR-expressing yeasts were incubated with biotinylated fFcRn, reconstituted FIPV vaccine, or biotinylated lysozyme. The fFcRn-bound yeast was detected by PerCP-conjugated streptavidin, and the FIPV nucleocapsid-bound yeast was detected by biotinylated mouse anti-feline coronavirus nucleocapsid mAb and PerCP-conjugated streptavidin. The fluorescence intensity of GFP and PerCP was measured by fluorescent plate reader. (A) The binding of fFcRn by V6 or V5 VNAR-expressing yeasts. (B) The binding of FIPV nucleocapsid by V3 or V2 VNAR-expressing yeasts. Data are mean ± SE (n = 3). Means with different letters among groups are significantly different (p < 0.05) by Duncan’s multiple range test.
Applsci 13 11520 g006
Table 1. Primers used in this study.
Primer NameSequence (5′ to 3′)Comments
For-1stGCTCGAGTGGACCAAACACCGDesigned in this study
Rev12-X3CX2CX5CGGCAGTGCCATCTCCGCAMNNMN-NMNNGCAMNNMNNACAMNNMNN-MNNMNNMNNGAGACCGCAACGAT-ACGTGCCACModified from Shao et al., 2007 [35]
Rev13-X6CX1CX4CGGCAGTGCCATCTCCGCAMNNMN-NMNNMNNMNNMNNGCAMNNACA-MNNMNNMNNMNNGAGACCGCAACGATACGTGCCAC
Rev16-X6CX3CX5CGGCAGTGCCATCTCCGCAMNNMN-NMNNMNNMNNMNNGCAMNNMNNMNNACAMNNMNNMNNMNNMNNG-AGACCGCAACGATACGTGCCAC
Rev18-X6CX4CX6CGGCAGTGCCATCTCCGCAMNNMN-NMNNMNNMNNMNNGCAMNNMN-NMNNMNNACAMNNMNNMNNMN-NMNNMNNGAGACCGCAACGATACGTGCCAC
Rev20-X5CX5CX8CGGCAGTGCCATCTCCGCAMNNMN-NMNNMNNMNNGCAMNNMNNMN-NMNNMNNACAMNNMNNMNNMN-NMNNMNNMNNMNNGAGACCGCA-ACGATACGTGCCAC
Rev23-X6CX5CX10CGGCAGTGCCATCTCCGCAMNNMN-NMNNMNNMNNMNNGCAMNNMN-NMNNMNNMNNACAMNNMNNMN-NMNNMNNMNNMNNMNNMNNMNNGAGACCGCAACGATACGTGCCAC
For-TU1mod-40flGCTAAAGAAGAAGGGGTACAATTA-GATAAAAGAGAGGCCGAAGCTGCT-CGAGTGGACCAAACACDesigned in this study
Rev-TU58mod-40flAGCCACCACCTCCTGATCCCCCTCC-ACCAGAGCCACCTCCGGATCCATTC-ACAGTCACGGCAGTGCCATCTCCDesigned in this study
Table 2. Summary of next-generation sequencing results for semi-synthetic VNAR library.
After Biopanning
Obtained clones6.4 × 109
Total number of read sequences375,629
Number of merged sequences249,437 (100%)
CDR3 coding sequences fits in-frame mutations118,791 (47.6%)
Unique sequences76,780 (30.8%)
Default scaffold (HEL-5A7)10,092 (4.0%)
Estimated library size1.97 × 109
Table 3. The enrichment fold of antigen-specific FACS sorting.
Sorting Round1st2nd
ControlTreatmentFold EnrichmentControlTreatmentFold Enrichment
fFcRnGFP+ (%)24.1923.752.8834.1531.583.37
GFP+APC+ (normalized)0.001240.004790.000120.00040
FIPV nucleocapsidGFP+ (%)37.1538.441.3839.1840.582.07
GFP+APC+ (normalized)0.002420.003330.000420.00086
Sorting Round3rd4th
ControlTreatmentFold EnrichmentControlTreatmentFold Enrichment
fFcRnGFP+ (%)47.7147.125.86ND 1ND 1ND 1
GFP+APC+ (normalized)0.000470.00276
FIPV
nucleocapsid
GFP+ (%)58.2557.346.4460.0460.748.80
GFP+APC+ (normalized)0.000080.000520.000160.00141
1 ND, not done.
Table 4. The amplification factor of antigen-specific VNARs identified after FACS sorting.
Unique SequencesAmplification Factor > 1
Sorting Round1st2nd3rd4th1st2nd3rd4th
fFcRn732725571962ND 15000619558ND 1
FIPV nucleocapsid264916901022981857572318288
Amplification Factor > 10
Sorting Round1st2nd3rd4th
fFcRn28537448ND 1
FIPV nucleocapsid4631594126
1 ND, not done.
Disclaimer/Publisher’s Note: The statements, opinions and data contained in all publications are solely those of the individual author(s) and contributor(s) and not of MDPI and/or the editor(s). MDPI and/or the editor(s) disclaim responsibility for any injury to people or property resulting from any ideas, methods, instructions or products referred to in the content.

