


Machine Learning Modeling of Vitality Characteristics in Historical Preservation Zones with Multi-Source Data

1
School of Architecture and Art, North China University of Technology, Beijing 100144, China
2
Centre for Design Innovation, Swinburne University of Technology, Hawthorn, VIC 3122, Australia
3
Ural Institution, North China University of Water Resources and Electric Power, Zhengzhou 450045, China
*
Author to whom correspondence should be addressed.
Buildings 2022, 12(11), 1978; https://doi.org/10.3390/buildings12111978
Submission received: 23 September 2022
/
Revised: 1 November 2022
/
Accepted: 5 November 2022
/
Published: 14 November 2022
(This article belongs to the Special Issue Advances in Computational Analytics for Urban Planning and Design: Methods, Technologies and Practices)
Abstract
:Research on historic preservation zones (HPZs) has recently attracted increasing attention from academia and industry. With eight Beijing typical HPZs selected, this study evaluates critical vitality characteristics and identifies the key influencing factors via multi-source data and machine learning technology. The vitality characteristics were identified from three dimensions: physical space vitality, cyberspace vitality, and sentiment degree. For influencing factors, 23 variables were constructed from four aspects (morphological, functional, visual, and traffic) using Computer Vision (CV), natural language processing (NLP) and Geographic Information System (GIS) techniques. Then, three vitality dimensions were introduced as responsive variables to establish three Random Forest Regression models. Lastly, each factor’s influence degree and direction on vitality were explained based on the feature importance and correlation analysis. Through this study, we have thoroughly examined the different influencing factors of vitality in HPZs and summarized the following academic findings: (1) Density of road intersections, the number of shops, and road impedance are the three of the most significant influencing factors that are negatively related to vitality. (2) Factors that have the highest impact on the sentiment degree are road impedance and the number of public infrastructures, which also negatively affect the population’s satisfaction. (3) The number of catering and entertainment amenities are critical factors that positively affect cyberspace’s vitality. In this study, all three models have adequately explained variables and generalization capability, which can be applied to other larger HPZs in Beijing. In addition, the findings of this study can also potentially provide insights for enhancing precinct vitality and the governance of HPZs in other cities.
1. Introduction
1.1. Background
Historical preservation zones (HPZs) are typical historical relics of the ancient city which consist of both tangible and intangible assets [1], with multi-scale continuous characteristics of morphology, texture, and style [2,3,4]. As an essential means to promote the sustainable development of historical blocks, revitalisation has always been considered as the essential approach for protecting and renewing HPZs [5], and vitality is the key to proxy the degree of such revitalisation. Recently, the concept of the dynamic protection [6] of historical blocks has been widely recognized in China [7,8]. Local governments have incorporated the construction of HPZs into the urban development plan, while the protection perspective of HPZs has also shifted from preserving the tangible building morphology to the intangible culture and vitality [9]. Moderate commercial development and block transformation are considered to be effective means for revitalisation and attracting tourists [10].
However, in general, there are still a considerable number of HPZs witnessing the coexistence of prosperity and declination, as well as uneven distribution of vitality [11]. This phenomenon is reflected in the following aspects: (1) the disorderly expansion of the city and the inexorable pressures of population growth may destroy the historical block morphologies, posing a severe threat to the HPZs [12,13,14]; (2) the inappropriate protective approaches may lead to problems such as function simplification, the ill-designed layout of infrastructure, and poor walkability, which undermines the overall attractiveness for pedestrians [6,15,16]; (3) serious problems such as excessive commercialisation and spatial homogeneity [5,13] may lead to the “sense of aesthetic visual fatigue” [17] and loss of original features and humanistic characteristics, resulting in less popularity among tourists; (4) in contrast, in some specific areas, an excessive influx of tourists exceeds the service carrying capacity [18], resulting in traffic congestion and environmental deterioration, and, in turn, negatively influencing the popularity of HPZs [19]. In general, many HPZs are now being challenged with the following question: “how do they deal with the unequal spread of activity intensity?” How to protect historical and cultural heritage while improving local vitality by addressing the abovementioned challenges is the key question to the survival of HPZs.
Today, promoting the protection and revitalisation of historical preservation zones (HPZs) has become a common concern for many communities [20,21]. Improving vitality and identifying critical influencing factors are essential for renovating HPZs. Therefore, we have proposed the following research questions: Today, what are the new representation forms and semantic connotations of vitality? What factors will affect the vitality of the HPZs? How do these factors influence vitality? It is essential to investigate the critical elements of the attractiveness in HPZs and propose an effective measurement to evaluate local vitality. A discussion of these questions helps us to understand the current vitality pattern and further contributes to the future reconstruction practice.
1.2. Literature Review
1.2.1. The Definition of Urban Vitality
The research on urban vitality has attracted extensive attention from scholars worldwide. The concept and definition of vitality have been extensively studied in the last fifty years [1,22,23]. For example, Jacobs posited that the interaction between human activities, especially pedestrian activities, constitutes the diversity of urban life, which is the primary reflection of urban vitality [24]; Gehl believed that the vitality of urban public space lies in the people and their activities [25]. According to Montgomery’s theory, urban vibrancy was conceptualized as “the extent to which a place feels alive or lively” [26]. Based on the theory of Jane Jacobs et al., Carlos Moreno proposed the concept of a “15-Minute City”, which envisions mixed-used built environments which foster and promote social interactions and relationships [27]. Guo et al. noted that the major determinant of urban space vitality has shifted to “spatial-social interaction” [28]. In general, the basic concept of vitality can be considered as the number of people and the diversity of activities.
1.2.2. The Measurement of Urban Vitality
Previous studies on the measurement of vitality have mostly been based on onsite observation, interviews, or captured video, which have been used to audit the number of pedestrians [29,30]. The drawbacks of these studies are that they focus on a single block or small areas of streets due to the prohibitively costly and labor-intensive methods of data collection [1].
Currently, the emerging multi-source data, such as mobile signaling data [31,32], social media check-in data [33,34], location-based service (LBS) data [35], Global Positioning System (GPS) data [36,37], night-time light data [38], and points of interest (POI) [39], provides previously unavailable information for studies exploring vitality [40]. In the era of big data, a vast amount of information, recording individual behaviors and trajectories, is collected by smart devices [41], including spatial and temporal information, emotional information, and semantic textual information, which makes it possible to conduct a detailed measurement of vitality and investigate the interaction between human activities and urban environments [42]. Based on this, in recent years, quantitative urban morphology and data studies have become more compelling techniques with which to assess urban vitality [22,39]. Wu and Ye used Baidu heat map data to discover the cyclical characteristics of the population center in Shanghai, and they devised a method for urban vitality research using real-time crowd flow distribution data from Baidu heat maps [43]. Liu identified potentially dynamic areas in cities using points of interest (POI) data and presented a method for defining urban central area boundaries based on functional mixture [44]. Based on urban big data and multiple modeling methodologies, Long suggested a method for urban refinement model construction to help policy establishment [45]. Yue et al. measured urban vitality in Shanghai using multivariate data and discovered clusters with high urban vitality [46].
1.2.3. The Influencing Factors and Mechanism of Urban Vitality
The built environment factors are strongly associated with urban vitality [29]. A city with higher urban vitality tends to attract more people and have higher development momentum; therefore, it is essential to determine which built environment factors influence urban vitality [47]. Investigating influence factors on vitality could provide a solid foundation for scientific urban planning.
Many studies have demonstrated that urban morphological elements have an influence on vitality [24,36,48,49]. Jiayu et al., used machine learning models such as ridge regression and a Light Gradient Boosting Machine (LightGBM) with multi-source data to explore whether urban morphological elements affect heritage vitality [9]. Mouratidis and Wouter found that neighborhood proximity to the city center is associated with increased urban vitality, while green space is associated with lower urban vitality [29]; Xin et al. used the floor area ratio (FAR), open space rate, road density, and intersection density to discuss the effect of the built environment on urban vitality [50].
Others regard land function as a primary impacting factor on urban vitality, highlighting that mixed land function can make the blocks more diverse, so as to attract more people and promote vitality [29]. For example, Huang et al. found that the change of employment subcenters significantly affects the spatial distribution of urban vibrancy [51]. Some scholars found that mixed land use provides urban residents with more opportunities and diverse experiences in daily life, work, and recreation, thereby cultivating urban vibrancy [31,36].
As for traffic features, accessibility plays a vital role in the interaction between urban residents and land functions [47]. In the application of Space Syntax, the influence of sports and crowd activities on space vitality is described [52]. The results of Song’s research showed that traffic accessibility to waterfront open space negatively affected vitality [53]. Studies by Moreno Carlos et al. found that different mobility options in a “15-Minute City” contribute to a sustainable and inclusive city so as to promote urban vitality [27,54,55].
In addition, visual elements are also explored. For example, Lemin et al. evaluated the space perception of the residents and assessed the street’s visual appeal as well as the appeal of its commercial activities [37]; Yingxiang et al. found that visual accessibility has a weak impact on waterfront space vitality [56]. Based on street view images, Liang et al. used deep learning methods and semantic segregation to demonstrate the importance of improving urban vitality [57].
1.2.4. Research Gap
We have identified the following five research gaps in the current literature: (1) most of the research topics focus on central city areas [22,32,58,59,60,61] or urban open spaces [30,56,62,63,64,65]; however, little research has been conducted on historical preservation zones (HPZs); (2) some studies lack a consideration of the difference between physical and cyberspace factors in the characterisation of vitality [9,32,36], which overlooks some intangible vitality forms; (3) many studies confuse the standard relationship between vitality proxy and influencing factors by incorrectly regarding the results calculated by a weighting index as vitality [38,61,66]; (4) for the mining of vitality influencing factors, to pursue better variable interpretation, the nonlinear relationship between variables and vitality is usually ignored [9,23,60], resulting in the bias of the built environment elements’ selection.
2. Materials
2.1. Study Area
Beijing, an ancient city with more than 700 years of history, is rich in historical and cultural heritage, having been subjected to a great contradiction between development and conservation [18]. Since 1990, the Beijing municipal government has successively designated historic preservation zones (HPZs). So far, there are 33 HPZs located in the old city, which are essential parts of the historic imperial city. Their functional nature has gradually evolved with the change of dynasties, from the royal court, the government offices, and factories providing logistics services to the residential blocks after the Qing dynasty. Currently, these zones are mainly for residence and tourism, showing the style and image of the ancient capital. This paper chose Shichahai, Dong Si, Xi Si, South Luogu Lane, Jingshan, Wenjin Street, Donghuamen Street, and Guozijian for the case study. These eight HPZs have their typical characteristics and are more popular with tourists. Many authors have also selected these regions as their research object [67,68,69,70,71]. Their geographical locations are shown in Figure 1.
2.2. Framework
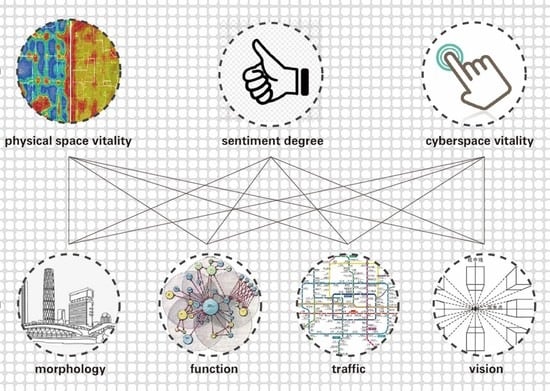
This study combines multi-source data and machine learning technology to evaluate the vitality characteristics of historical preservation zones (HPZs) and explore relevant influencing factors. A grid with a resolution of 100 m (approaching the minimum basic size of the old city of Beijing [72]) was used to divide the 8 HPZs into 842 units and then construct a buffer (radius = 250 m, the size selected contributed to the better performance of models after multiple attempts) with the centroid of each unit to calculate each indicator. The vitality characteristics of HPZs are divided into three dimensions, which are “physical space vitality”, “cyberspace vitality”, and “sentiment degree”. For the research conducted on the influencing factors, a total of 23 indicators were constructed from the four dimensions of block morphology, road traffic features, functional forms, and visual environment. Then, the three dimensions of vitality were used as responsive variables, respectively, to establish regression research, using the Random Forest algorithm (a supervised machine learning algorithm that is used widely in classification and regression problems) [73]. Lastly, the influence degree of each factor on vitality was explained based on the feature’s importance and correlation analysis. The workflow of this paper is shown in Figure 2.
2.3. Data Source
Multi-source data, including text data, social media data, Location-Based Service (LBS) data, POI data, street view data, building data, and road network data were selected to build the indicators. Table 1 lists the data sources and indicators’ descriptions in detail. According to machine learning terminology, “response” refers to variables that respond to the vitality characteristics of the historical preservation zones (HPZs), whereas “feature” refers to variables that may impact the response.
3. Methods
This study uses a combination of multi-source data and machine learning technology to measure the vitality of historical preservation zones (HPZs) and explore the influencing factors. Section 3.1 measures the vitality of HPZs, Section 3.2 constructs independent variables, and Section 3.3 conducts regression analysis based on machine learning.
3.1. Calculation of the Vitality of HPZs (Response Variables)
For the characterisation of vitality, the current literature has mostly applied the pedestrian volume in the physical space as a proxy for vitality [9]. However, this ignores the impact of social networking activities in contemporary society, as the vitality is not only reflected in the physical space, but also in virtual cyberspace. The definition of vitality in this study includes three dimensions—vitality in physical space, vitality in cyberspace, and sentiment degree from people. Based on this, this study divides the vitality into three parts, namely, Section 3.1.1, physical space vitality; Section 3.1.2, cyberspace vitality; and Section 3.1.3, sentiment degree.
3.1.1. Physical Space Vitality (PSV)
Pedestrian volume data, based on the counting of the number of pedestrians in the physical space, is always used to calculate the physical space vitality [1]. However, the conventional method, such as onsite observation or instance detection using captured videos, is time consuming and laborious [30], which also makes it difficult to cover a large scale in the spatial dimension or to cover long time series in the time dimension.
Baidu Mobile app services record people’s trajectories, offering an opportunity to reasonably and effectively observe the pedestrian flow density in the study area [74]. We collected heat map data on the weekend from Baidu Maps (http://lbsyun.baidu.com/, accessed on 19 June 2021), with a data sampling accuracy of 1 h, from 7:30 a.m. to 23:30 p.m. (19 June 2021). The raster data were imported into ArcGIS software and geo-calibrated using maps containing coordinates (WGS84 Universal Mercator Projection UTM Zone50). Due to lacking a precise legend, we used resampling technology (NEAREST) based on ArcGIS software to re-level the grid data of heat maps. Figure 3 shows the visualisation results.
3.1.2. Cyberspace Vitality (CSV)
Check-in data were suitable to represent cyberspace vitality, where many online social platforms provide check-in data such as Weibo, Flicker, Twitter, Facebook, etc. In China, Sina Weibo is the largest microblogging website with more than 500 million monthly active users. Therefore, scholars often select check-in (similar to Twitter # but contains more detailed geo-location information) data from Sina Weibo to study the vitality characteristics of Chinese cities [34,75,76].
Check-in data from Sina Weibo can reflect two-dimensional features: one is that the user actually reaches the place for activities, and the other is that the user is willing to share, which will bring corresponding network volume and attention heat after spreading through the network. We applied Weibo check-in data (https://www.beijingcitylab.com/data-released-1/, accessed on 6 June 2022) as a proxy for cyberspace vitality. The data were processed in ArcGIS software to regard the number of check-ins in the buffer of each sample point as the value of this indicator.
3.1.3. Sentiment Degree (SENT)
Natural language processing (NLP) technology, with the use of the Bidirectional Encoder Representations from Transformers (BERT) model (a transformer-based machine learning technique for NLP), was adopted to conduct the sentiment analysis on the texts. BERT is optimal in 11 natural language processing (NLP) tasks, including text translation, summary generation, text classification, etc., which uses the transformer framework in the kernel algorithm to more efficiently capture longer distance dependencies [77].
Firstly, we used the “name” of these 8 HPZs as keywords to search and crawl the contents (in Chinese) from Weibo. Secondly, the texts were processed by the BERT pre-training model (https://github.com/729593736/Sentiment-Analysis, accessed on 6 June 2022), with the output value ranging from 0 (negative) to 1 (positive). Then, we set the baseline as 0.5 to distinguish sentiment inclination to calculate each block’s sentiment degree with the proportion of positive samples. Table 2 shows some examples processed by NLP. Lastly, according to the calculation results, we assigned values to the sample points in each of the historical preservation zones (HPZs).
3.2. Calculation of Influence Factors (Feature Variables)
We have constructed influence variables from four dimensions, which are morphological indicators, functional indicators, visual indicators, and road traffic indicators. The calculation method is shown in the following sections.
3.2.1. Calculation of Morphological Indicators
The impact of urban morphological factors on urban vitality has been demonstrated by many classical theories, implying that urban morphological characteristics could affect the intensity and complexity of pedestrians’ activities. At present, many researchers choose different morphological indicators to study the impact of these factors on vitality and to verify the influence on the vitality of HPZs [9]. The morphological indicators frequently selected include the average of building height [22,23], standard deviation of building height [22], building density [22,23,66], floor area ratio [78], etc. This study constructed four morphological indicators to represent a possible impact on urban vitality based on geographic data (buildings, roads, etc.) combined with ArcGIS software. Table 3 shows the formulas for the morphological indicators.
3.2.2. Calculating Functional Indicators
Functional density is one of the influential primary variables that activates the street ground interface [29,79]. The quantity and quality of functional facilities reflect an area’s development and are essential factors for gaining popularity. Among the data types of various urban functions, POI data can reflect various residential activities (life, work, communication, etc.) [80], and recordings of the location of function points with high accuracy have been widely used in scientific research on vitality [9,32]. For example, Zhang et al. [69] selected the POI type of tourist attractions and commercial shops; tourist attractions, shopping, and catering services were used by Hu et al. [74]; shopping, life services, and catering were adopted by Lu et al. [16]. Therefore, after consulting many previous studies, we finally selected seven types of POI after eliminating the types that were incompatible with the functions of historical preservation zones (HPZs), as shown in Table 1. We used python to create a crawler to obtain POI data from the Baidu open platform, including attractions, catering, infrastructures, education, hotels, shopping, and entertainment. The number of POI was counted by ArcGIS software as a feature variable.
3.2.3. Calculating Road Traffic Indicators
Many studies contend that the shape of the street section affects vitality. Using ArcGIS software, the obtained road network data were firstly modified. Network topology was processed in this study to generate intersection nodes based on network analysis tools. Then, we calculated the two indicators of intersection density and average street length, which are two important elements used to research vitality [22].
We also incorporated the index of accessibility, which is an important factor that reflects the convenience of pedestrian travelling [9], but which has not been a directly observable variable in many previous studies [53]. This study used a spatial minimum impedance model to calculate walking accessibility. ArcGIS software was used to build the OD cost matrix to conduct the calculation. The calculation formula is as follows:
where is the impedance of network node ; H is the impedance of the sample point; indicates the minimum impedance between nodes ; n is the number of nodes in the network. The smaller the H is, the larger the accessibility value is.
3.2.4. Calculating Visual Indicators
The visual environment will affect the psychological perception of pedestrians [81,82,83]. The proportion of physical elements obtained from street view images can effectively evaluate the built environment; therefore, it has been widely used in many studies to measure urban vitality [1,84,85]. Deep learning technology conducts semantic segmentation on street view images to classify each pixel in an image based on a convolutional neural network (CNN). Currently, the research mode of combining street view image data and deep learning technology has become an important paradigm of street visual environment auditing, creating interest in many research topics such as style, perception, and walkability [86,87,88].
First, sampling points were generated along the street axis, with a spacing of 50 m (an appropriate size widely used in many studies [82,83,89]), to obtain relatively sufficient street view images from the Baidu maps (https://lbsyun.baidu.com/, accessed on 20 June 2021). Secondly, Deeplab v3+, a pretrained network, is employed for semantic segmentation based on MATLAB Deep Learning Toolbox and Computer Vision Toolbox. Thirdly, we calculated the proportion of each visual element and counted the average proportion of street view elements in the buffer of each research unit. We finally selected 9 types of streetscape elements, including the Green Looking Ratio, Sky View Ratio, Road Ratio, etc., as the visual indicators (see Table 1 for details). Figure 4 shows an example of semantic segmentation processing.
3.3. Regression Analysis
3.3.1. Multivariate Statistical Correlation Analysis
Indicators for dimensionless processing are processed through Z-score standardisation to meet the normal distribution (mean value of 0 and variance of 1). Secondly, python’s SciPy package is employed for the Pearson correlation test, and the correlation coefficients, ranging from −1 to 1, could be used to measure the linear correlation between two variables. The correlation degree and direction can be seen visually by the heatmap of the correlation coefficient matrix.
3.3.2. Random Forest Modeling
The Random Forest algorithm, one of the ensemble machine learning algorithms, combines several randomized decision trees and aggregates their predictions through averages [90]. First created by Ho [91] and later improved by Breiman [92], the Random Forest algorithm uses an out-of-bag error to estimate the generalization error and measure variable importance through permutations [41]. This method can effectively analyze the nonlinear correlation between quantitative indicators; moreover, it offers several advantages such as not requiring the preprocessing of data, convenient and fast processing, and stable results [93]. Meanwhile, the algorithm does not overfit data because of the law of large numbers, making it unlikely to have poor accuracy on unseen data, and can generalize well for training data [94], making it among the most popular and powerful supervised machine learning algorithms [41,95,96].
Based on the above advantages, the Random Forest algorithm was used to construct a regression model to reveal the impact of different influencing factors on the three kinds of vitality, respectively (we also chose other algorithms to make comparisons in order to explore the performance of the Random Forest model, seen in Appendix A). The 23 indexes mentioned in Section 3.2 were selected as independent variables, and three kinds of vitality were selected as dependent variables, respectively. The 842 study units were divided into a training set and a test set with a ratio of 8:2, where the former was used to train the model and the latter was used to verify stability and generalization ability. The implementation processes of machine learning modeling are based on the Scikit-learn Python library [97], through which we calculated 3 metrics (the coefficient of determination (R2), the Root Mean Square Error (RMSE), and the Mean Absolute Error (MAE)) on the test set to evaluate the accuracy of a prediction model.
3.3.3. Feature Importance
The Gini impurity coefficient method of Random Forest is used for detecting feature importance [98]. Each tree in the Random Forest splits according to a certain node. Every time the split of a node is made on a variable, the Gini impurity criterion for the two descendent nodes is less than the parent node. The importance measure for a particular variable is obtained as the average decrease in the Gini impurity index over all trees in the forest [99], which is used as the standard to assess the importance of a feature [100]. By importing the Scikit-learn machine learning package into python to use the Random Forest algorithm, we can sort the importance of variables from high to low. Then, we created a layout chart of the feature to explain its importance. The formula is as follows:
where denotes Gini impurity index, D is the data set, k is the Random Forest decision tree species, is the probability that the sample belongs to k.
4. Results and Discussion
4.1. Results of Variable Correlation
As can be seen from Figure 5 and Figure A1, from the perspective of the data distribution, for different response variables (three kinds of vitalities), the correlation degree and influence direction of different influencing factors have their own characteristics, as follows:
- The physical space vitality (PSV) is negatively related to the density of road intersections density (ID), the number of shopping and consumption places (P_S), the number of catering places (P_C), and the sky view ratio (R_SV); however, it is positively related to the proportion of buildings (R_BU) in the field of vision. In the historical preservation zones (HPZs) with tourism as the main business form, pedestrians prefer the slow-moving system of the ancient city to enjoy their journeys. The denser the road intersections in the zones, the more complicated the road traffic, which is not conducive to people’s staying and entertainment. The number of places for shopping and entertainment is usually the means for commercial districts to attract people. However, due to the restrictions of urban morphology and protection policies, there are generally not many shopping and entertainment places within HPZs. Therefore, they show the opposite trend to the physical space vitality, indicating the difference between HPZs and commercial districts. As for the visual environment, due to the small street scale in the ancient city, the higher the sky view ratio, the higher the width, and the lower the comfort scale. Relatively speaking, the higher the proportion of buildings, the more comfortable the surrounding feeling, which could attract more pedestrian flow. Due to the limitations of the Baidu heat map data, we could not identify the groups who are the real pedestrians, therefore the conclusion maybe biased; however, from the perspective of volume of crowd, it also provides beneficial ideas;
- The sentiment degree of the crowd (SENT) has a negative correlation with the number of public infrastructures (P_I) and road impedance (ACC), by comparison, and a positive correlation with the ratio of pavements (R_P) in the field of vision. The smaller the impedance of the road means, the better the accessibility of the block, meaning that it is more convenient for the pedestrian to reach. The reason the number of public infrastructures is negatively correlated with the sentiment degree of the crowd, contrary to empirical experience, may be caused by the improper layout of public facilities in historical preservation zones (HPZs) at present. The higher the proportion of pavements in the field of vision means a better slow-moving system which is more friendly to pedestrians;
- The cyberspace vitality (CSV) is positively related to the number of entertainment and leisure facilities (P_E), shopping and consumption places (P_S), and caterings places (P_C), while it is negatively related to the average building height (H_M) and floor area ratio (FAR). Among them, the correlation between cyberspace vitality and the number of entertainment and shopping places shows the opposite direction compared to the physical space vitality. We can also deduce that the cyberspace vitality is different from the physical vitality. This is because Sina Weibo is more focused on the young generations; therefore, the historical preservation zones (HPZs) that attract young people to “check-in” are intended to have more “youngster-targeted” business forms, which are closely related to the booming cyber-star economy. The higher floor area ratio and average building height indicate a more enclosed space, with which it is relatively difficult to attract a crowd’s attention.
4.2. Results of Overall Model Performance
According to the regression results from Table 4, the Random Forest model established by the 23 indicators has a good fitting ability for the data distribution. R2 is the major metric to evaluate the performance of models. A higher R2 value implies the higher accuracy of a prediction model. Among them, the R2 of model_1 is 0.86, the R2 of model_2 is 0.85, and the R2 of model_ 3 is 0.76. The RMSE and MAE of each model is less than 0.5 and 0.4, respectively, where the lower RMSE and MAE value implies the higher accuracy of a prediction model. Compared to the R2 scores achieved by Wu et al. (0.315 and 0.425) [36], Xiao et al. (0.735) [23], Hunag et al. (0.760) [22], Niu et al. (0.618–0.869) [65], and Wu et al. (0.446–0.875) [9], it can be seen that the three models established in this study have a good performance in explaining the variables as well as good generalization. The models can be applied to the large-scale measurement of the three vitalities in the other HPZs of Beijing to conveniently obtain more rapid and refined results.
4.3. Analysis on Influencing Factors of Vitality Characteristics
It can be seen from Figure 6 that, different from the results of the correlation analysis in Section 4.1, the Random Forest algorithm can describe the nonlinear relationship between multi-variables and response variables. Therefore, the order of feature importance and the correlation coefficient’s absolute value are not the same. Specifically:
- In model_1, the density of the road intersections density (ID) has the most significant impact on the physical space vitality, which may be because more dense intersections mean heavier traffic. Combined with the analysis results in Section 4.1, it reveals that the area with an excessive density of road intersections will have a certain obstacle to attracting offline pedestrian flow. The number of shopping and consumption places (P_S) and road impedance (ACC) are the other factors that have an impact. Combined with the analysis results in 4.1, it is known that these two factors have a negative impact on the vitality of physical space. However, the number of hotel facilities (P_H), the number of public infrastructures (P_I), and the floor area ratio (FAR) have little impact on the physical space vitality;
- According to the importance ranking of features, in model_2, road impedance (ACC) and the number of public infrastructures (P_I) have the greatest impact on the crowd’s sentiment. Combined with the results in Figure 5 of Section 4.1, these two factors negatively affect the population’s sentiment. Secondly, the sky view ratio (R_SV), the number of pedestrians (R_PE), the standard deviation of building height (H_SD), and the average building height (H_M) also have a positive impact on crowd satisfaction. Other factors, especially the number of hotels (P_H) and the number of educational facilities (P_EF), are less critical in the model;
- According to the ranking of the feature importance of model_3, the factors that have a greater impact on the vitality of cyberspace are the number of catering places (P_C) and entertainment facilities (P_E), which have a positive effect on the vitality of cyberspace. Factors such as road impedance (ACC), the number of attractions (P_A), and green looking ratio (R_GL) are also important in the model. However, the number of hotels (P_H), the road intersection density (ID), and the number of public infrastructures (P_I) are of little importance.
The importance and direction of the influencing factors are different for different vitality types. In general, for the three models, the road impedance of each shows importance, which means that areas with better road accessibility will bring more vitality in physical space and cyberspace. The number of hotels is less important in the three models; therefore, in the next step, this factor can be deleted to improve the model’s fitting ability and generalization performance.
5. Conclusions
With the rising awareness of urban heritage protection agendas, scholars have been paying more attention to the vitality of historical preservation zones (HPZs) in recent years. In this study, we selected 842 units from eight HPZs to evaluate the vitality characteristics of HPZs and to explore the influencing factors via multi-source data and machine learning technologies. The vitality characteristics of HPZs were identified from three dimensions: physical space vitality, cyberspace vitality, and sentiment degree. For the research on the influencing factors, with the use of CV, NLP, and GIS techniques, a total of 23 variables were constructed from the four dimensions (block morphology, transportation features, functional forms, and visual environment). Then, using the Random Forest algorithm, the three dimensions of vitality were used as responsive variables, respectively, to establish three regression models. Lastly, each factor’s influence degree and direction on vitality was explained based on the feature importance and correlation analysis.
- (1)
- In terms of research methods and workflow, this paper proposed a framework which combines multi-source data and machine learning technology and integrates with other advanced digital analytical approaches such as CV, NLP, and GIS for the construction of vitality indexes. This could provide a new perspective for urban vitality research and other quantitative research on relevant topics;
- (2)
- As for the performance of models, all Random Forest models proposed in this research have a good fitting ability to the data distribution: the R2 of model 1(physical space vitality) is 0.86, the R2 of model 2(sentiment degree) is 0.85, and the R2 of model 3 is 0.76 (cyberspace vitality), and the RMSE of each model is less than 0.5. All three models established in this study have good performance in explaining variables and generalization, which can be further applied to the large-scale measurement in the other HPZs of Beijing, suggesting more rapid and informative results;
- (3)
- For the influencing factors of vitality, we have summarized the following findings:
- The density of road intersections has the most significant impact on physical space vitality, which is negatively related to the vitality. The density of shopping and consumption places and road impedance are the other factors that negatively impact the vitality of a physical space;
- The factors that have the greatest impact on the sentiment of the crowd are road impedance and the number of public infrastructures, which cause multiple negative effects on the satisfaction of the population;
- The number of catering places and entertainment facilities are the most critical factors that significantly affect a cyberspace’s vitality.
Admittedly, this study has certain limitations, wherein the current data’s accuracy and timeliness are not very sufficient. Due to the limits of the data types, the conclusion might slightly deviate from reality, as the Baidu heatmap data are used to proxy the vitality of physical space. In addition, the study samples are all located in Beijing, therefore intercity research and subsequent comparisons exceed this paper’s scope and may require additional investigation. However, the data accuracy can be improved with emerging techniques and a better data repository in future research; the proposed research framework and the workflow of the Beijing case study can be applied in other cities/areas with minor calibrations for further investigations.
In general, through the research of this article, we have thoroughly discussed the various representations of urban vitality and explored the influencing factors of the different urban vitalities of historical preservation zones (HPZs), providing a new perspective for research in related fields. In addition, the conclusions of this paper can serve as a guide for officials and urban designers and could potentially enhance the evidence-based design and management process for developing more vital, sustainable, and historically sensitive cities domestically and internationally.
Author Contributions
Conceptualisation, P.G. and X.H.; methodology, P.G. and X.H.; software, P.G.; validation, P.G. and X.H.; formal analysis, P.G.; investigation, S.W. and P.G.; resources, X.H.; data curation, P.G.; writing—original draft preparation, P.G., S.W. and X.H.; writing—review and editing, M.W.; visualisation, P.G. and S.W.; supervision, X.H.; project administration, B.Z., X.H. and M.W.; and funding acquisition, B.Z., X.H. and M.W. All authors have read and agreed to the published version of the manuscript.
Funding
This project is funded by the National Natural Science Foundation of China (NSFC) [52208039], the National key R&D program “Science and Technology Winter Olympics” key project “Evacuation system and support technology for assisting physically challenged communities” [2020YFF0304900], the Beijing High-level Overseas Talents Support Funding, R&D Program of Beijing Municipal Education Commission (KM202210009008), the NCUT Young Scholar Development Project, and the Australian Research Council Linkage Project [LP190100089].
Data Availability Statement
https://www.baidu.com for the data of POI (accessed on 10 April 2021), building, road network (accessed on 15 June 2021) and heatmap (accessed on 19 June 2021); weibo.com for the data of posting texts (accessed on 18 June 2021); https://www.lbsyun.baidu.com for street view image (accessed on 18 June 2021).
Acknowledgments
Huang Chenyu provided help in natural language processing.
Conflicts of Interest
The authors declare no conflict of interest.
Appendix A

Table A1.
Performance of models based on other algorithms.
| Model Types | Physical Space Vitality (R2) | Sentiment Degree (R2) | Cyber Space Vitality (R2) |
|---|---|---|---|
| Random Forest | 0.86 | 0.85 | 0.76 |
| Fine regression Tree | 0.61 | 0.64 | 0.39 |
| Linear regression | 0.58 | 0.59 | 0.54 |
| Robust linear regression | 0.68 | 0.50 | 0.53 |
| Linear SVM | 0.53 | 0.51 | 0.53 |
| Gaussian SVM | 0.56 | 0.09 | 0.15 |
| Kernel Approximation regression | 0.76 | 0.78 | 0.73 |
| Boost tree | 0.72 | 0.80 | 0.67 |
| Bagged tree | 0.78 | 0.76 | 0.69 |
| Shallow neural network | 0.70 | 0.83 | 0.66 |
| 2-layer neural network | 0.62 | 0.85 | 0.44 |
Because there are many algorithms, we cannot compare all machine learning algorithms in this article. However, as can be seen from Table A1, compared with the above other 10 models, the Random Forest model performs best in this task. Therefore, we determined that Random Forests are very suitable in this study.
Appendix B
Figure A1.
Two-tailed statistical significance test.

References
- Li, M.; Liu, J.; Lin, Y.; Xiao, L.; Zhou, J. Revitalising historic districts: Identifying built environment predictors for street vibrancy based on urban sensor data. Cities 2021, 117, 103305. [Google Scholar] [CrossRef]
- Wang, J. Exploring the Approaches of Adaptive Conservation, Reconstruction and Revitalization of Historic Districts A Case Study of Gunanjie Street in Dingshu, Yixing. Archit. J. 2021, 5, 1–7. [Google Scholar] [CrossRef]
- Whitehand, J.W.R.; Gu, K. Conserving urban landscape heritage: A geographical approach. Procedia-Soc. Behav. Sci. 2010, 2, 6948–6953. [Google Scholar] [CrossRef] [Green Version]
- Whitehand, J.W.R.; Gu, K.; Whitehand, S.M.; Zhang, J. Urban morphology and conservation in China. Cities 2011, 28, 171–185. [Google Scholar] [CrossRef]
- Yong, H.; Sun, Y. Review on Historical District Preservation and Renovation Practice. Planner 2015, 31, 98–104. [Google Scholar]
- Zheng, L.J.; Yang, C. Public Participation in the Dynamic Conservation of Historic Districts. City Plan. Rev. 2005, 7, 63–65. [Google Scholar]
- Yu, D.; Huang, Z.; Wang, C. On Dynamic Protection Planning of Urban Historical Blocks: A Case Study of China First Automobile Works Historical Area. Urban Stud. 2011, 18, 79–83. [Google Scholar]
- Jiang, T.; Dai, J.; Ju, D. Exploration on the implementation method of historic conservation area from street renewal to urban block renewal: The example of Dongzhimennei Avenue in Beijing. Urban Issues 2022, 9, 24–34. [Google Scholar] [CrossRef]
- Wu, J.; Lu, Y.; Gao, H.; Wang, M. Cultivating historical heritage area vitality using urban morphology approach based on big data and machine learning. Comput. Environ. Urban Syst. 2022, 91, 101716. [Google Scholar] [CrossRef]
- Zhou, X.P.; Tang, J.Y. A Study on Commercial Development Pattern and Planning Method of Historic District: Taking Jinli, Kuanzhai Lane and Wneshu District as Example. Urban Plan. Forum 2009, 5, 107–113. [Google Scholar]
- Mao, Z.; Chen, X.; Xiang, Z.; Chen, Y. Research on the Measurement and Influencing Factors of Street Vigour in Historic Districts: A Case Study of Wenming Street Historic District in Kunming. South Archit. 2021, 4, 48–55. [Google Scholar]
- Throsby, D. Investment in urban heritage conservation in developing countries: Concepts, methods and data. City Cult. Soc. 2016, 7, 81–86. [Google Scholar] [CrossRef]
- Chen, Y.; Lei, C. Evolution of the Conservation Problems and Planning Strategies of Pingjiang Historic and Cultural Area: Mechanism Simulation Analysis Based on System Dynamics. Urban Plan. 2022, 46, 84–95. [Google Scholar]
- Wang, J. Problems and solutions in the protection of historical urban areas. Front. Arch. Res. 2012, 1, 40–43. [Google Scholar] [CrossRef] [Green Version]
- Zhong, X. Vigorous Renaissance of Historic Precincts: A Case Study of Furong Historic Precinct in Jinan. Mod. Urban Res. 2011, 26, 44–48. [Google Scholar]
- Lu, X.; Xiao, Y.; Li, M. The Eco-Sustainable Planning and Revitalisation of Historic and Cultural Blocks: A Case Study of Jiang’an South District Renovation in Wuhan. World Archit. 2022, 8, 51–56. [Google Scholar] [CrossRef]
- Wang, M.; Yang, X.; Peng, M.; Yan, X. Tourism Aesthetic Fatigue: Performance Characteristics, Formation Mechanism and Mitigation Measures. Tour. Trib. 2022, 37, 109–117. [Google Scholar] [CrossRef]
- Shang, Q. Underground Space: A View for the Conservation of Beijing Old City. Procedia Eng. 2016, 165, 265–276. [Google Scholar] [CrossRef]
- Zhang, L.; Wang, Y.; Xu, Y.; Li, L. The Improvement Approach of the Historic District’s Evacuation Direction Sign Based on Fuzzy Control. Archit. J. 2017, S2, 40–44. [Google Scholar]
- Xu, M.; Wu, S.; Xu, J. Research on the Renovated Hotels in Historic Districts and Their Contribution to the Vitality of Historic and Cultural Districts, Qingdao. Planners 2019, 35, 43–50. [Google Scholar]
- Wu, Y.; Deng, Y. Study of the Residential Rehabilitation-orient mode for the Historical Districts: Taking Xiaohezhijie Historical District in Hangzhou China and Honmachi District in Takahashi Japan as Examples. Urban Stud. 2016, 23, 51–57+2. [Google Scholar]
- Huang, B.; Zhou, Y.; Li, Z.; Song, Y.; Cai, J.; Tu, W. Evaluating and characterising urban vibrancy using spatial big data: Shanghai as a case study. Environ. Plan. B Urban Anal. City Sci. 2020, 47, 1543–1559. [Google Scholar] [CrossRef]
- Xiao, L.; Lo, S.; Liu, J.; Zhou, J.; Li, Q. Nonlinear and synergistic effects of TOD on urban vibrancy: Applying local explanations for gradient boosting decision tree. Sustain. Cities Soc. 2021, 72, 103063. [Google Scholar] [CrossRef]
- Jacobs, J. The Death and Life of American Cities; Vintage Book Company: New York, NY, USA, 1961. [Google Scholar]
- Gehl, J. Life between Buildings: Using Public Space; Koch, J., Translator; Van Nostrand Reinhold: New York, NY, USA, 1987. [Google Scholar]
- Montgomery, J. Making a city: Urbanity, vitality and urban design. J. Urban Des. 1998, 3, 93–1166. [Google Scholar] [CrossRef]
- Moreno, C.; Allam, Z.; Chabaud, D.; Gall, C.; Pratlong, F. Introducing the “15-Minute City”: Sustainability, Resilience and Place Identity in Future Post-Pandemic Cities. Smart Cities 2021, 4, 93–111. [Google Scholar] [CrossRef]
- Guo, X.; Yang, Y.; Cheng, Z.; Wu, Q.; Li, C.; Lo, T.; Chen, F. Spatial social interaction: An explanatory framework of urban space vitality and its preliminary verification. Cities 2022, 121, 103487. [Google Scholar] [CrossRef]
- Mouratidis, K.; Poortinga, W. Built environment, urban vitality and social cohesion: Do vibrant neighbourhoods foster strong communities? Landsc. Urban Plan. 2020, 204, 103951. [Google Scholar] [CrossRef]
- Mu, B.; Liu, C.; Mu, T.; Xu, X.; Tian, G.; Zhang, Y.; Kim, G. Spatiotemporal fluctuations in urban park spatial vitality determined by on-site observation and behavior mapping: A case study of three parks in Zhengzhou City, China. Urban For. Urban Green. 2021, 64, 127246. [Google Scholar] [CrossRef]
- Meng, Y.; Xing, H. Exploring the relationship between landscape characteristics and urban vibrancy: A case study using morphology and review data. Cities 2019, 95, 102389. [Google Scholar] [CrossRef]
- Wu, C.; Ye, X.; Ren, F.; Du, Q. Check-in behaviour and spatio-temporal vibrancy: An exploratory analysis in Shenzhen, China. Cities 2018, 77, 104–116. [Google Scholar] [CrossRef]
- Dong, X.; Lian, Y. A review of social media-based public opinion analyses: Challenges and recommendations. Technol. Soc. 2021, 67, 101724. [Google Scholar] [CrossRef]
- Li, F.; Li, F.; Li, S.; Long, Y. Deciphering the recreational use of urban parks: Experiments using multi-source big data for all Chinese cities. Sci. Total Environ. 2020, 701, 134896. [Google Scholar] [CrossRef] [PubMed]
- Jin, X.; Long, Y.; Sun, W.; Lu, Y.; Yang, X.; Tang, J. Evaluating cities’ vitality and identifying ghost cities in China with emerging geographical data. Cities 2017, 63, 98–109. [Google Scholar] [CrossRef]
- Wu, J.; Ta, N.; Song, Y.; Lin, J.; Chai, Y. Urban form breeds neighborhood vibrancy: A case study using a GPS-based activity survey in suburban Beijing. Cities 2018, 74, 100–108. [Google Scholar] [CrossRef]
- Zhang, L.; Zhang, R.; Yin, B. The impact of the built-up environment of streets on pedestrian activities in the historical area. Alex. Eng. J. 2021, 60, 285–300. [Google Scholar] [CrossRef]
- Lan, F.; Gong, X.; Da, H.; Wen, H. How do population inflow and social infrastructure affect urban vitality? Evidence from 35 large- and medium-sized cities in China. Cities 2020, 100, 102454. [Google Scholar] [CrossRef]
- Tu, W.; Zhu, T.; Xia, J.; Zhou, Y.; Lai, Y.; Jiang, J.; Li, Q. Portraying the spatial dynamics of urban vibrancy using multisource urban big data. Comput. Environ. Urban Syst. 2010, 80, 101428. [Google Scholar] [CrossRef]
- García-Palomares, J.C.; Salas-Olmedo, M.H.; Moya-Gómez, B.; Condeço-Melhorado, A.; Gutiérrez, J. City dynamics through Twitter: Relationships between land use and spatiotemporal demographics. Cities 2018, 72, 310–319. [Google Scholar] [CrossRef]
- Zong, W.; Zhang, J. Use of smartphone applications and its impacts on urban life: A survey and random forest analysis in Japan. Sustain. Cities Soc. 2019, 49, 101589. [Google Scholar] [CrossRef]
- Blanford, J.I.; Huang, Z.; Savelyev, A.; MacEachren, A.M. Geo-Located Tweets. Enhancing Mobility Maps and Capturing Cross-Border Movement. PLoS ONE 2015, 10, e0129202. [Google Scholar] [CrossRef]
- Wu, Z.; Ye, Z. Research on Urban Spatial Structure Based on Baidu Heat Map: A Case Study on the Central City of Shanghai. City Plan. Rev. 2016, 4, 33–40. [Google Scholar]
- Liu, L.; Liu, Z. The Recognition of CAZ in Shanghai Based on Evaluated POI. In Big Data Support of Urban Planning and Management; Springer: Cham, Switzerland, 2018; pp. 99–112. [Google Scholar]
- Long, Y.; Mao, M.; Mao, Q.; Shen, Z.; Zhang, Y. Fine-Scale Urban Modeling and Its Opportunities in the “Big Data” Era: Methods, Dataand Em-Pirical Studies. Hum. Geogr. 2014, 29, 7–13. [Google Scholar]
- Yue, W.; Chen, Y.; Zhang, Q.; Liu, Y. Spatial Explicit Assessment of Urban Vitality Using Multi-Source Data: A Case of Shanghai, China. Sustainability 2019, 11, 638. [Google Scholar] [CrossRef] [Green Version]
- Wang, X.; Zhang, Y.; Yu, D.; Qi, J.; Li, S. Investigating the spatiotemporal pattern of urban vibrancy and its determinants: Spatial big data analyses in Beijing, China. Land Use Policy 2022, 119, 106162. [Google Scholar] [CrossRef]
- Sung, H.; Lee, S. Residential built environment and walking activity: Empirical evidence of Jane Jacobs’ urban vitality. Transp. Res. Part D Transp. Environ. 2015, 41, 318–329. [Google Scholar] [CrossRef]
- Zhang, A.; Li, W.; Wu, J.; Lin, J.; Chu, J.; Xia, C. How can the urban landscape affect urban vitality at the street block level? A case study of 15 metropolises in China. Environ. Plan. B Urban Anal. City Sci. 2021, 48, 1245–1262. [Google Scholar] [CrossRef]
- Li, X.; Li, Y.; Jia, T.; Zhou, L.; Hijazi, I.H. The six dimensions of built environment on urban vitality: Fusion evidence from multi-source data. Cities 2022, 121, 103482. [Google Scholar] [CrossRef]
- Huang, D.; Liu, Z.; Zhao, X.; Zhao, P. Emerging polycentric megacity in China: An examination of employment subcenters and their influence on population distribution in Beijing. Cities 2017, 69, 36–45. [Google Scholar] [CrossRef]
- Koohsari, M.J.; Kaczynski, A.T.; Mcormack, G.R.; Sugiyama, T. Using Space Syntax to Assess the Built Environment for Physical Activity: Applications to Research on Parks and Public Open Spaces. Leis. Sci. 2014, 36, 206–216. [Google Scholar] [CrossRef]
- Liu, S.; Lai, S.-Q.; Liu, C.; Jiang, L. What influenced the vitality of the waterfront open space? A case study of Huangpu River in Shanghai, China. Cities 2021, 114, 103197. [Google Scholar] [CrossRef]
- Allam, Z.; Nieuwenhuijsen, M.; Chabaud, D.; Moreno, C. The 15-minute city offers a new framework for sustainability, liveability, and health. Lancet Planet. Health 2022, 6, e181–e183. [Google Scholar] [CrossRef]
- Allam, Z.; Bibri, S.E.; Chabaud, D.; Moreno, C. The ‘15-Minute City’ concept can shape a net-zero urban future. Humanit. Soc. Sci. Commun. 2022, 9, 126. [Google Scholar] [CrossRef]
- Niu, Y.; Mi, X.; Wang, Z. Vitality evaluation of the waterfront space in the ancient city of Suzhou. Front. Arch. Res. 2021, 10, 729–740. [Google Scholar] [CrossRef]
- Liang, Y.; D’Uva, D.; Scandiffio, A.; Rolando, A. The more walkable, the more livable?—Can urban attractiveness improve urban vitality? Transp. Res. Procedia 2022, 60, 322–329. [Google Scholar] [CrossRef]
- Wu, W.; Dang, Y.; Zhao, K. Spatial Characteristics of Urban Vitality based on Multi-dimensional Perception. J. Geo-Inf. Sci. 2022, 24, 1867–1882. [Google Scholar] [CrossRef]
- Wu, Y.; Wang, L.; Fan, L.; Yang, M.; Zhang, Y.; Feng, Y. Comparison of the spatiotemporal mobility patterns among typical subgroups of the actual population with mobile phone data: A case study of Beijing. Cities 2020, 100, 102670. [Google Scholar] [CrossRef]
- Yang, J.; Cao, J.; Zhou, Y. Elaborating non-linear associations and synergies of subway access and land uses with urban vitality in Shenzhen. Transp. Res. Part A Policy Pract. 2021, 144, 74–88. [Google Scholar] [CrossRef]
- Chen, Z.; Dong, B.; Pei, Q.; Zhang, Z. The impacts of urban vitality and urban density on innovation: Evidence from China’s Greater Bay Area. Habitat Int. 2022, 119, 102490. [Google Scholar] [CrossRef]
- Yang, C.; Lv, C. Study on Slow-Traffic Vitality Impact Factors of Urban Waterfront Based on GWR Model: Taking Typical Waterfront Blocks along Huangpu River as Examples. J. Hum. Settl. West China 2022, 37, 55–62. [Google Scholar] [CrossRef]
- Wu, F.; Chen, M. Research on Hot Trends and Case Studies of the Vitality of Foreign Public Spaces Using Citespace in the Past 15 Years. Urban Stud. 2021, 28, 6–12. [Google Scholar]
- Mushkani, R.A.; Ono, H. The role of land use and vitality in fostering gender equality in urban public parks: The case of Kabul city, Afghanistan. Habitat Int. 2021, 118, 102462. [Google Scholar] [CrossRef]
- Niu, T.; Qing, L.; Han, L.; Long, Y.; Hou, J.; Li, L.; Tang, W.; Teng, Q. Small public space vitality analysis and evaluation based on human trajectory modeling using video data. Build. Environ. 2022, 225, 109563. [Google Scholar] [CrossRef]
- Gómez-Varo, I.; Delclòs-Alió, X.; Miralles-Guasch, C. Jane Jacobs reloaded: A contemporary operationalisation of urban vitality in a district in Barcelona. Cities 2022, 123, 103565. [Google Scholar] [CrossRef]
- Wang, F.; Yan, L.; Xiong, X.; Wu, B. A Study on Tourist Cognition of Urban Memory in Historic Sites: A Case Study of Alley Nanluogu Historic Site in Beijing. Acta Geogr. Sin. 2012, 67, 545–556. [Google Scholar]
- Chen, L.; Zhang, W. The Change and Reconstruction of Local Culture in Response to Urban Renewal and Globalization: A Case Study of Shichahai Historic District. Prog. Geogr. 2010, 29, 649–656. [Google Scholar]
- Zhang, Y.; Yang, C.; Qi, L. Study on the Assessment of Street Vitality and Influencing Factors in the Historic District—A Case Study of Shichahai Historic District. Chin. Landsc. Archit. 2019, 35, 106–111. [Google Scholar]
- González Martínez, P. Authenticity as a challenge in the transformation of Beijing’s urban heritage: The commercial gentrification of the Guozijian historic area. Cities 2016, 59, 48–56. [Google Scholar] [CrossRef] [Green Version]
- Shin, H.B. Urban conservation and revalorisation of dilapidated historic quarters: The case of Nanluoguxiang in Beijing. Cities 2010, 27, S43–S54. [Google Scholar] [CrossRef]
- Deng, Y.; Mao, Q. Study on the Formation and Scale of Block of Beijing Inner City Based on Qianlong map. Urban Plan. 2003, 10, 58–65. [Google Scholar]
- Rigatti, S.J. Random forest. J. Insur. Med. 2017, 47, 31–39. [Google Scholar] [CrossRef] [Green Version]
- Hu, W.; Shen, S.; Yang, F.; Bao, Z. Research on the Evaluation and Influencing Factors of the Vitality of Historical and Cultural Districts based on Multi-source Big Data. Chin. Overseas Archit. 2021, 9, 96–101. [Google Scholar] [CrossRef]
- Long, Y.; Huang, C. Does block size matter? The impact of urban design on economic vitality for Chinese cities. Environ. Plan. B Urban Anal. City Sci. 2019, 46, 406–422. [Google Scholar] [CrossRef] [Green Version]
- Liu, S.; Ge, J.; Bai, M.; Yao, M.; He, L.; Chen, M. Toward classification-based sustainable revitalisation: Assessing the vitality of traditional villages. Land Use Policy 2022, 116, 106060. [Google Scholar] [CrossRef]
- Koroteev, M.V. BERT: A Review of Applications in Natural Language Processing and Understanding. arXiv 2021, arXiv:2103.11943. [Google Scholar]
- Huang, C.; Gong, P.; Ding, R.; Qu, S.; Yang, X. Comprehensive Analysis of the Vitality of Urban Central Activities Zone Based on Multi-Source Data. In Proceedings of the 26th International Conference of the Association for Computer-Aided Architectural Design Research in Asia (CAADRIA), Virtual Conference, 29 March–1 April 2021; pp. 549–558. [Google Scholar] [CrossRef]
- Li, Y.; Yabuki, N.; Fukuda, T. Exploring the association between street built environment and street vitality using deep learning methods. Sustain. Cities Soc. 2022, 79, 103656. [Google Scholar] [CrossRef]
- He, Q.; He, W.; Song, Y.; Wu, J.; Yin, C.; Mou, Y. The impact of urban growth patterns on urban vitality in newly built-up areas based on an association rules analysis using geographical ‘big data’. Land Use Policy 2018, 78, 726–738. [Google Scholar] [CrossRef]
- Zhang, F.; Zhou, B.; Liu, L.; Liu, Y.; Fung, H.H.; Lin, H.; Ratti, C. Measuring human perceptions of a large-scale urban region using machine learning. Landsc. Urban Plan. 2018, 180, 148–160. [Google Scholar] [CrossRef]
- Qiu, W.; Zhang, Z.; Liu, X.; Li, W.; Li, X.; Xu, X.; Huang, X. Subjective or objective measures of street environment, which are more effective in explaining housing prices? Landsc. Urban Plan. 2022, 221, 104358. [Google Scholar] [CrossRef]
- Ma, X.; Ma, C.; Wu, C.; Xi, Y.; Yang, R.; Peng, N.; Zhang, C.; Ren, F. Measuring human perceptions of streetscapes to better inform urban renewal: A perspective of scene semantic parsing. Cities 2021, 110, 103086. [Google Scholar] [CrossRef]
- Lu, Y. Using Google Street View to investigate the association between street greenery and physical activity. Landsc. Urban Plan. 2019, 191, 103435. [Google Scholar] [CrossRef]
- Zhang, F.; Zu, J.; Hu, M.; Zhu, D.; Kang, Y.; Gao, S.; Zhang, Y.; Huang, Z. Uncovering inconspicuous places using social media check-ins and street view images. Comput. Environ. Urban Syst. 2020, 81, 101478. [Google Scholar] [CrossRef]
- Wang, R.; Yuan, Y.; Liu, Y.; Zhang, J.; Liu, P.; Lu, Y.; Yao, Y. Using street view data and machine learning to assess how perception of neighborhood safety influences urban residents’ mental health. Health Place 2019, 59, 102186. [Google Scholar] [CrossRef] [PubMed]
- Zhou, H.; He, S.; Cai, Y.; Wang, M.; Su, S. Social inequalities in neighborhood visual walkability: Using street view imagery and deep learning technologies to facilitate healthy city planning. Sustain. Cities Soc. 2019, 50, 101605. [Google Scholar] [CrossRef]
- Larkin, A.; Gu, X.; Chen, L.; Hystad, P. Predicting perceptions of the built environment using GIS, satellite and street view image approaches. Landsc. Urban Plan. 2021, 216, 104257. [Google Scholar] [CrossRef] [PubMed]
- Yang, J.; Rong, H.; Kang, Y.; Zhang, F.; Chegut, A. The financial impact of street-level greenery on New York commercial buildings. Landsc. Urban Plan. 2021, 214, 104162. [Google Scholar] [CrossRef]
- Biau, G.; Scornet, E. A random forest guided tour. TEST 2016, 25, 197–227. [Google Scholar] [CrossRef] [Green Version]
- Ho, T.K. Random decision forests. In Proceedings of the 3rd International Conference on Document Analysis and Recognition, Montreal, QC, Canada, 14–16 August 1995; Volume 1, pp. 278–282. [Google Scholar] [CrossRef]
- Breiman, L. Random forests. Mach. Learn. 2001, 45, 5–32. [Google Scholar] [CrossRef] [Green Version]
- Li, X.; Li, L.; Wang, X.; Lin, Q.; Wu, D.; Dong, Y.; Han, S. Visual quality evaluation model of an urban river landscape based on random forest. Ecol. Indic. 2021, 133, 108381. [Google Scholar] [CrossRef]
- Yang, L.; Ao, Y.; Ke, J.; Lu, Y.; Liang, Y. To walk or not to walk? Examining non-linear effects of streetscape greenery on walking propensity of older adults. J. Transp. Geogr. 2021, 94, 103099. [Google Scholar] [CrossRef]
- Belgiu, M.; Drăguţ, L. Random Forest in remote sensing: A review of applications and future directions. ISPRS J. Photogramm. Remote Sens. 2016, 114, 24–31. [Google Scholar] [CrossRef]
- Belgiu, M.; Drăguţ, L. Comparing supervised and unsupervised multiresolution segmentation approaches for extracting buildings from very high-resolution imagery. ISPRS J. Photogramm. Remote Sens. 2014, 96, 67–75. [Google Scholar] [CrossRef] [PubMed] [Green Version]
- Pedregosa, F.; Varoquaux, G.; Gramfort, A.; Michel, V.; Thirion, B.; Grisel, O.; Blondel, M.; Prettenhofer, P.; Weiss, R.; Dubourg, V.; et al. Scikit-learn: Machine learning in Python. J. Mach. Learn. Res. 2011, 12, 2825–2830. [Google Scholar]
- Nembrini, S.; König, I.R.; Wright, M.N. The revival of the Gini importance? Bioinformatics 2018, 34, 3711–3718. [Google Scholar] [CrossRef] [PubMed] [Green Version]
- Cheng, L.; Chen, X.; De Vos, J.; Lai, X.; Witlox, F. Applying a random forest method approach to model travel mode choice behavior. Travel Behav. Soc. 2019, 14, 1–10. [Google Scholar] [CrossRef]
- Qiu, W.; Li, W.; Liu, X.; Huang, X. Subjectively Measured Streetscape Perceptions to Inform Urban Design Strategies for Shanghai. ISPRS Int. J. Geo-Inf. 2021, 10, 493. [Google Scholar] [CrossRef]
Figure 1.
Study area and the locations of 8 HPZs.

Figure 2.
Workflow of this study.

Figure 3.
Baidu heat map original (left) and vector heat map hierarchical display (right).

Figure 4.
An example of semantic segmentation processing of Baidu street view imagery (The Chinese term ”地图” means “map”).
Figure 4.
An example of semantic segmentation processing of Baidu street view imagery (The Chinese term ”地图” means “map”).

Figure 5.
Pearson correlation coefficient matrix and the bivariate scatter matrix.

Figure 6.
Feature importance for three models.

Table 1.
Multi-source data acquisition and indicator calculation framework.
| Class | Variable | Symbol | Data Source | Description |
|---|---|---|---|---|
| Response | Physical space vitality | PSV | Baidu | Fine-grained raster heat maps depicting timely crowd assembling. |
| Cyberspace vitality | CSV | Sina Weibo | The Check_in number of Weibo posts can represent the popularity of the HPZs. | |
| Sentiment degree | SENT | Sina Weibo | The content of Weibo texts containing the sentiment of people. | |
| Feature_ morphological indicators | Average of building height | H_M | Baidu | It is acknowledged that urban morphology influences the popularity of HPZs in some way, based on Jacobs’ theory. Morphology related indicators are calculated in the Geographic Information System. |
| Standard deviation of building height | H_SD | Baidu | ||
| Building density | BD | Baidu | ||
| Floor Area Ratio | FAR | Baidu | ||
| Feature_ functional indicators | Number of hotels | P_H | Baidu | The distribution of functional facilities is important in evaluating the current use of HPZs, and they greatly affect the vitality. Baidu POI data were collected to build possible influencing factors. |
| Number of places of entertainment | P_E | Baidu | ||
| Number of tourist attractions | P_A | Baidu | ||
| Number of stores and shopping malls | P_S | Baidu | ||
| Number of infrastructures | P_I | Baidu | ||
| Number of catering | P_C | Baidu | ||
| Number of education facilities | P_EF | Baidu | ||
| Feature_ traffic indicators | Walking accessibility | ACC | Baidu | Road traffic features may be related to regional vitality and population satisfaction. |
| Street length | SL | Baidu | ||
| Intersection density | ID | Baidu | ||
| Feature_ visual indicators | Green Looking Ratio | R_GL | Baidu | The physical environment in the street will affect people’s visual perception and then affect vitality. These indicators were calculated using the Deeplab v3+ deep learning network to semantically segregate Baidu street view images. |
| Sky View Ratio | R_SV | Baidu | ||
| Road Ratio | R_R | Baidu | ||
| Bicyclist Ratio | R_BI | Baidu | ||
| Building Ratio | R_BU | Baidu | ||
| Pavement Ratio | R_P | Baidu | ||
| Sign Ratio | R_S | Baidu | ||
| Car Ratio | R_C | Baidu | ||
| Pedestrian Ratio | R_PE | Baidu |
Table 2.
Sample results of sentiment classification of microblog data (translated from Chinese).
| HCAs | Sample Data of Weibo Content (in Chinese, Translated by Authors, Accessed on 19 June 2022) | Output Value | Sentiment Class |
|---|---|---|---|
| Shichahai | In the novel I like, the man and woman have a date in Shichahai, so there is a lot of romantic imagination. Although I didn’t see the uncle pulling the rickshaw in the story, the old man who told the story on the roadside is also very interesting. | 0.96 | Positive sample |
| South Luogu Lane | Finally arrived in South Luogu Lane, Zhang’s Sichuan cuisine is affordable and delicious, and the hall is packed; the first bite of Wenyu cheese is amazing, but eating more will make you tired; the boy in the bar sings very well. | 0.98 | Positive sample |
| Jingshan | Couldn’t find the way up the mountain. The people behind me accidentally ironed three holes in my new clothes when dropping his cigarette ashes. I was almost in tears, and I didn’t get a single apology. I went to Jingshan to see the sunset. It was a fine sunny day. But, in the afternoon, it suddenly began to rain. I’m so tired. | 0.05 | Negative sample |
| Donghuamen Street | From Donghuamen to Beihai, the streets are full of motor vehicles that occupy the road illegally, resulting in a main road becoming a parking lot.There are many cars waiting for passengers. These private cars do not follow the rules to make money, causing congestion, so the road traffic in Beijing is getting more and more chaotic! How can road managers turn a blind eye to this? | 0.29 | Negative sample |
| Xi Si | Where is the oldest hutong in Beijing? Many people who live in the east and west of the city will say “Brick Tower Hutong”. When you walk into this old hutong on Xisi South Street, you can clearly see the gates of each courtyard, and in each courtyard, you can hear the chatter and greetings of neighbors, attracting curious young people and foreign tourists. | 0.81 | Positive sample |
Table 3.
Information of four morphological indicators.
| Morphological Indicators | Acronyms | Unit | Equation |
|---|---|---|---|
| Average of building height | m | ||
| Standard deviation of building height | m | ||
| Building density | % | ||
| Floor area ratio |
Table 4.
Performance of 3 models (test set).
| MODEL_NAME | R2 | RMSE | MAE |
|---|---|---|---|
| 1_physical space vitality (PSV) | 0.86 | 0.37 | 0.28 |
| 2_sentiment degree (SENT) | 0.85 | 0.43 | 0.21 |
| 3_cyber space vitality (CSV) | 0.76 | 0.49 | 0.36 |
Publisher’s Note: MDPI stays neutral with regard to jurisdictional claims in published maps and institutional affiliations. |
© 2022 by the authors. Licensee MDPI, Basel, Switzerland. This article is an open access article distributed under the terms and conditions of the Creative Commons Attribution (CC BY) license (https://creativecommons.org/licenses/by/4.0/).
Share and Cite
MDPI and ACS Style
Huang, X.; Gong, P.; Wang, S.; White, M.; Zhang, B. Machine Learning Modeling of Vitality Characteristics in Historical Preservation Zones with Multi-Source Data. Buildings 2022, 12, 1978. https://doi.org/10.3390/buildings12111978
AMA Style
Huang X, Gong P, Wang S, White M, Zhang B. Machine Learning Modeling of Vitality Characteristics in Historical Preservation Zones with Multi-Source Data. Buildings. 2022; 12(11):1978. https://doi.org/10.3390/buildings12111978
Chicago/Turabian StyleHuang, Xiaoran, Pixin Gong, Siyan Wang, Marcus White, and Bo Zhang. 2022. "Machine Learning Modeling of Vitality Characteristics in Historical Preservation Zones with Multi-Source Data" Buildings 12, no. 11: 1978. https://doi.org/10.3390/buildings12111978
Note that from the first issue of 2016, this journal uses article numbers instead of page numbers. See further details here.