Nondestructive Determination and Visualization of Quality Attributes in Fresh and Dry Chrysanthemum morifolium Using Near-Infrared Hyperspectral Imaging

 and
and
Abstract
:1. Introduction
2. Materials and Methods
2.1. Sample Preparation
2.2. Hyperspectral Image Acquisition
2.2.1. Hyperspectral Imaging System
2.2.2. Spectra Extraction and Preprocessing
2.3. Chemical Compositions Measurement
2.3.1. Sample Preparation
2.3.2. Preparation of the Standard Solution
2.3.3. HPLC Operating Conditions
2.3.4. Method Validation and Quantitative Analysis
2.4. Multivariate Analysis
2.4.1. Calibration Models
PLS
ELM
LS-SVM
2.4.2. Optimal Wavelength Selection
- (1)
- Manually define range of the number of variables to be selected.
- (2)
- Randomly select a variable and calculate the projection of this variable on the other variables.
- (3)
- Select the variable with the largest projections into the candidate subset, then the corresponding variable for projection is used for projecting on the residual variables.
- (4)
- Repeat steps (2) and (3) until the number of variables in the candidate subset is equal to the maximum number.
- (5)
- Build multiple linear regression (MLR) models using different numbers of variables in the subset, and the variables corresponding to the model with the minimum RMSE are selected as optimal variables.
2.4.3. Model Evaluation and Software
2.5. Visualization of Chemical Compositions
3. Results and Discussion
3.1. Spectral Profiles
3.2. Outlier Detection and Sample Set Split
3.3. Calibration Models Using Full Spectra
3.4. Optimal Wavelength Selection
3.5. Calibration Models Using Optimal Wavelengths
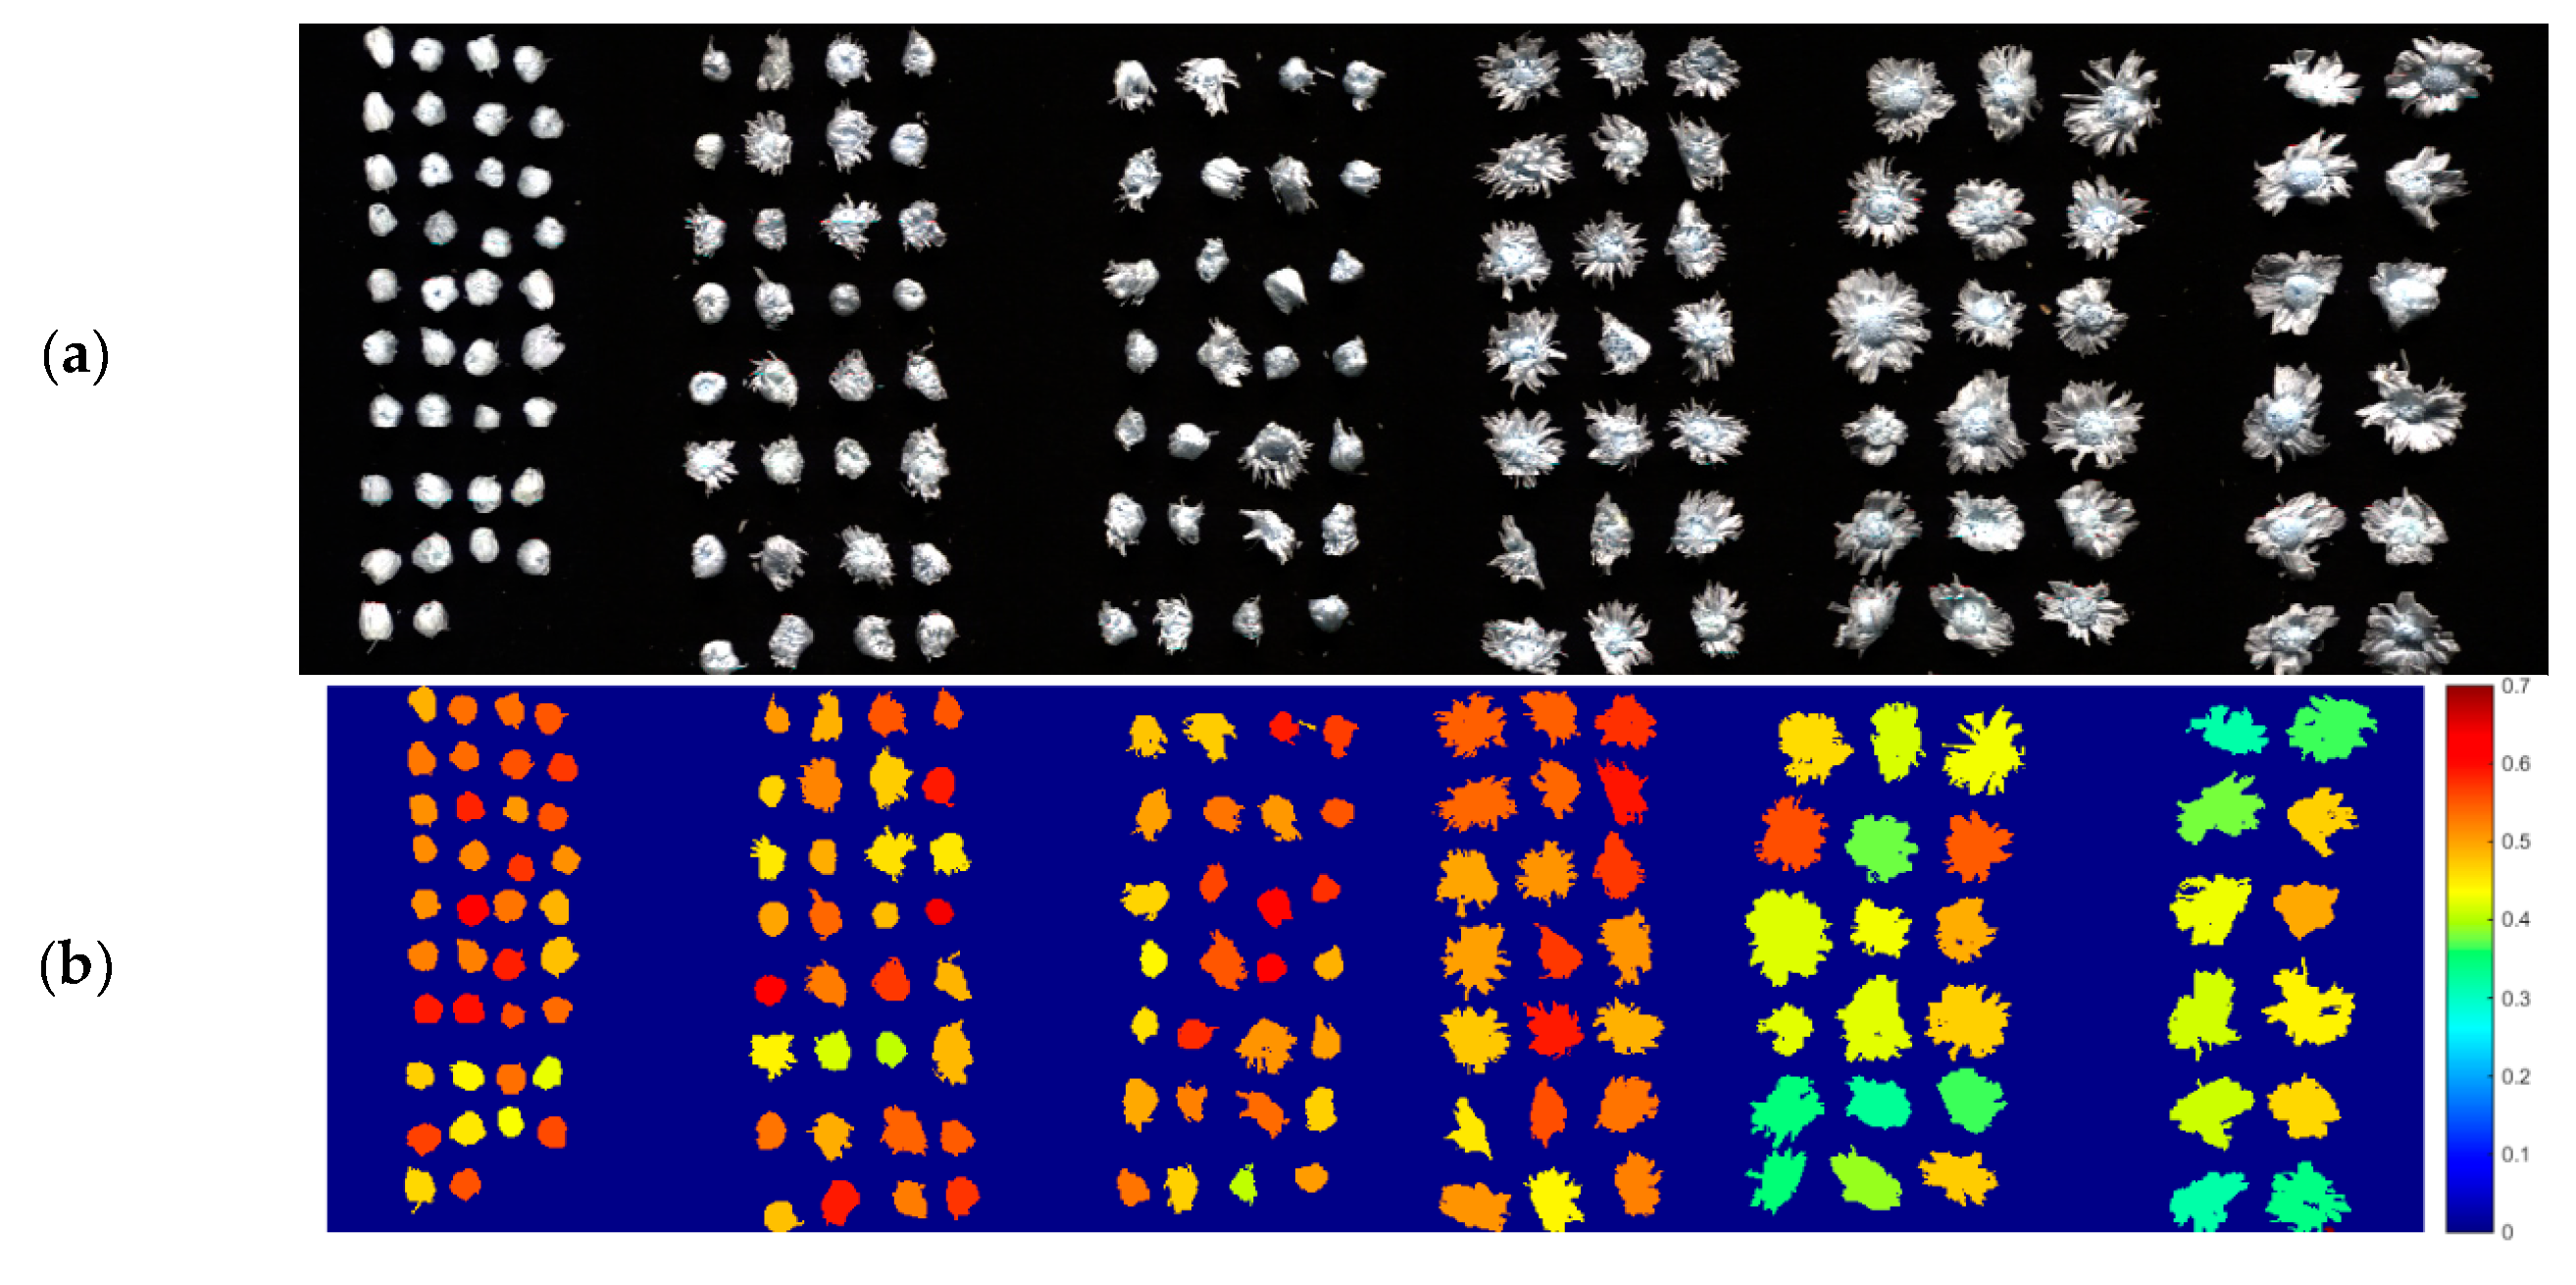
3.6. Visualization of Chlorogenic Acid, Luteolin-7-O-glucoside, and 3,5-O-Dicaffeoylquinic Acid in Chrysanthemum morifolium
4. Conclusions
Author Contributions
Funding
Acknowledgments
Conflicts of Interest
References
- Kaneko, S.; Chen, J.; Wu, J.; Suzuki, Y.; Ma, L.; Kumazawa, K. Potent Odorants of Characteristic Floral/Sweet Odor in Chinese Chrysanthemum Flower Tea Infusion. J. Agric. Food Chem. 2017, 65, 10058–10063. [Google Scholar] [CrossRef] [PubMed]
- Mubarak, A.; Bondonno, C.P.; Liu, A.H.; Considine, M.J.; Rich, L.; Mas, E.; Croft, K.D.; Hodgson, J.M. Acute effects of chlorogenic acid on nitric oxide status, endothelial function, and blood pressure in healthy volunteers: A randomized trial. J. Agric. Food Chem. 2012, 60, 9130–9136. [Google Scholar] [CrossRef] [PubMed]
- Kwon, Y. Luteolin-7-O-glucoside as a potential preventive and therapeutic candidate for Alzheimer’s disease. Exp. Gerontol. 2017, 95, 39–43. [Google Scholar] [CrossRef] [PubMed]
- D’Antuono, I.; Carola, A.; Sena, L.M.; Linsalata, V.; Cardinali, A.; Logrieco, A.F.; Colucci, M.G.; Apone, F. Artichoke Polyphenols Produce Skin Anti-Age Effects by Improving Endothelial Cell Integrity and Functionality. Molecules 2018, 23, 2729. [Google Scholar] [CrossRef] [PubMed]
- Commission, C.P. Chinese Pharmacopoeia; China Medical Science Press: Beijing, China, 2015. [Google Scholar]
- Zhang, C.; Jiang, H.; Liu, F.; He, Y. Application of Near-Infrared Hyperspectral Imaging with Variable Selection Methods to Determine and Visualize Caffeine Content of Coffee Beans. Food Bioprocess Technol. 2017, 10, 213–221. [Google Scholar] [CrossRef]
- Fan, S.; Li, J.; Xia, Y.; Tian, X.; Guo, Z.; Huang, W. Long-term evaluation of soluble solids content of apples with biological variability by using near-infrared spectroscopy and calibration transfer method. Postharvest Biol. Technol. 2019, 151, 79–87. [Google Scholar] [CrossRef]
- Zhang, C.; Liu, F.; Kong, W.; Cui, P.; He, Y.; Zhou, W. Estimation and Visualization of Soluble Sugar Content in Oilseed Rape Leaves Using Hyperspectral Imaging. Trans. ASABE 2016, 59, 1499–1505. [Google Scholar]
- Malmir, M.; Tahmasbian, I.; Xu, Z.; Farrar, M.B.; Bai, S.H. Prediction of soil macro- and micro-elements in sieved and ground air-dried soils using laboratory-based hyperspectral imaging technique. Geoderma 2019, 340, 70–80. [Google Scholar] [CrossRef]
- Ortega, S.; Fabelo, H.; Iakovidis, D.K.; Koulaouzidis, A.; Callico, G.M. Use of Hyperspectral/Multispectral Imaging in Gastroenterology. Shedding Some-Different-Light into the Dark. J. Clin. Med. 2019, 8, 36. [Google Scholar] [CrossRef] [PubMed]
- Sicher, C.; Rutkowski, R.; Lutze, S.; von Podewils, S.; Wild, T.; Kretching, M.; Daeschlein, G. Hyperspectral imaging as a possible tool for visualization of changes in hemoglobin oxygenation in patients with deficient hemodynamics—Proof of concept. Biomed. Eng./Biomed. Tech. 2018, 63, 609–616. [Google Scholar] [CrossRef] [PubMed]
- Zhang, C.; Liu, F.; He, Y. Identification of coffee bean varieties using hyperspectral imaging: Influence of preprocessing methods and pixel-wise spectra analysis. Sci. Rep. 2018, 8, 2166. [Google Scholar] [CrossRef] [PubMed]
- Lara, M.A.; Lleó, L.; Diezma-Iglesias, B.; Roger, J.M.; Ruiz-Altisent, M. Monitoring spinach shelf-life with hyperspectral image through packaging films. J. Food Eng. 2013, 119, 353–361. [Google Scholar] [CrossRef] [Green Version]
- He, J.; Chen, L.; Chu, B.; Zhang, C. Determination of Total Polysaccharides and Total Flavonoids in Chrysanthemum morifolium Using Near-Infrared Hyperspectral Imaging and Multivariate Analysis. Molecules 2018, 23, 2395. [Google Scholar] [CrossRef] [PubMed]
- Geladi, P.; Kowalski, B.R.J.A.C.A. Partial least-squares regression: A tutorial. Anal. Chim. Acta 1985, 185, 1–17. [Google Scholar] [CrossRef]
- Huang, G.-B.; Zhu, Q.-Y.; Siew, C.-K. Extreme learning machine: Theory and applications. Neurocomputing 2006, 70, 489–501. [Google Scholar] [CrossRef] [Green Version]
- Zhang, C.; Xu, N.; Luo, L.; Liu, F.; Kong, W.; Feng, L.; He, Y. Detection of Aspartic Acid in Fermented Cordyceps Powder Using Near Infrared Spectroscopy Based on Variable Selection Algorithms and Multivariate Calibration Methods. Food Bioprocess Technol. 2013, 7, 598–604. [Google Scholar] [CrossRef]
- Araújo, M.C.U.; Saldanha, T.C.B.; Galvão, R.K.H.; Yoneyama, T.; Chame, H.C.; Visani, V. The successive projections algorithm for variable selection in spectroscopic multicomponent analysis. Chemom. Intell. Lab. Syst. 2001, 57, 65–73. [Google Scholar] [CrossRef]
- Zornoza, R.; Guerrero, C.; Mataix-Solera, J.; Scow, K.M.; Arcenegui, V.; Mataix-Beneyto, J. Near infrared spectroscopy for determination of various physical, chemical and biochemical properties in Mediterranean soils. Soil Biol. Biochem. 2008, 40, 1923–1930. [Google Scholar] [CrossRef] [PubMed] [Green Version]
- He, Y.; Zhao, Y.; Zhang, C.; Sun, C.; Li, X. Determination of ß-Carotene and Lutein in Green Tea Using Fourier Transform Infrared Spectroscopy. Trans. ASABE 2019, 62, 75–81. [Google Scholar] [CrossRef]
- Jerry, W.; Lois, W. Practical Guide to Interpretive Near-Infrared Spectroscopy; CRC Press, Inc.: Boca Raton, FL, USA, 2007. [Google Scholar]
- Frank, W.; Angela, S.; Martin, K. Incorporating Chemical Band-Assignment in near Infrared Spectroscopy Regression Models. J. Near Infrared Spectrosc. 2008, 1, 265–273. [Google Scholar]


| Sample Status | Compositions | Calibration | Prediction | ||||
|---|---|---|---|---|---|---|---|
| Range | Mean | SD | Range | Mean | SD a | ||
| Fresh | chlorogenic acid | 0.33–0.59 | 0.48 | 0.067 | 0.34–0.58 | 0.48 | 0.067 |
| luteolin-7-O-glucoside | 0.21–0.42 | 0.32 | 0.046 | 0.22–0.40 | 0.32 | 0.046 | |
| 3,5-O-dicaffeoylquinic acid | 0.79–1.29 | 1.07 | 0.13 | 0.81–1.29 | 1.07 | 0.13 | |
| Dry | chlorogenic acid | 0.33–0.61 | 0.48 | 0.067 | 0.34–0.60 | 0.48 | 0.067 |
| luteolin-7-O-glucoside | 0.22–0.42 | 0.33 | 0.046 | 0.23–0.41 | 0.33 | 0.046 | |
| 3,5-O-dicaffeoylquinic acid | 0.79–1.29 | 1.07 | 0.13 | 0.79–1.27 | 1.07 | 0.13 | |
| Compositions | Models | Parameters a | Calibration | Prediction | |||||
|---|---|---|---|---|---|---|---|---|---|
| R2c | RMSEC | Biasc | R2p | RMSEP | RPD | Biasp | |||
| chlorogenic acid | PLS | 8 | 0.90 ** | 0.021 | 1.04 × 10⁻⁷ | 0.87 ** | 0.024 | 2.79 | 0.0024 |
| ELM | 19 | 0.91 ** | 0.020 | 3.03 × 10⁻¹⁰ | 0.88 ** | 0.023 | 2.91 | 1.54 × 10⁻⁴ | |
| LS-SVM | 38.7638, 184.1695 | 0.91 ** | 0.020 | −8.10 × 10⁻¹⁶ | 0.87 ** | 0.024 | 2.79 | 2.58 × 10⁻⁴ | |
| luteolin-7-O-glucoside | PLS | 7 | 0.82 ** | 0.020 | 2.63 × 10⁻⁷ | 0.82 ** | 0.019 | 2.42 | 4.69 × 10⁻⁴ |
| ELM | 22 | 0.86 ** | 0.018 | 6.71 × 10⁻¹² | 0.82 ** | 0.019 | 2.42 | 0.0017 | |
| LS-SVM | 13.19329, 165.0049 | 0.84 ** | 0.019 | 2.88 × 10⁻¹⁶ | 0.79 ** | 0.021 | 2.19 | −0.0039 | |
| 3,5-O-dicaffeoylquinic acid | PLS | 8 | 0.85 ** | 0.049 | −2.41 × 10⁻⁷ | 0.81 ** | 0.058 | 2.24 | 0.00057 |
| ELM | 22 | 0.87 ** | 0.047 | −1.89 × 10⁻¹⁰ | 0.82 ** | 0.057 | 2.28 | 0.0084 | |
| LS-SVM | 1,063,548.01366, 29,309.77831 | 0.86 ** | 0.048 | 1.23 × 10⁻¹¹ | 0.82 ** | 0.056 | 2.32 | 0.0016 | |
| Compositions | Models | Parameters | Calibration | Prediction | |||||
|---|---|---|---|---|---|---|---|---|---|
| R2c | RMSEC | Biasc | R2p | RMSEP | RPD | Biasp | |||
| chlorogenic acid | PLS | 9 | 0.89 ** | 0.022 | −2.25 × 10⁻⁷ | 0.85 ** | 0.026 | 2.58 | 0.0027 |
| ELM | 17 | 0.90 ** | 0.022 | 1.79 × 10⁻⁹ | 0.86 ** | 0.025 | 2.68 | 8.47 × 10⁻⁴ | |
| LS-SVM | 144.6281, 201.9949 | 0.93 ** | 0.018 | 6.80 × 10⁻¹⁵ | 0.83 ** | 0.029 | 2.31 | 0.0049 | |
| luteolin-7-O-glucoside | PLS | 7 | 0.82 ** | 0.019 | 1.35 × 10⁻⁷ | 0.77 ** | 0.022 | 2.09 | 0.0046 |
| ELM | 31 | 0.86 ** | 0.017 | 5.32 × 10⁻¹⁰ | 0.81 ** | 0.020 | 2.30 | 0.0037 | |
| LS-SVM | 2783.4589, 2382.1537 | 0.85 ** | 0.018 | −3.21 × 10⁻¹³ | 0.77 ** | 0.023 | 2.00 | 0.0056 | |
| 3,5-O-dicaffeoylquinic acid | PLS | 9 | 0.84 ** | 0.050 | 1.66 × 10⁻⁷ | 0.83 ** | 0.054 | 2.41 | −0.0017 |
| ELM | 23 | 0.85 ** | 0.050 | −1.62 × 10⁻⁹ | 0.83 ** | 0.053 | 2.45 | −2.07 × 10⁻⁴ | |
| LS-SVM | 49,789.1255, 9996.34004 | 0.86 ** | 0.049 | 2.02 × 10⁻¹¹ | 0.83 ** | 0.055 | 2.36 | 7.07 × 10⁻⁴ | |
| Sample Status | Compositions | Number | Wavelength (nm) |
|---|---|---|---|
| Fresh | chlorogenic acid | 8 | 1463, 1082, 1419, 1615, 1399, 1005, 1164, 1325 |
| luteolin-7-O-glucoside | 7 | 1025, 1082, 992, 1429, 1646, 1281, 1406 | |
| 3,5-O-dicaffeoylquinic acid | 8 | 1046, 1126, 1005, 1436, 1615, 975, 1164, 1288 | |
| Dry | chlorogenic acid | 8 | 1470, 1076, 1419, 1315, 988, 1396, 1227, 1646 |
| luteolin-7-O-glucoside | 5 | 1072, 1612, 1419, 1318, 1646 | |
| 3,5-O-dicaffeoylquinic acid | 10 | 1126, 1180, 1029, 1210, 1227, 1463, 975, 995, 1646, 1389 |
| Compositions | Models | Parameters | Calibration | Prediction | |||||
|---|---|---|---|---|---|---|---|---|---|
| R2c | RMSEC | Biasc | R2p | RMSEP | RPD | Biasp | |||
| chlorogenic acid | PLS | 7 | 0.90 ** | 0.021 | 1.87 × 10⁻⁶ | 0.88 ** | 0.023 | 2.91 | 0.0018 |
| ELM | 10 | 0.91 ** | 0.020 | −6.50 × 10⁻¹⁰ | 0.87 ** | 0.024 | 2.79 | 0.0023 | |
| LS-SVM | 8.6896, 6.2569 | 0.91 ** | 0.020 | 2.80 × 10⁻¹⁶ | 0.87 ** | 0.024 | 2.79 | −8.77 × 10⁻⁵ | |
| luteolin-7-O-glucoside | PLS | 7 | 0.83 ** | 0.019 | 2.61 × 10⁻⁶ | 0.80 ** | 0.020 | 2.3 | 0.0012 |
| ELM | 18 | 0.85 ** | 0.018 | −9.42 × 10⁻⁷ | 0.82 ** | 0.019 | 2.42 | −0.0014 | |
| LS-SVM | 4.9733, 0.50549 | 0.87 ** | 0.017 | −1.18 × 10⁻¹⁶ | 0.81 ** | 0.020 | 2.3 | −0.0019 | |
| 3,5-O-dicaffeoylquinic acid | PLS | 7 | 0.84 ** | 0.051 | −4.57 × 10⁻⁷ | 0.80 ** | 0.062 | 2.10 | 0.0039 |
| ELM | 19 | 0.87 ** | 0.047 | −2.11 × 10⁻⁶ | 0.83 ** | 0.055 | 2.36 | 0.0016 | |
| LS-SVM | 3,119,660.6357, 1108.4923983 | 0.86 ** | 0.048 | 6.35 × 10⁻¹⁰ | 0.81 ** | 0.059 | 2.20 | 0.0035 | |
| Compositions | Models | Parameters | Calibration | Prediction | |||||
|---|---|---|---|---|---|---|---|---|---|
| R2c | RMSEC | Biasc | R2p | RMSEP | RPD | Biasp | |||
| chlorogenic acid | PLS | 8 | 0.89 ** | 0.022 | −7.10 × 10⁻⁷ | 0.84 ** | 0.027 | 2.48 | 0.0032 |
| ELM | 39 | 0.93 ** | 0.018 | −4.77 × 10⁻⁶ | 0.87 ** | 0.025 | 2.68 | 0.0042 | |
| LS-SVM | 146.7564, 9.64007 | 0.92 ** | 0.018 | 1.27 × 10⁻¹⁴ | 0.81 ** | 0.030 | 2.23 | 0.0050 | |
| luteolin-7-O-glucoside | PLS | 5 | 0.78 ** | 0.021 | 2.30 × 10⁻⁷ | 0.68 ** | 0.026 | 1.77 | 0.0030 |
| ELM | 18 | 0.83 ** | 0.019 | 1.65 × 10⁻⁶ | 0.78 ** | 0.022 | 2.09 | 0.0041 | |
| LS-SVM | 16.9896, 0.39888 | 0.90 ** | 0.014 | −1.28 × 10⁻¹⁶ | 0.68 ** | 0.026 | 1.77 | 0.0020 | |
| 3,5-O-dicaffeoylquinic acid | PLS | 8 | 0.84 ** | 0.051 | −3.02 × 10⁻⁶ | 0.83 ** | 0.054 | 2.41 | −0.0050 |
| ELM | 20 | 0.85 ** | 0.049 | −1.45 × 10⁻⁶ | 0.83 ** | 0.054 | 2.41 | −0.0013 | |
| LS-SVM | 2,163,016.0391, 32,811.479235 | 0.84 ** | 0.050 | −7.30 × 10⁻¹⁰ | 0.84 ** | 0.054 | 2.41 | −0.0025 | |
© 2019 by the authors. Licensee MDPI, Basel, Switzerland. This article is an open access article distributed under the terms and conditions of the Creative Commons Attribution (CC BY) license (http://creativecommons.org/licenses/by/4.0/).
Share and Cite
He, J.; Zhu, S.; Chu, B.; Bai, X.; Xiao, Q.; Zhang, C.; Gong, J. Nondestructive Determination and Visualization of Quality Attributes in Fresh and Dry Chrysanthemum morifolium Using Near-Infrared Hyperspectral Imaging. Appl. Sci. 2019, 9, 1959. https://doi.org/10.3390/app9091959
He J, Zhu S, Chu B, Bai X, Xiao Q, Zhang C, Gong J. Nondestructive Determination and Visualization of Quality Attributes in Fresh and Dry Chrysanthemum morifolium Using Near-Infrared Hyperspectral Imaging. Applied Sciences. 2019; 9(9):1959. https://doi.org/10.3390/app9091959
Chicago/Turabian StyleHe, Juan, Susu Zhu, Bingquan Chu, Xiulin Bai, Qinlin Xiao, Chu Zhang, and Jinyan Gong. 2019. "Nondestructive Determination and Visualization of Quality Attributes in Fresh and Dry Chrysanthemum morifolium Using Near-Infrared Hyperspectral Imaging" Applied Sciences 9, no. 9: 1959. https://doi.org/10.3390/app9091959