Performance Efficiency Measurement Model Development of a Technology Transfer Office (TTO) to Accelerate Technology Commercialization in Universities


Abstract
:1. Introduction
2. Methods
2.1. Operationalization Variables
2.2. Questionnaire Testing
- a.
- Validity Test
- b.
- Reliability Test
2.3. Decision Making Unit Selection
2.4. DEA Model Selection
- n: DMU, n = 1, 2, …, N;
- i: Input, i = 1, 2, …, I;
- j: Output, j = 1, 2, …, J;
- yjn: output value to-j from DMU to-n;
- xin: output value to-i from DMU to-n;
- vjm: input value to-j from DMU to-n;
- yjn: input value to-i from DMU to-n;
- ε: small positive number.
2.5. DEA with Likert Scale Data
3. Results
3.1. Designing the TTO Performance Efficiency Measurement Model in the Incubation Process
- (a)
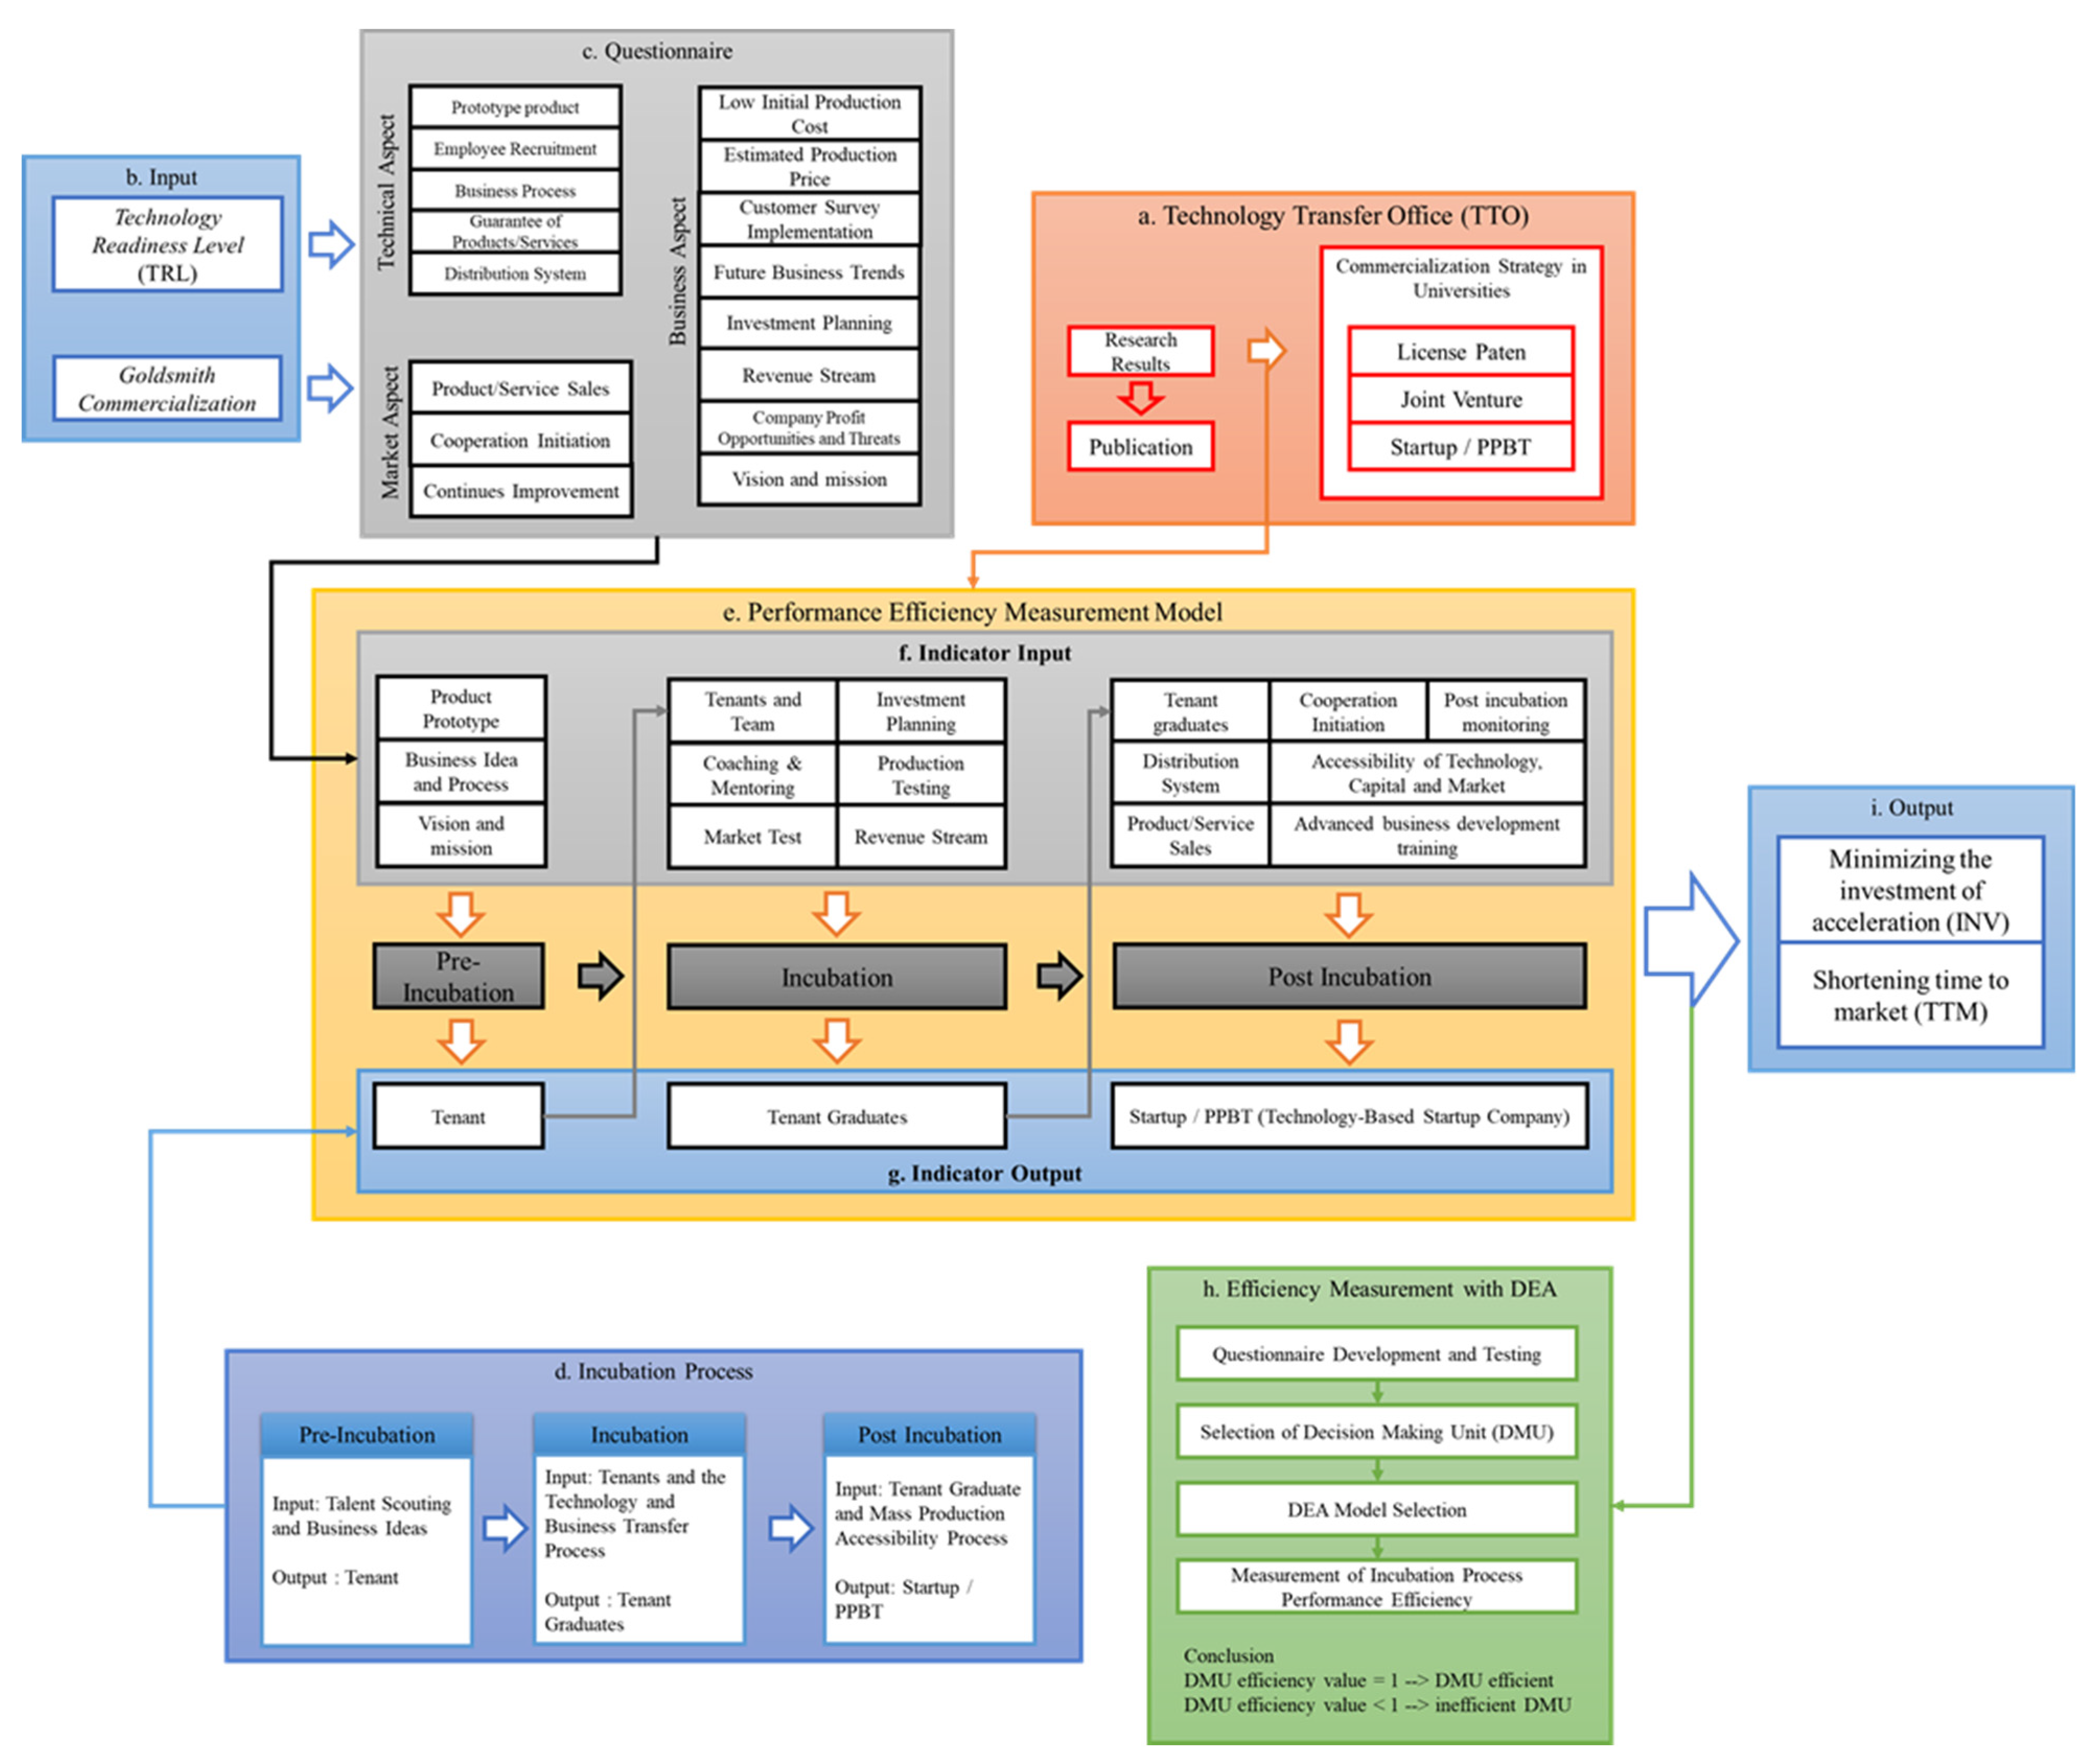
- Technology Transfer Office (TTO): The role of the technology transfer service unit/TTO in the technology transfer process is very decisive. TTO has a function as a bridge for innovation/research results to be commercialized. However, in addition to commercializing the research results, it can also be published, where the publication results can also be commercialized by registering copyright based on new findings or methods.
- (b)
- Input: The input, in this case, is a framework or measurement framework to assess whether a research/innovation result is feasible or not to be commercialized. Generally, what is used as feasibility in the commercialization process is the measurement of TRL (Technology Readiness Level). However, this model is integrated with the goldsmith commercialization model to create a new framework.
- (c)
- Questionnaire: The questionnaire was built based on inputs, namely, the TRL measurement framework and the goldsmith commercialization model. The limitations studied include the product launch process and product success as a business. This questionnaire consists of three inputs, namely, technical aspects, market aspects, and business aspects.
- (d)
- Incubation process: The incubation process generally consists of three stages of the process, namely, the pre-incubation process, the incubation process, and the post-incubation process. The three stages of this process have their respective inputs and outputs. The input, in this case, is the activity or entity needed to carry out the process. In contrast, the output, in this case, is the result that is expected to be achieved.
- (e)
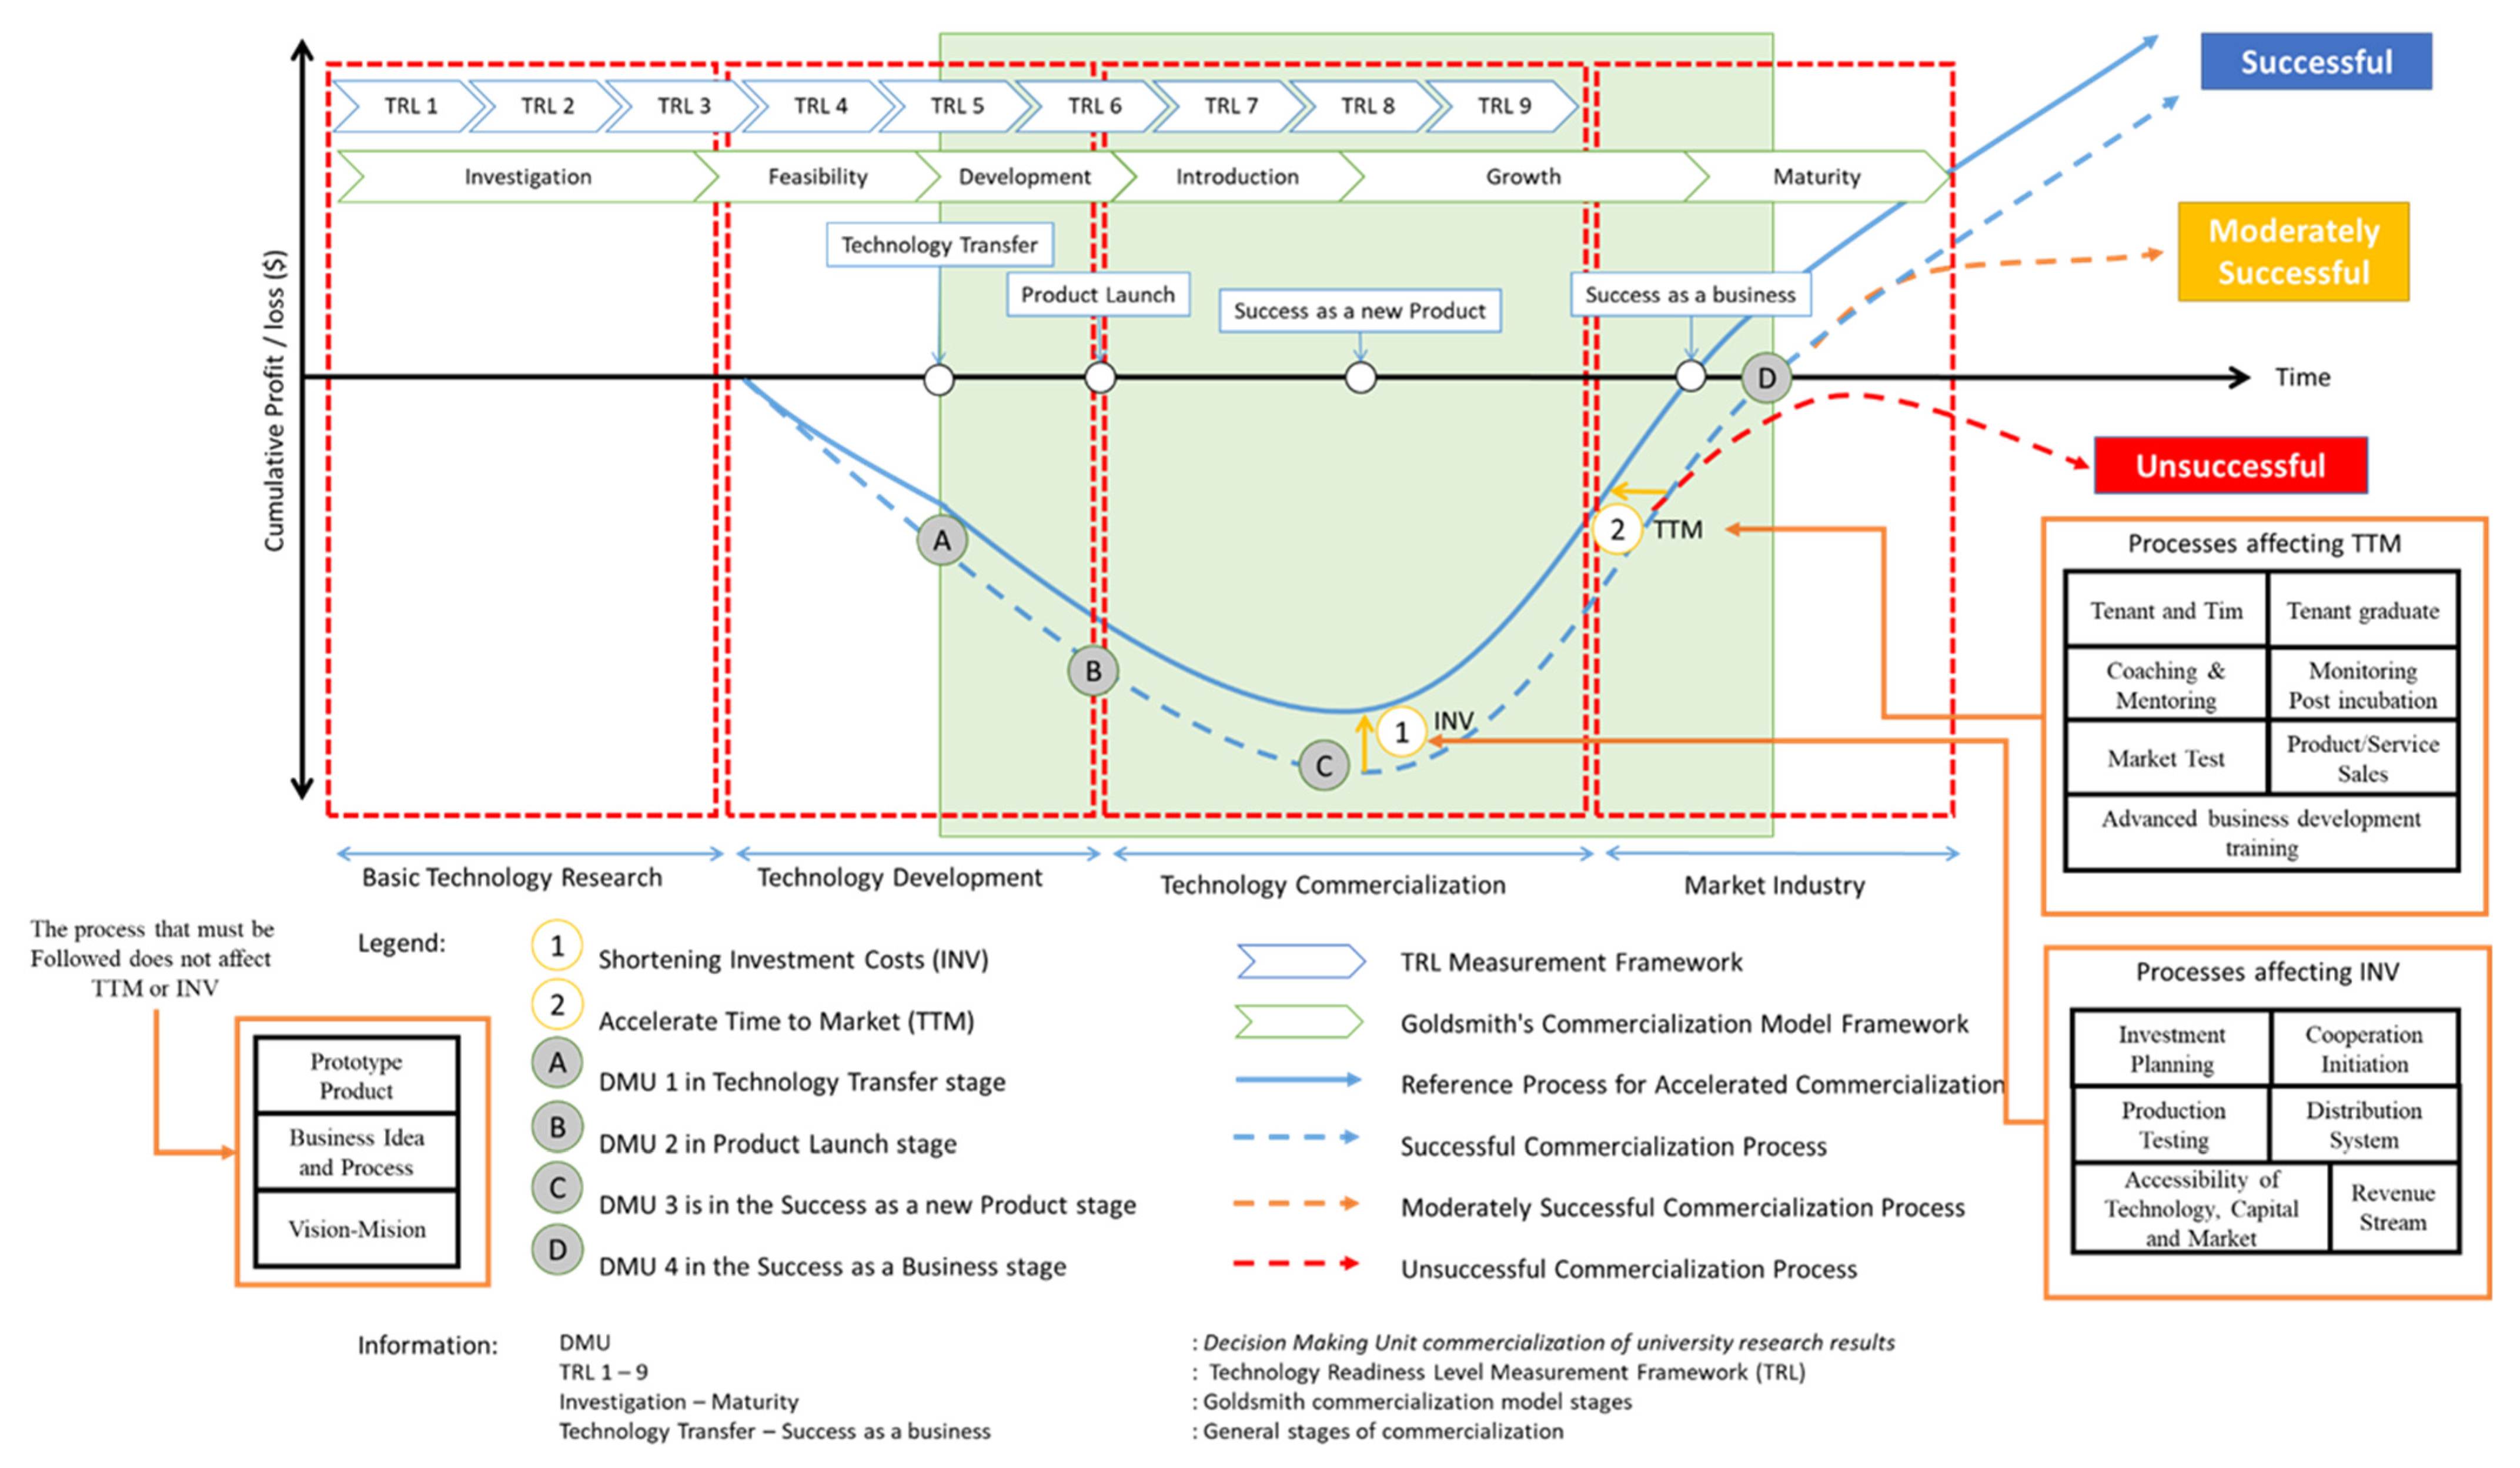
- Performance efficiency measurement model: The TTO performance efficiency measurement model consists of three interconnected stages. These three stages look at the main processes carried out to accelerate the commercialization of technology. In this case, the main process carried out by a TTO is the incubation process. A technology transfer office (TTO) can also be referred to as a business incubator in a university. However, the technology transfer process is not limited to the business incubation process, but the incubation process becomes an important part and becomes the main thing so that research/innovation results are commercialized.
- (f)
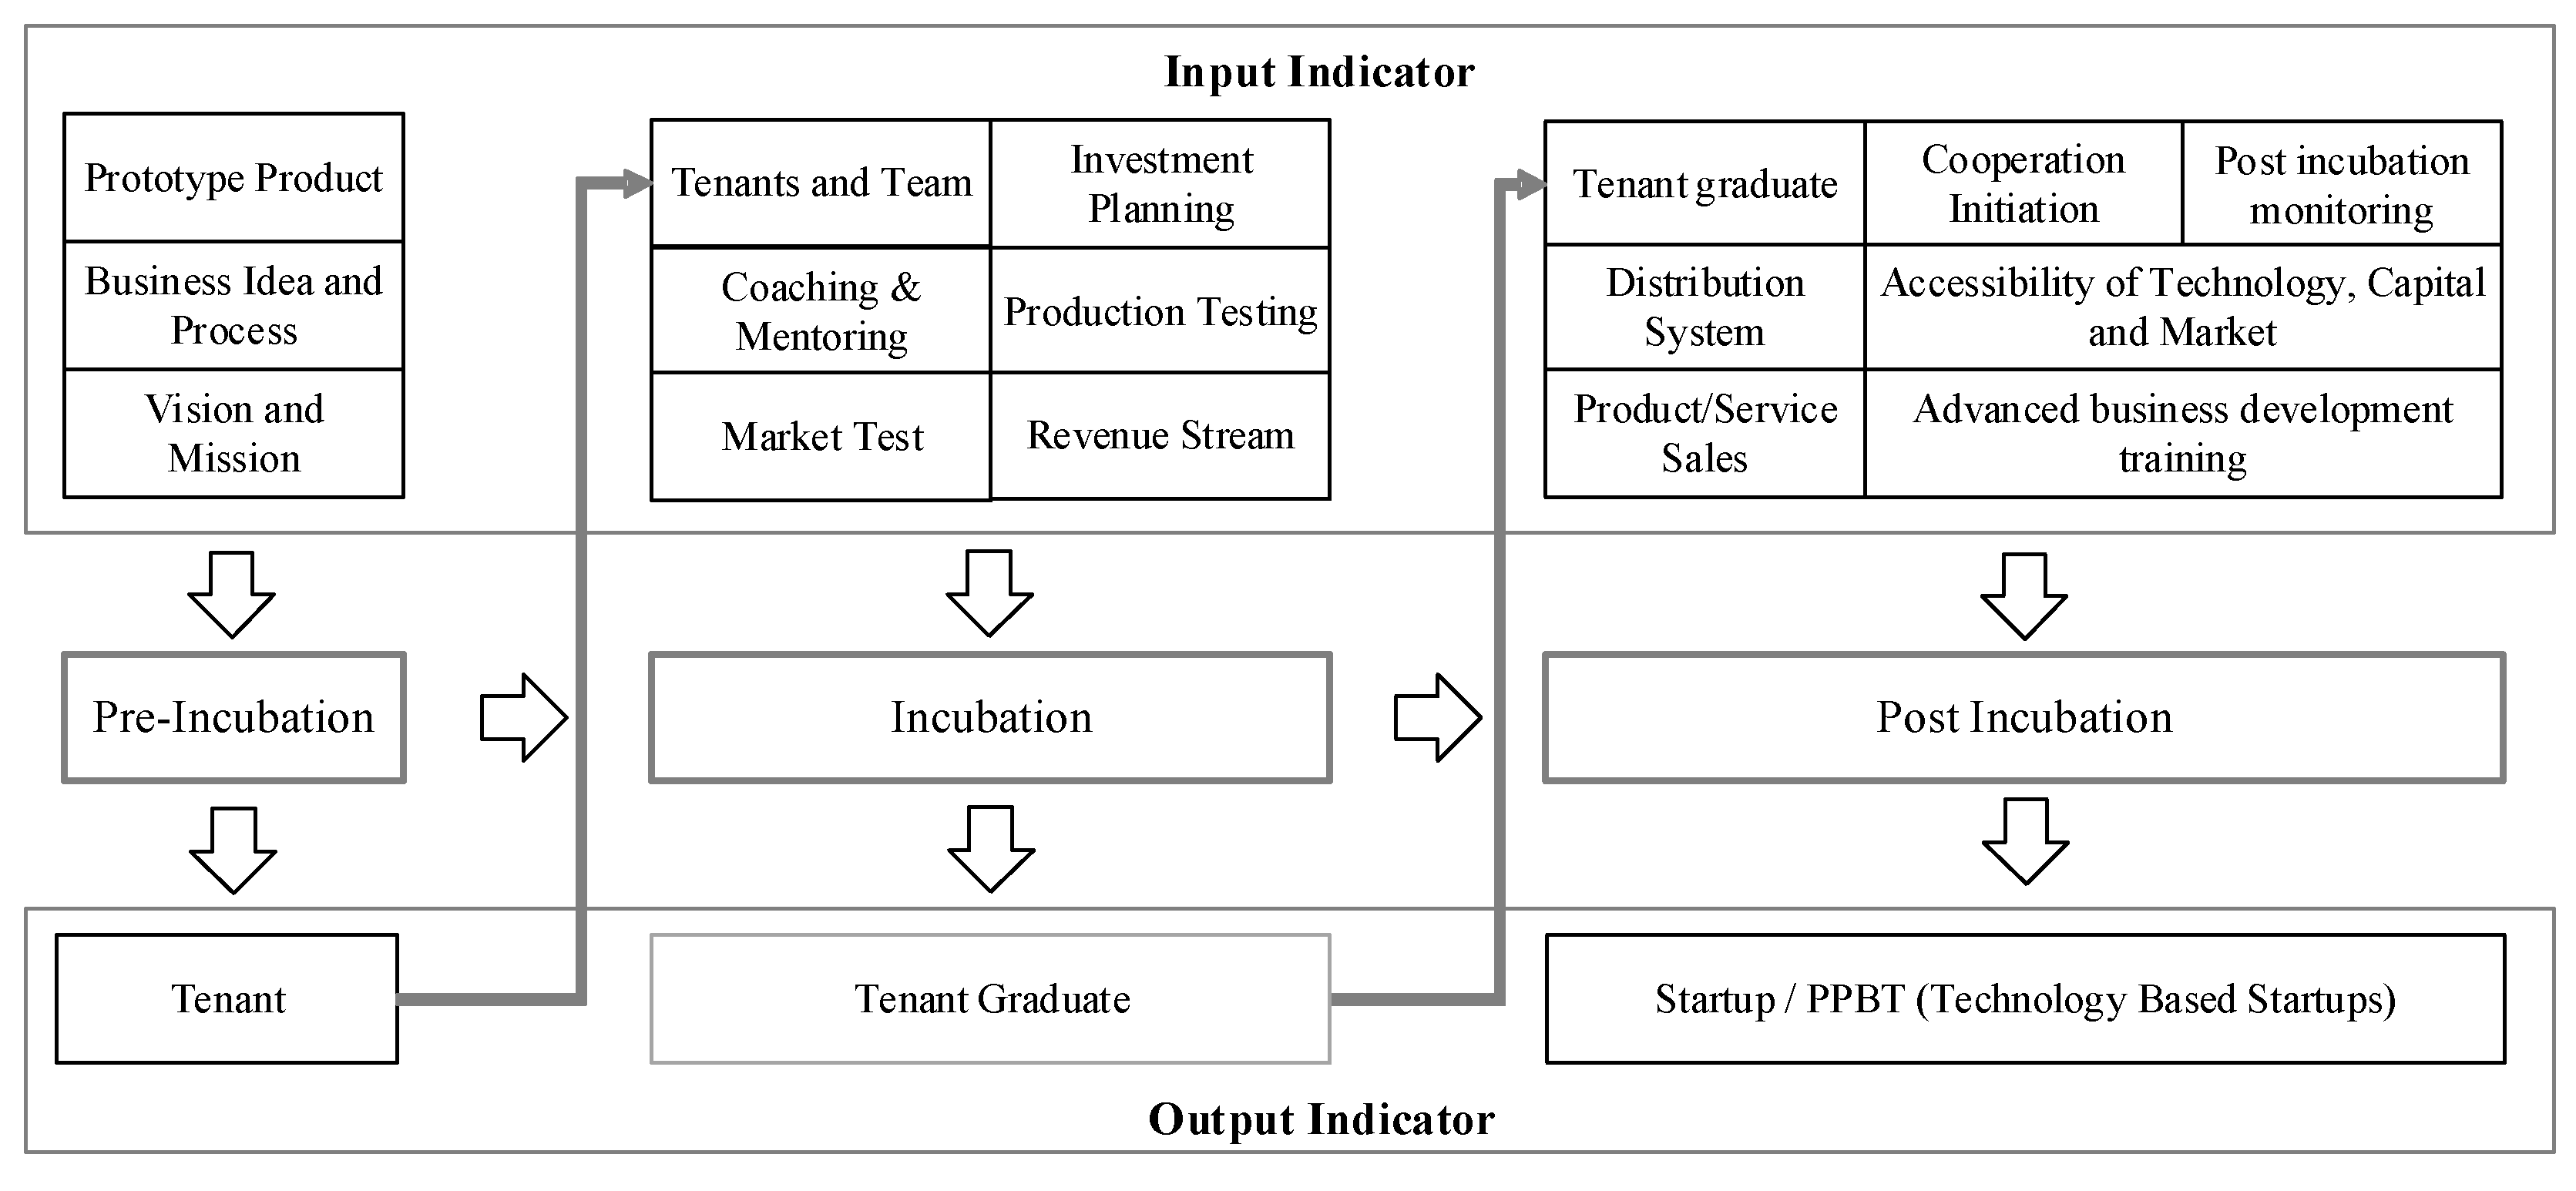
- Input indicator: The input indicators in the efficiency measurement model are compiled based on a questionnaire that has been built. The indicators in the questionnaire were remapped to the input indicators. The input indicators are divided into three stages of the process, namely, the pre-incubation process, the incubation process, and the post-incubation process. The Input Indicators, which consist of 16 indicators, are the results of the performance evaluation indicators of the Technology Transfer Office (TTO), which have been validated by FGDs by experts.
- (g)
- Output indicator: The output indicator of the efficiency measurement model is built based on the general incubation process framework. From this framework, it is found that the output in the pre-incubation process is the tenant; in the incubation process, it is the tenant graduate; and in the post-incubation process, it is the formation of the startup/PPBT.
- (h)
- Efficiency measurement with DEA: After the formation of a performance efficiency measurement model, the next step is the application of this measurement model using the DEA method to figure out whether a product’s relative efficiency value is a DMU under study. The efficiency measurement process is divided into four stages, namely, the development and testing of questionnaires, the determination of the DMU, the selection of the DEA model, and the measurement of performance efficiency using the DEA method. The conclusion of this measurement process is divided into two, namely, if the efficiency value if <1, then it is inefficient, and if the efficiency value is 1, then the DMU is considered efficient.
- (i)
- Output: This efficiency measurement model leads to the ultimate goal of minimizing time to market and investment costs.
3.2. Application of the TTO Performance Efficiency Measurement Model in the Incubation Process
- (a)
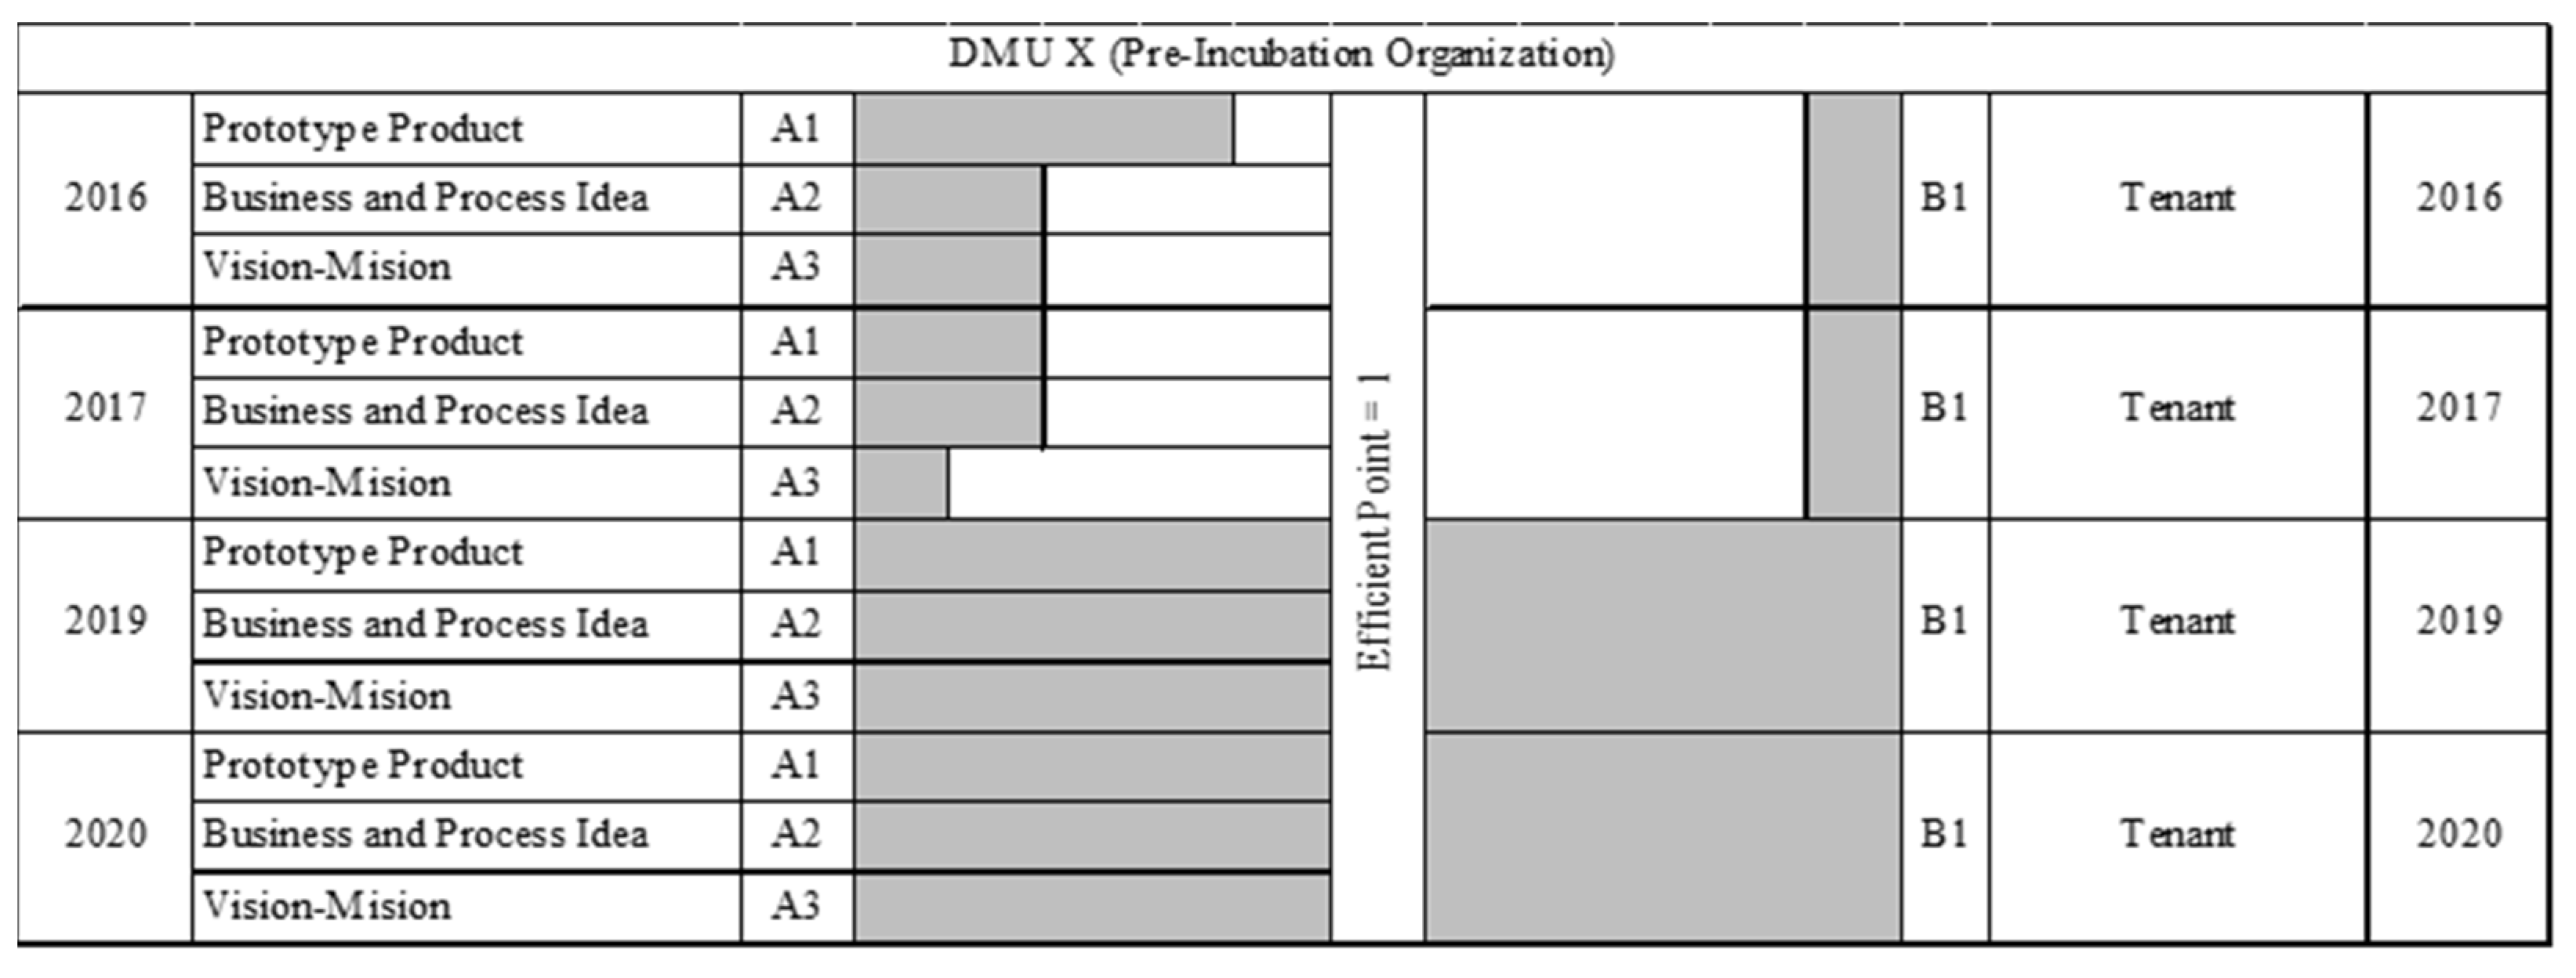
- Pre-incubation program
- (b)
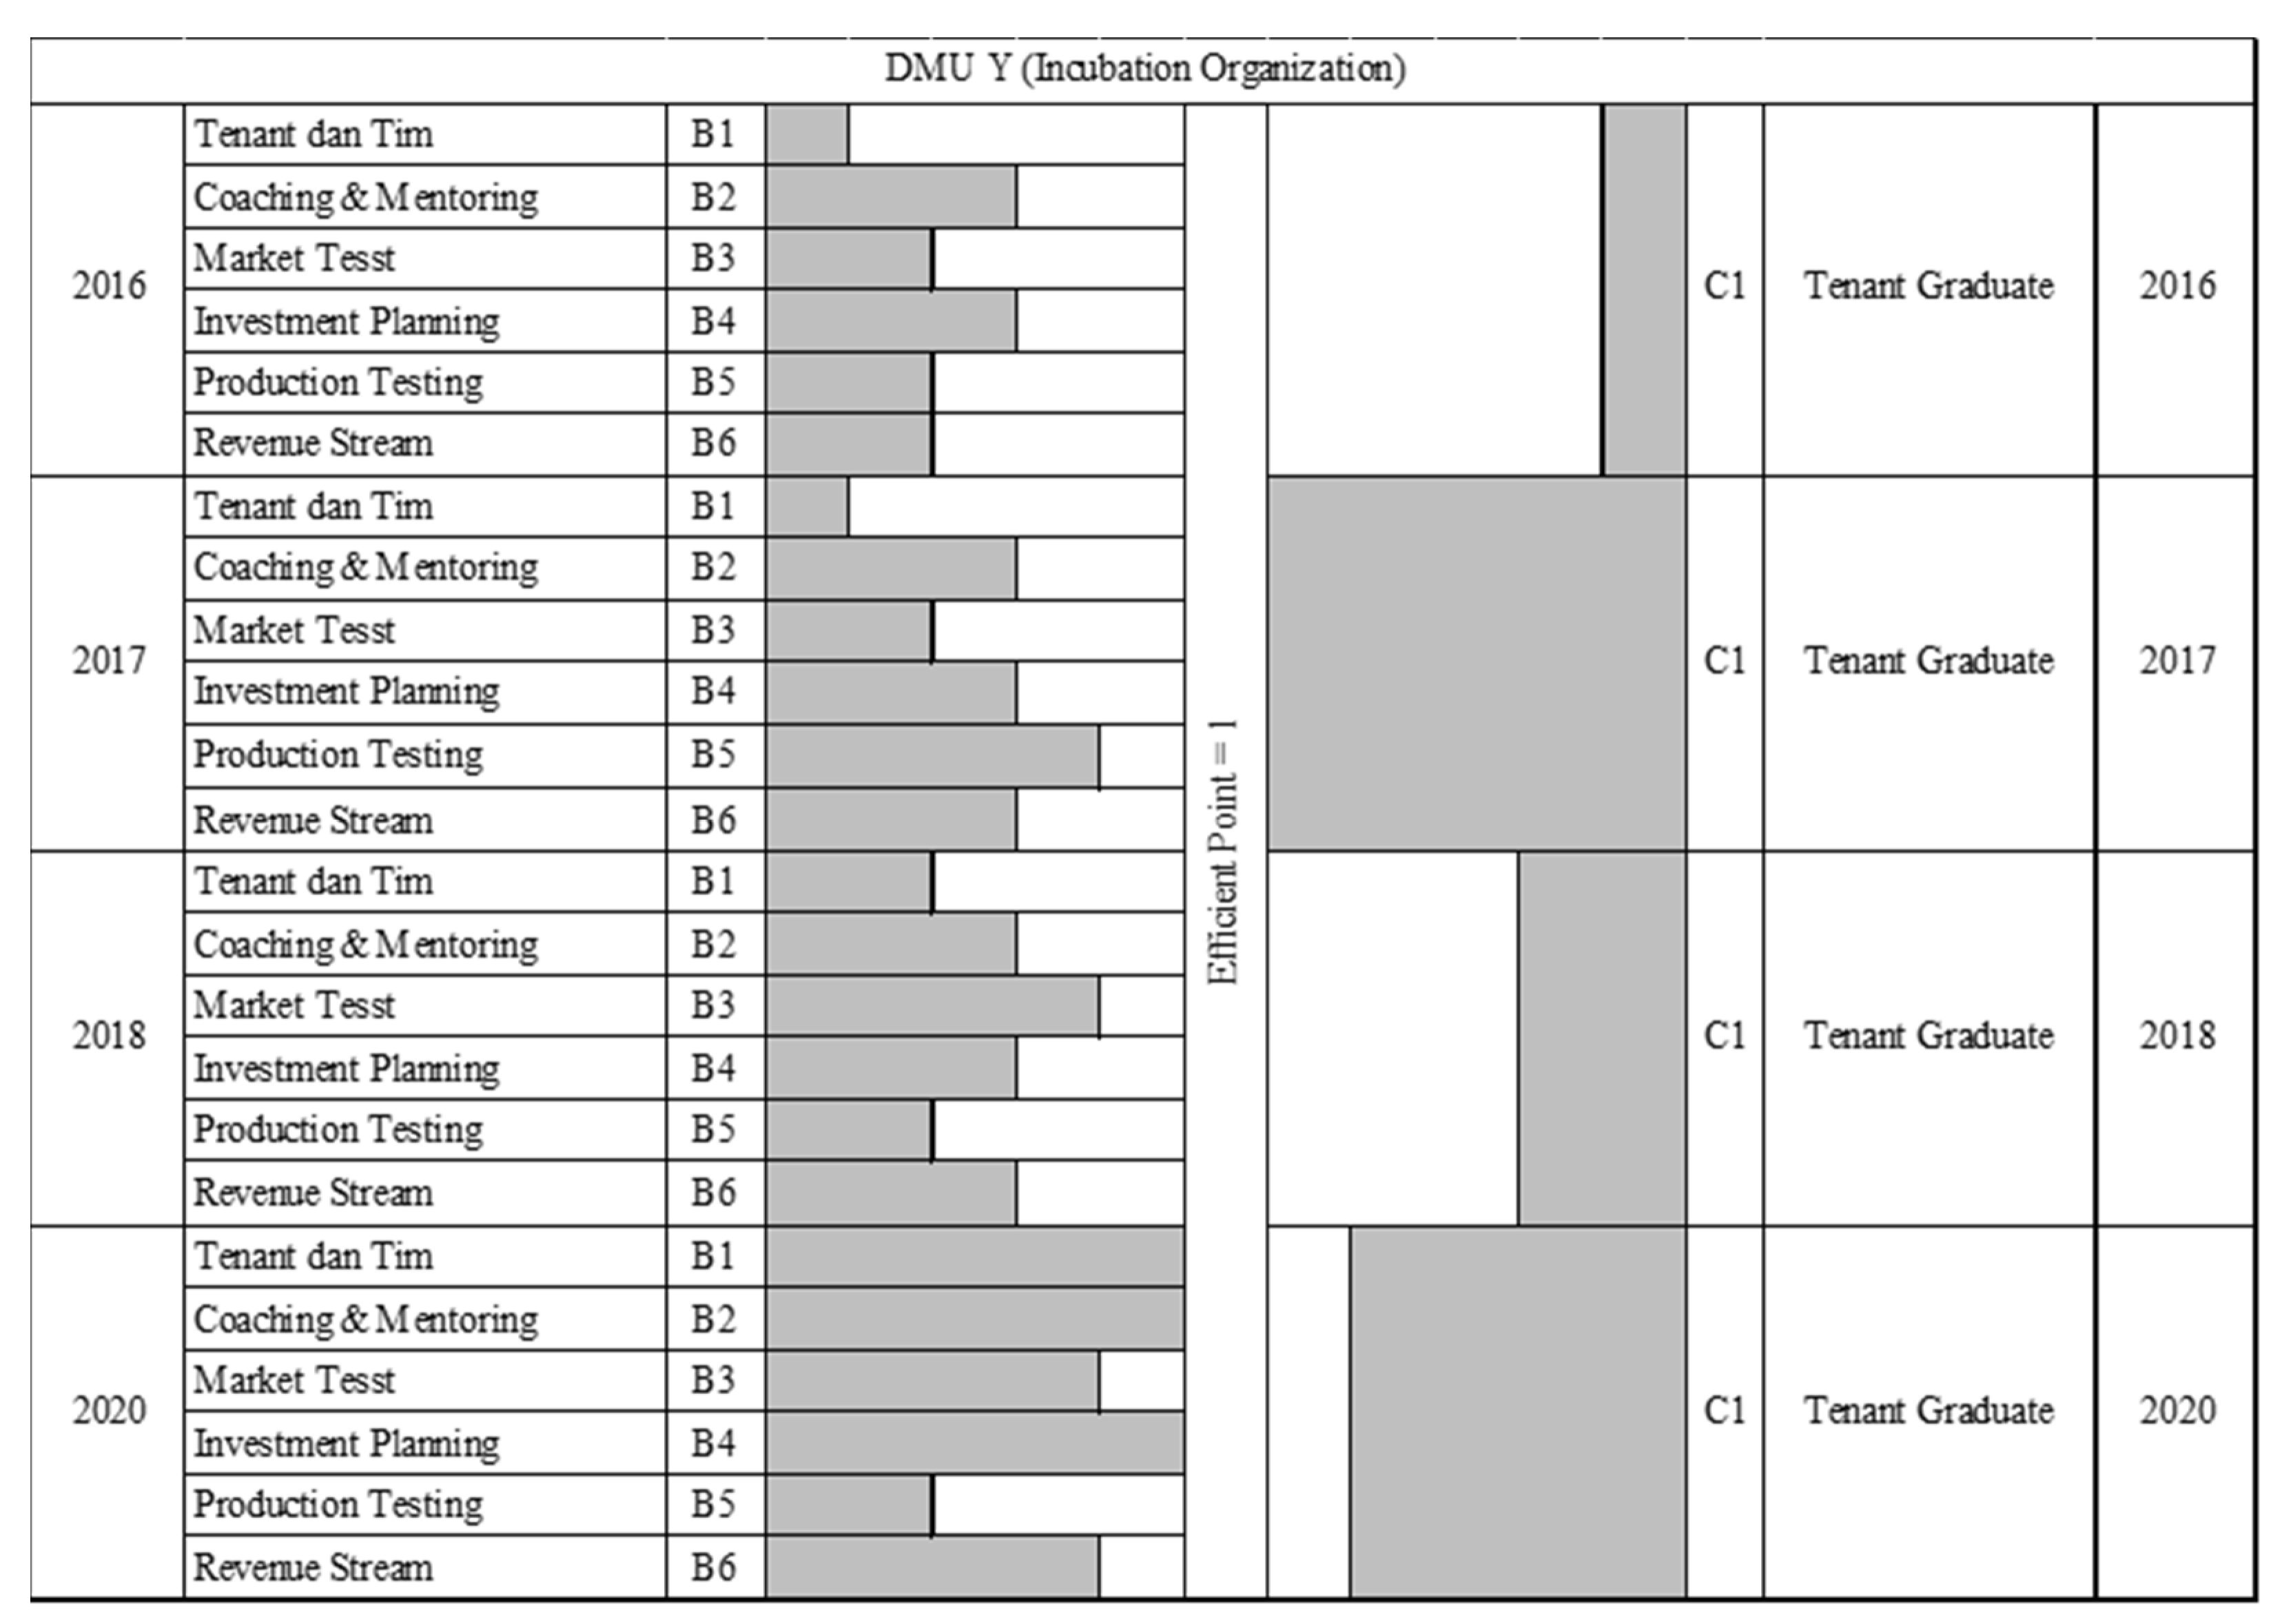
- Incubation program
- (c)
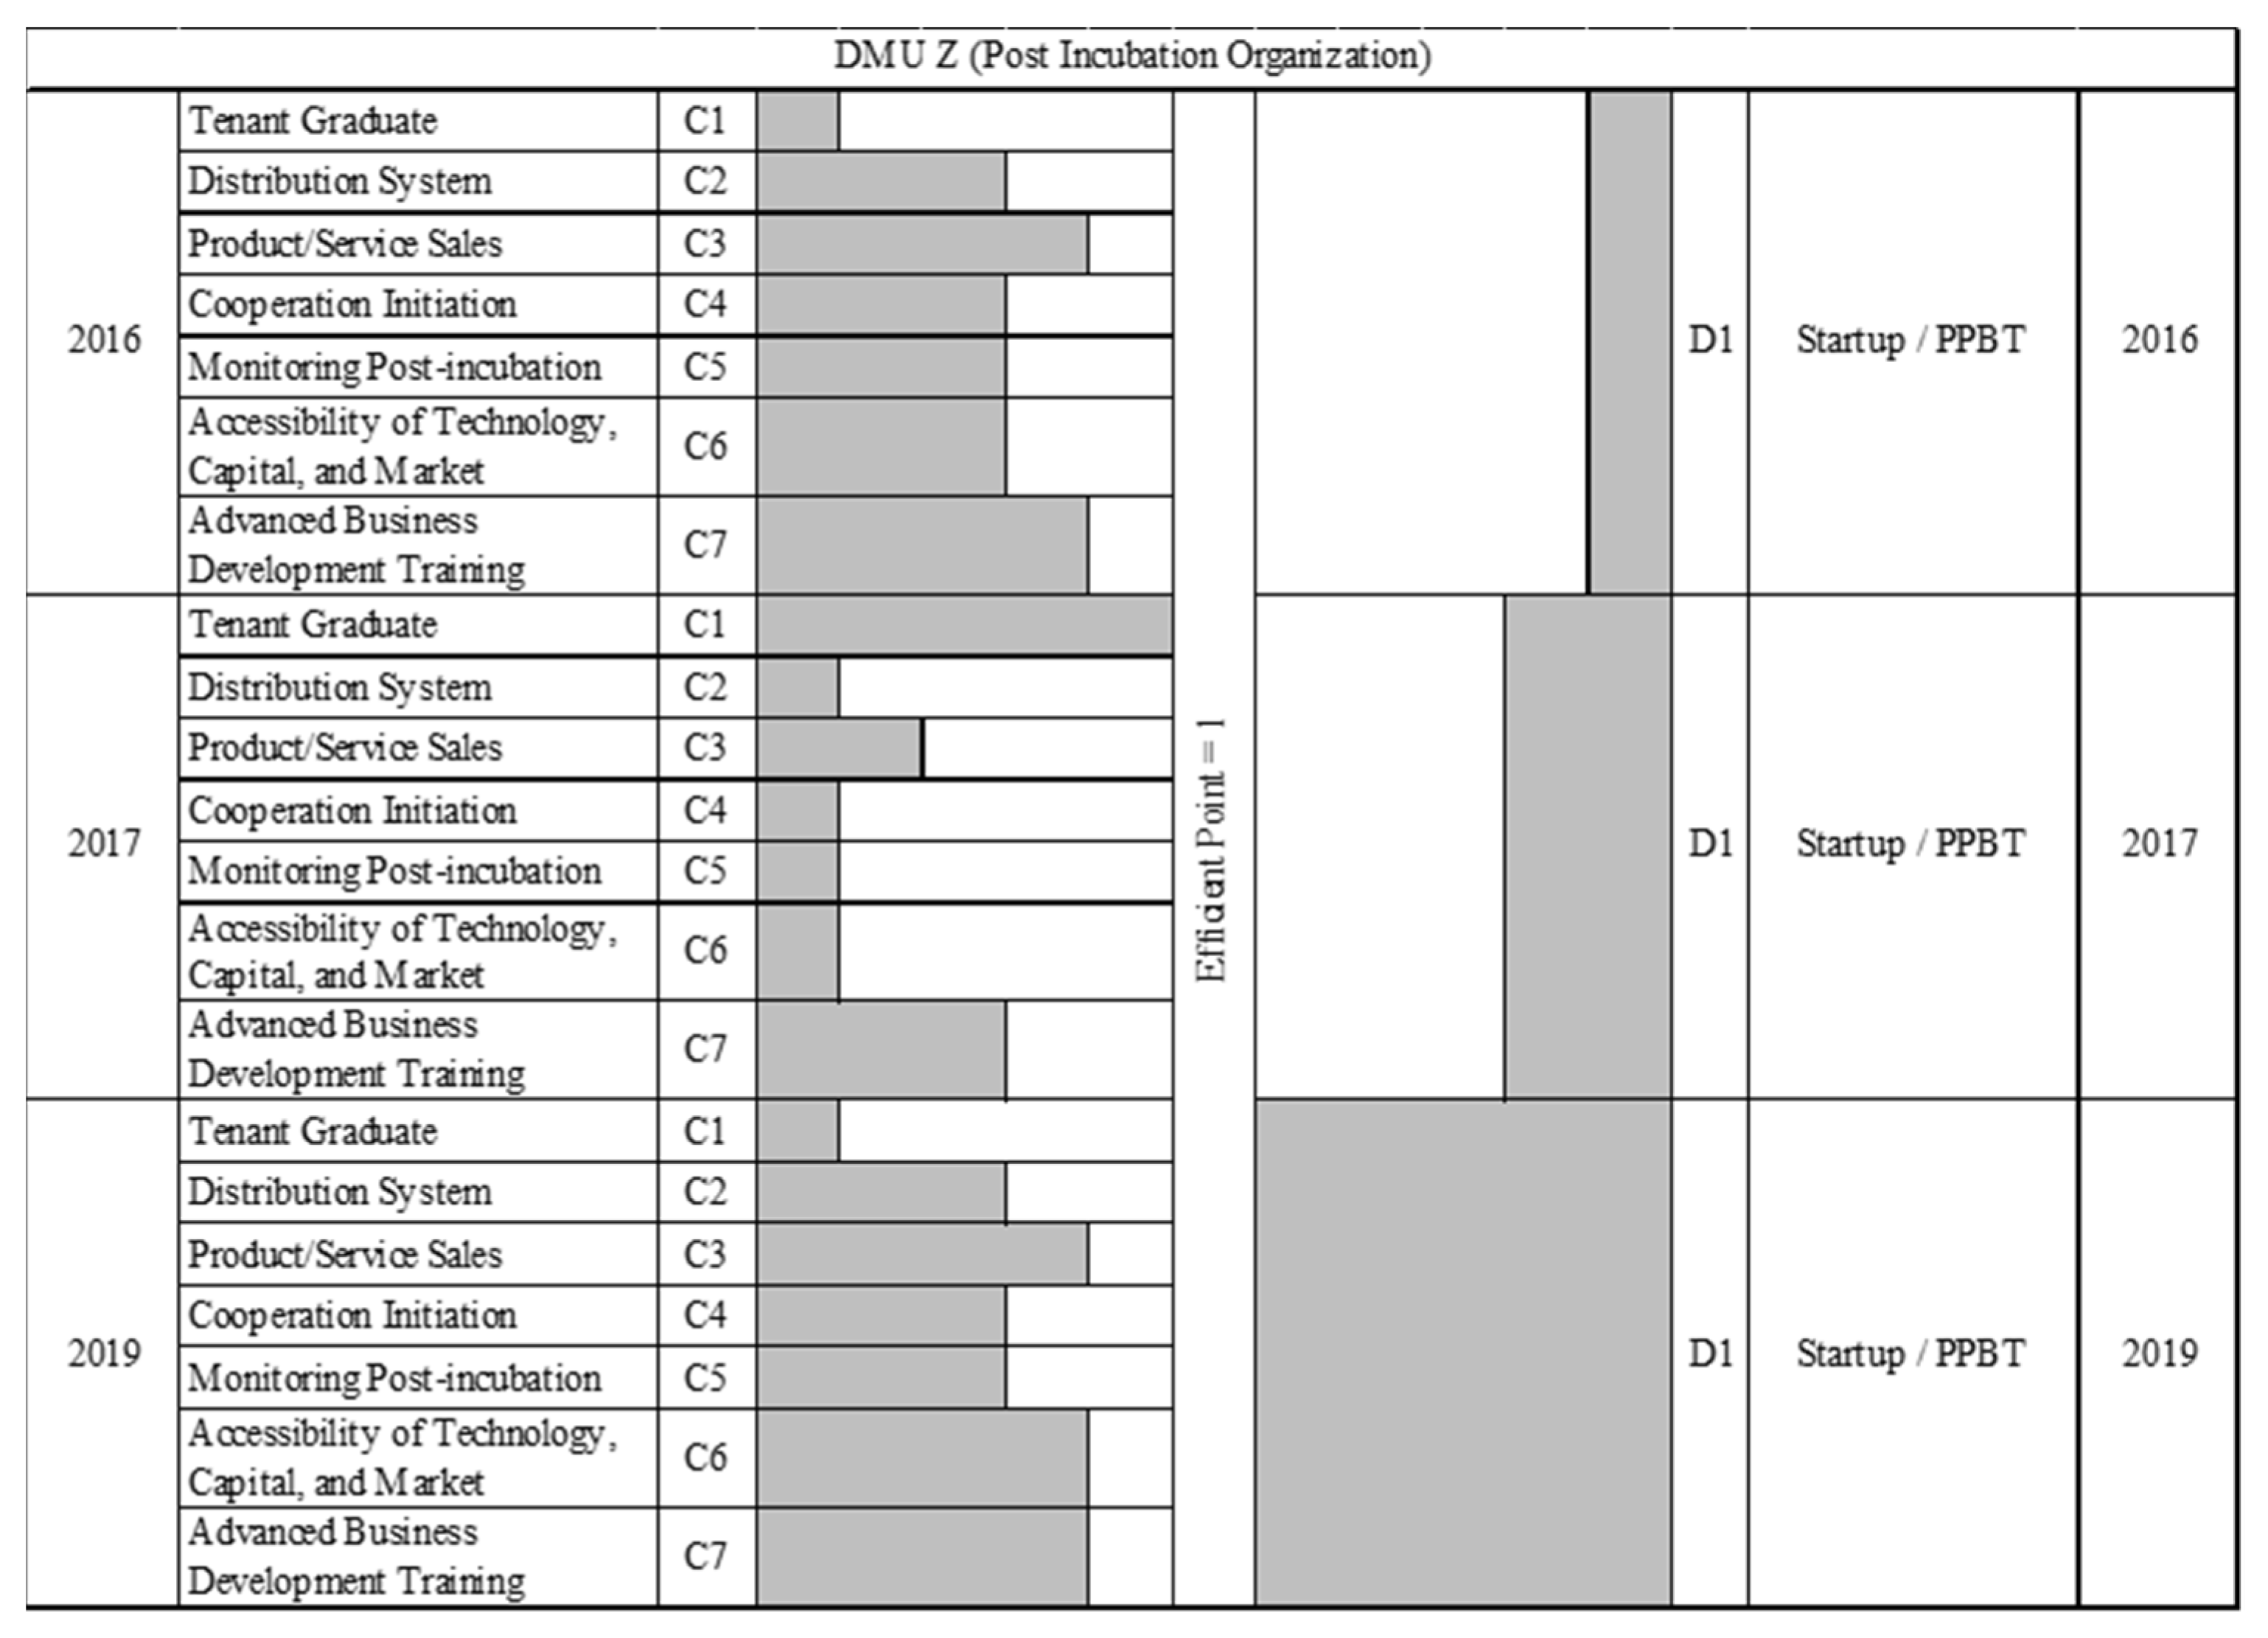
- Post-Incubation Program
4. Discussion
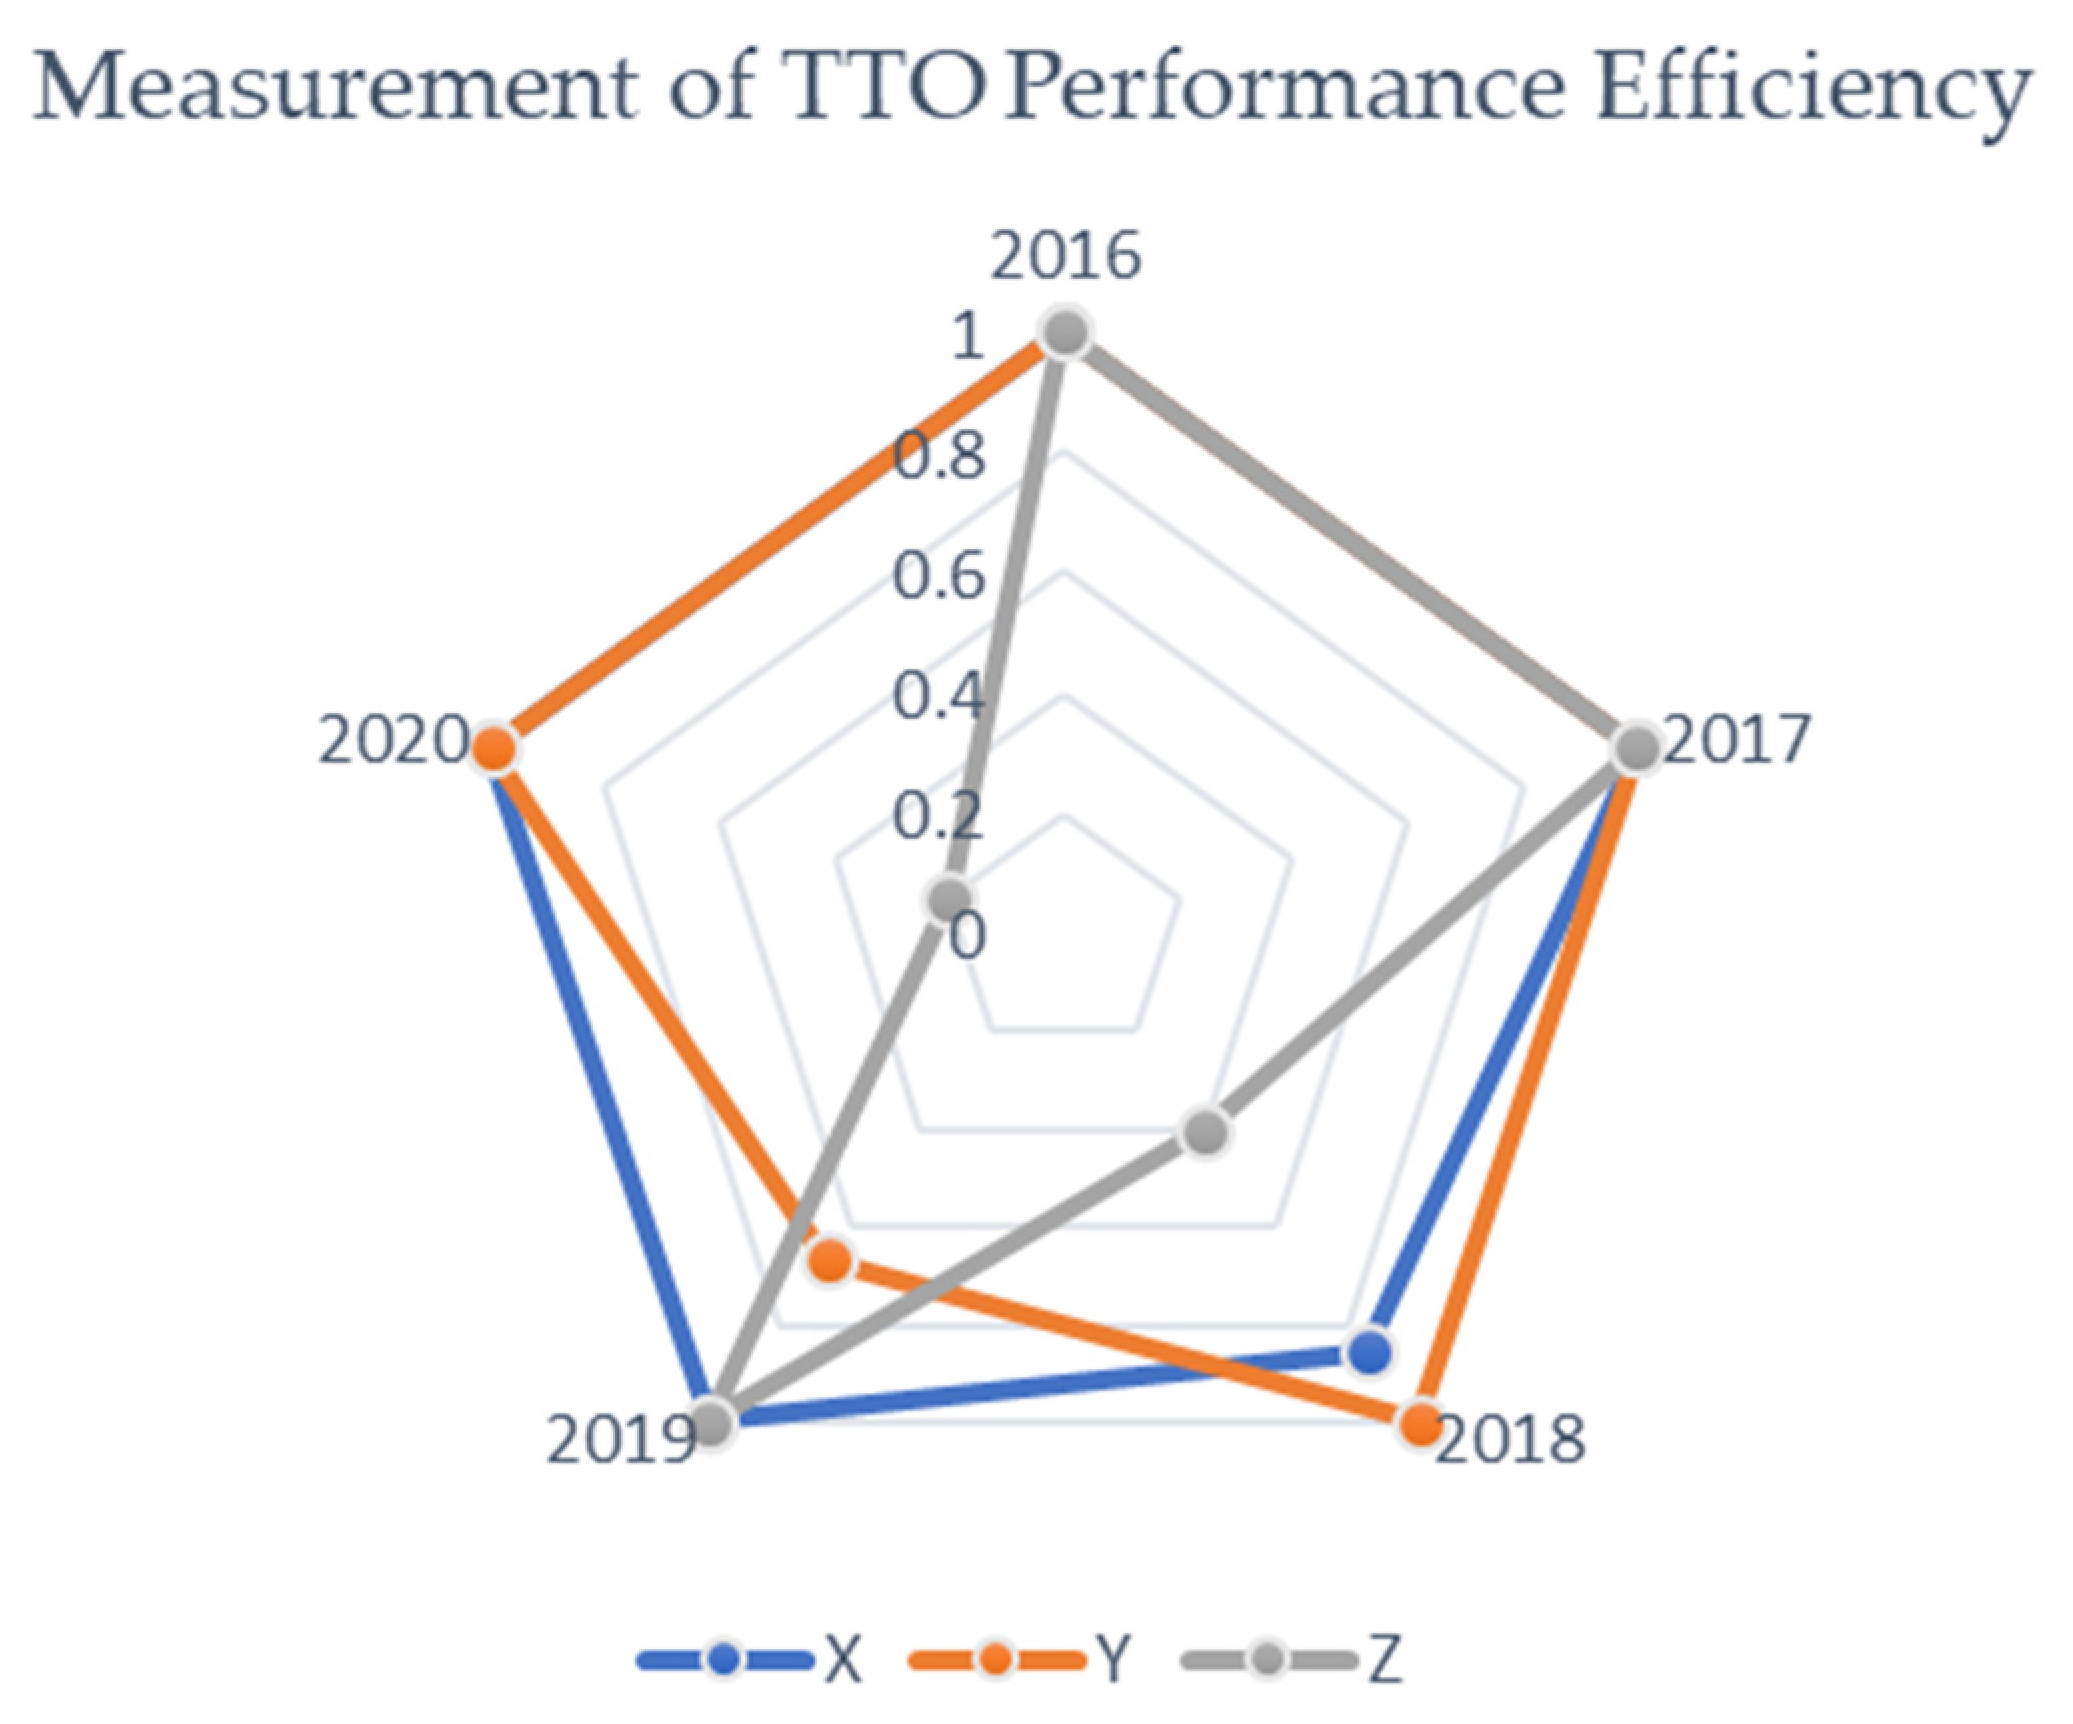
4.1. Efficiency Value Analysis of the Entire DMU
4.2. Efficiency Value Analysis between Variables
4.3. Model Applicability Analysis
4.4. Proposed TTO Performance Strategy Recommendations in Accelerating Commercialization Technology in Universities
4.5. Comparative Analysis with Previous Research
5. Conclusions
Author Contributions
Funding
Data Availability Statement
Acknowledgments
Conflicts of Interest
References
- Astirin, O.P. Downstream of Research Products through Community Service Activities; Sinemas UAD: Yogyakarta, Indonesia, 2018. [Google Scholar]
- Sutopo, W.; Astuti, R.W.; dan Suryandari, R.T. Accelerating a Technology Commercialization; with a Discussion on the Relation between Technology Transfer Efficiency and Open Innovation. J. Open Innov. Technol. Mark. Complex. 2019, 5, 95. [Google Scholar] [CrossRef] [Green Version]
- BIT-BPPT. BIT’s Profile Was Posted on 13 February 2016. Available online: https://bit.bppt.go.id/index.php/organisasi/profil-bit (accessed on 12 July 2021).
- Sutopo, W.; Hisjam, M.; Yuniaristanto Astuti, R.W.; Khoofiyah, N.A. Technology Incubation in Uniersity—To Support Technopreneur Activities, CV; Ilmu Madani Press: Lentera, Indonesia, 2021. [Google Scholar]
- Poister, T.H. Measuring Performance in Public and Non Profit Organizations; Jossey-Bass: San Fransisco, CA, USA, 2003. [Google Scholar]
- Banker, R.D.; Cooper, W.W.; Seiford, L.M.; Zhu, J. Returns to scale in DEA. In Handbook on Data Envelopment Analysis; Springer: Boston, MA, USA, 2011. [Google Scholar]
- Mahmudah, U.; Suhartono, S.; Rohayana, A.D. A Robust Data Envelopment Analysis for Evaluating Technical Efficiency of Indonesian High Schools. J. Pendidik. IPA Indones. 2018, 7, 114–121. [Google Scholar] [CrossRef]
- Pervan, M. Efficiency of Large Firms Operating in the Croatian Food Industry: Data Envelopment Analysis. WSEAS Trans. Bus. Econ. 2020, 17, 487–495. [Google Scholar] [CrossRef]
- Maltseva, V.; Na, J.; Kim, G.; Ha, H.-K. Efficiency Analysis of Russian Rail Freight Transportation Companies with Super Slack-Based Measurement Data Envelopment Analysis. J. Int. Logist. Trade 2020, 18, 77–89. [Google Scholar] [CrossRef]
- Khorshid, S.; Mehdiabadi, A. Effect of organizational identification on organizational innovativeness in universities and higher education institutions of Iran, mediated by risk-taking capability. Eur. J. Innov. Manag. 2020, 24, 1430–1458. [Google Scholar] [CrossRef]
- Olsson, A.K.; Bernhard, I.; Arvemo, T.; Snis, U.L. A conceptual model for university-society research collaboration facilitating societal impact for local innovation. Eur. J. Innov. Manag. 2020, 24, 1335–1353. [Google Scholar] [CrossRef]
- Chandra, P.; Tomitsch, M.; Large, M. Innovation education programs: A review of definitions, pedagogy, frameworks and evaluation measures. Eur. J. Innov. Manag. 2020, 24, 1268–1291. [Google Scholar] [CrossRef]
- Rahimnia, F.; Molavi, H. A model for examining the effects of communication on innovation performance: Emphasis on the intermediary role of strategic decision-making speed. Eur. J. Innov. Manag. 2020, 24, 1035–1056. [Google Scholar] [CrossRef]
- Aqidawati, E.F.; Sutopo, W.; Zakaria, R. Model to Measure the Readiness of University Testing Laboratories to Fulfill ISO/IEC 17025 Requirements (A Case Study). J. Open Innov. Technol. Mark. Complex. 2019, 5, 2. [Google Scholar] [CrossRef] [Green Version]
- Sahney, S. Use of multiple methodologies for developing a customer-oriented model of total quality management in higher education. Int. J. Educ. Manag. 2016, 30, 326–353. [Google Scholar] [CrossRef]
- He, J.; Wan, Y.; Feng, L.; Ai, J.; Wang, Y. An integrated data envelopment analysis and emergy-based ecological footprint methodology in evaluating sustainable development, a case study of Jiangsu Province, China. Ecol. Indic. 2016, 70, 23–34. [Google Scholar] [CrossRef]
- Wang, N. Optimization of Agricultural Input Efficiency for Wheat Production n China Applying Data Envelopment Analysis Method. Appl. Ecol. Environ. Res. 2017, 15, 293–305. [Google Scholar] [CrossRef]
- Stawowy, A.; Duda, J. A Study of the Efficiency of Polish Foundries Using Data Envelopment Analysis. Arch. Foundry Eng. 2017, 17, 223–227. [Google Scholar] [CrossRef] [Green Version]
- Sutopo, W. The Roles of Industrial Engineering Education for Promoting Innovations and Technology Commercialization in the Digital Era. IOP Conf. Ser. Mater. Sci. Eng. 2019, 495, 012001. [Google Scholar] [CrossRef]
- Haider, M.A. A Comparative Study of Operational Efficiency of Pakistani and Malaysian Islamic Banks: Data Envelopment Analysis Approach. Asian Econ. Financ. Rev. 2019, 9, 559–580. [Google Scholar] [CrossRef]
- Inel, M.N. An empirical study on measurement of efficiency of digital transformation by using data envelopment analysis. Manag. Sci. Lett. 2019, 9, 549–556. [Google Scholar] [CrossRef]
- Pramono, S.N.W.; Ulkhaq, M.M.; Pujotomo, D.; Ardhini, M.A. Assessing the Efficiency of Small and Medium Industry: An Application of Data Envelopment Analysis. IOP Conf. Ser. Mater. Sci. Eng. 2019, 598, 012043. [Google Scholar] [CrossRef]
- Zeng, Z.; Yang, W.; Zhang, S.; Witlox, F. Analysing Airport Efficiency in East China Using A Three-Stage Data Envelopment Analysis. Transport 2020, 35, 255–272. [Google Scholar] [CrossRef]
- Ahrens, R.D.B.; Lirani, L.D.S.; De Francisco, A.C. Construct Validity and Reliability of the Work Environment Assessment Instrument WE-10. Int. J. Environ. Res. Public Health 2020, 17, 7364. [Google Scholar] [CrossRef]
- Jogiyanto, H. Business Research Methodology: Misguided and Experiences; BPFE: Yogyakarta, Indonesia, 2011. [Google Scholar]
- Banker, R.D.; Charnes, A.; Cooper, W.W. Some Models for Estimating Technical and Scale Inefficiencies in Data Envelopment Analysis. Manag. Sci. 1984, 30, 1078–1092. [Google Scholar] [CrossRef] [Green Version]
- Charnes, A.; Cooper, W.W.; Rhodes, E. Measuring the efficiency of decision making units. Eur. J. Oper. Res. 1978, 2, 429–444. [Google Scholar] [CrossRef]
- Cooper, S.; Hetherington, L. Facilitating academic entrepreneurship: Encouraging technology commercialization through the development of entrepreneurial capability. In Frontiers of Entrepreneurship Research; Babson College Center: Babson College, MA, USA, 2003. [Google Scholar]
- Cooper, W.; Seiford, L.; Tone, K. Data Envelopment Analysis: A Comprehensive Text with Models, Application, Reference and DEA Solver Sofware, 2nd ed.; Springer Science & Business Media, LLC.: New York, NY, USA, 2007. [Google Scholar]
- Nasution, R.; Djuanda, D.; Rachmah, R. Literature Study on the Commercialization of Technology in Higher Education: Process, Potential, Models, and Actors. J. Manajemen Teknologi 2009, 8, 1–15. [Google Scholar]
- Astuti, R.W.; Yuniaristanto Sutopo, W.; Purwanto, A.; Nizam, M. Timing model to launch spin-off company: The case study of mini manufacturing plant of 10kWH Li-ion batteries. Lect. Notes in Eng. Comput. Sci. 2019, 2210, 113110. [Google Scholar]
- Peykani, P.; Namakshenas, M.; Arabjazi, N.; Shirazi, F.; Kavand, N. Optimistic and Pessimistic Fuzzy Data Envelopment Analysis: Empirical Evidence from Tehran Stock Market. Fuzzy Optimization and Modeling 2021, 2, 12–21. [Google Scholar] [CrossRef]
- Gholami, O. A Novel Approach for Solving Fuzzy Stochastic Data Envelopment Analysis Model in the Presence of Undesirable Outputs. Fuzzy Optim. Modeling 2021, 3, 22–36. [Google Scholar] [CrossRef]
- Lotfi, F.H.; Jahanshahloo, G.; Soltanifar, M.; Ebrahimnejad, A.; Mansourzadeh, S. Relationship between MOLP and DEA based on output-orientated CCR dual model. Expert Syst. Appl. 2010, 37, 4331–4336. [Google Scholar] [CrossRef]
- Maddahi, R.; Jahanshahloo, G.R.; Lotfi, F.H.; Ebrahimnejad, A. Optimising proportional weights as a secondary goal in DEA cross-efficiency evaluation. Int. J. Oper. Res. 2014, 19, 234. [Google Scholar] [CrossRef]


| Writer | Research Brief | Study Object | Model DEA | Orientation | Input | Output | ||||||||
|---|---|---|---|---|---|---|---|---|---|---|---|---|---|---|
| CCR | BCC | Input | Output | Total | Scale | Time | Cost | Total | Scale | Time | Cost | |||
| Sahney [19] | Evaluation of the performance of higher education institutions in India nationally | University | √ | √ | 5 | Ratio | 5 | Ratio | ||||||
| He, Wan, Ai, and Wang [20] | Evaluating eco-efficiency to drive the transformation towards sustainability | Jiangsu Province, China | √ | √ | 4 | Ratio | √ | 2 | Ratio | √ | ||||
| Wang, Jin, Ye, Gao, and Li [21] | Improving the efficiency of using agricultural inputs for food security in China | Wheat production farmer | √ | √ | √ | 5 | Ratio | 1 | Ratio | |||||
| Stawowy and Duda [22] | Analyzing the usefulness of the DEA method in the study of the relative efficiency of foundries | Foundry factories in Poland | √ | √ | 3 | Ratio | √ | 1 | Ratio | |||||
| Mahmudah, Suhartono, and Rohayana [7] | Evaluating the technical efficiency of secondary school education in Indonesia | High school in Indonesia | √ | √ | 8 | Ratio | 6 | Ratio | ||||||
| Sutopo, Astuti, and Suryandari [23] | Accelerating technology commercialization, with a discussion on the relation between technology transfer efficiency and open innovation | University | √ | √ | 5 | Ordinal | √ | 5 | Ordinal | |||||
| Haider, Raza, Jameel, and Pervaiz [24] | Comparing the execution and potential of Pakistani and Malaysian Islamic banking operations | Islamic Banking | √ | √ | 3 | Ratio | √ | 3 | Ratio | √ | ||||
| Inel, M.N [25] | Measuring the relative efficiency of digital transformation among EU countries | European Union Countries | √ | √ | √ | 5 | Ratio | √ | 2 | Ratio | ||||
| Pramono, Ulkhaq, Pujotomo, and Ardhini [26] | Investigating the relative efficiency of educational toys manufacturers using a data envelopment analysis approach | Educational toys in Central Java | √ | √ | 6 | Ratio | 1 | Ratio | ||||||
| Zeng, Yang, Zhang, and Witlox [27] | Evaluating the Technical Efficiencies (Tests) of a group of airports in East China | Airport | √ | √ | 4 | Ratio | 3 | Ratio | ||||||
| This research | Measuring the efficiency of TTO performance in the incubation process in universities | Technology Transfer Office (TTO) | √ | √ | 3 6 7 | Ordinal | √ | √ | 1 1 1 | Ordinal | √ | √ | ||
| Incubation Process | Indicators | Statement | Code | |
|---|---|---|---|---|
| Pre-incubation Program | The pre-incubation stage aims to build a synergistic partnership between technology producers and technology users and their supporting elements. | Input | Has made a product/service prototype of the business that will be run | A1 |
| Has created ideas and business processes that will be executed | A2 | |||
| Has formulated the vision and mission of the business to be carried out | A3 | |||
| Output | Has carried out the pre-incubation process and succeeded in becoming a tenant | B1 | ||
| Incubation Program | The incubation stage aims to realize the facilities needed by tenants in business development efforts; at this stage, technology and business transfer occurs. | Input | Has carried out the pre-incubation process and succeeded in becoming a tenant | B1 |
| Has completed coaching and mentoring | B2 | |||
| Has conducted market testing to see the market response to the products/services produced | B3 | |||
| Has made an investment plan for the business that will be run | B4 | |||
| Has carried out small-scale production testing with low initial production costs | B5 | |||
| Has formulated what revenue streams are the company’s profits | B6 | |||
| Output | Has graduated from the business incubation process, is ready for business acceleration, and has already certified products/services | C1 | ||
| Post Incubation Program | The post-incubation stage occurs at the point of mass product accessibility, with tenants having passed the incubation stage and being able to start mass production. | Input | Has graduated from the business incubation process, is ready for business acceleration, and has already certified products/services | C1 |
| Has formulated a distribution system that is under the characteristics of the product/service | C2 | |||
| Has sold products/services | C3 | |||
| Has initiated cooperation with other parties | C4 | |||
| Has completed post-incubation monitoring | C5 | |||
| Has taken advantage of the accessibility of technology, capital, and markets | C6 | |||
| Has carried out advanced business development training that is run | C7 | |||
| Output | Technology-based startup/startup company (PPBT) has been formed | D1 | ||
| No | Decision-Making Unit (DMU) | Code DMU |
|---|---|---|
| 1 | Pre-Incubation Organization at LPIK ITB | X |
| 2 | Incubation Organization at LPIK ITB | Y |
| 3 | Post-Incubation Organization at LPIK ITB | Z |
| Incubation Period | Success Indicator |
|---|---|
| 0th year (Pre-Incubation) | Recorded data on prospective tenants, business proposals, and potential technology |
| Obtained tenants and technology by TTO criteria | |
| 1st year (Incubation) | The tenants can identify markets, partners, and competitors |
| The product TRL value reaches 8 | |
| TTO can determine the sustainability of tenant incubation activities | |
| Funds for incubation activities for tenants are fully absorbed and according to plan | |
| IPR, certification, and product licenses are ready to apply | |
| 2nd year (Incubation) | The required product certifications, licenses, and IPRs have been submitted to the Director-General of Intellectual Property Rights |
| The product TRL value reaches 9 | |
| Identification of consumer needs; large-scale production needs have been carried out by tenants | |
| TTO can determine the sustainability of tenant incubation activities | |
| Funds for incubation activities for tenants are fully absorbed and according to plan | |
| 3rd year (Incubation) | PPBT successfully formed |
| The product TRL value is at least 8, and 75% of the TRL 9 indicators are met | |
| Formally formed tenant partners | |
| TTO can determine the sustainability of tenant incubation activities | |
| Funds for incubation activities for tenants are fully absorbed and according to plan | |
| Post-Incubation | The partnership between PPBT tenant and TTO is formally formed |
| Incubation Process | Indicator | Code | 2016 | 2017 | 2018 | 2019 | 2020 |
|---|---|---|---|---|---|---|---|
| Pre-incubation program | Input | A1 | 4 | 2 | 4 | 5 | 5 |
| A2 | 2 | 2 | 3 | 5 | 5 | ||
| A3 | 2 | 1 | 3 | 5 | 5 | ||
| Output | B1 | 1 | 1 | 2 | 5 | 5 | |
| Incubation program | Input | B1 | 1 | 1 | 2 | 5 | 5 |
| B2 | 3 | 3 | 3 | 3 | 5 | ||
| B3 | 2 | 2 | 4 | 3 | 4 | ||
| B4 | 3 | 3 | 3 | 3 | 5 | ||
| B5 | 2 | 4 | 2 | 2 | 2 | ||
| B6 | 2 | 3 | 3 | 4 | 4 | ||
| Output | C1 | 1 | 5 | 2 | 1 | 4 | |
| Post-incubation | Input | C1 | 1 | 5 | 2 | 1 | 4 |
| C2 | 3 | 1 | 3 | 3 | 3 | ||
| C3 | 4 | 2 | 4 | 4 | 4 | ||
| C4 | 3 | 1 | 4 | 3 | 4 | ||
| C5 | 3 | 1 | 3 | 3 | 3 | ||
| C6 | 3 | 1 | 4 | 4 | 4 | ||
| C7 | 4 | 3 | 4 | 4 | 4 | ||
| Output | D1 | 1 | 2 | 2 | 5 | 1 |
| No | DMU | Score | Benchmark (Lambda) | |
|---|---|---|---|---|
| 1 | X | 2016 | 1 | 2017 (1.000000) |
| 2 | 2017 | 1 | 2017 (1.000000) | |
| 3 | 2018 | 0.857 | 2017 (0.666667); 2019 (0.333333) | |
| 4 | 2019 | 1 | 2019 (1.000000) | |
| 5 | 2020 | 1 | 2019 (1.000000) | |
| No | DMU | Score | Benchmark (Lambda) | |
|---|---|---|---|---|
| 1 | Y | 2016 | 1 | 2016 (1.000000) |
| 2 | 2017 | 1 | 2017 (1.000000) | |
| 3 | 2018 | 1 | 2018 (1.000000) | |
| 4 | 2019 | 0.6667 | 2016 (1.000000); 2018 (0.500000) | |
| 5 | 2020 | 1 | 2017 (1.000000) | |
| No | DMU | Score | Benchmark (Lambda) | |
|---|---|---|---|---|
| 1 | Z | 2016 | 1 | 2016 (1.000000) |
| 2 | 2017 | 1 | 2017 (1.000000) | |
| 3 | 2018 | 0.4 | 2019 (1.000000) | |
| 4 | 2019 | 1 | 2019 (1.000000) | |
| 5 | 2020 | 0.2 | 2019 (1.000000) | |
| No | DMU | Score | Description | |
|---|---|---|---|---|
| 1 | X | 2016 | 1 | v |
| 2 | 2017 | 1 | v | |
| 3 | 2018 | 0.857 | ||
| 4 | 2019 | 1 | v | |
| 5 | 2020 | 1 | v | |
| 6 | Y | 2016 | 1 | v |
| 7 | 2017 | 1 | v | |
| 8 | 2018 | 1 | ||
| 9 | 2019 | 0.667 | ||
| 10 | 2020 | 1 | v | |
| 11 | Z | 2016 | 1 | v |
| 12 | 2017 | 1 | v | |
| 13 | 2018 | 0.4 | ||
| 14 | 2019 | 1 | v | |
| 15 | 2020 | 0.2 | ||
Publisher’s Note: MDPI stays neutral with regard to jurisdictional claims in published maps and institutional affiliations. |
© 2022 by the authors. Licensee MDPI, Basel, Switzerland. This article is an open access article distributed under the terms and conditions of the Creative Commons Attribution (CC BY) license (https://creativecommons.org/licenses/by/4.0/).
Share and Cite
Sutopo, W.; Khofiyah, N.A.; Hisjam, M.; Ma’aram, A. Performance Efficiency Measurement Model Development of a Technology Transfer Office (TTO) to Accelerate Technology Commercialization in Universities. Appl. Syst. Innov. 2022, 5, 21. https://doi.org/10.3390/asi5010021
Sutopo W, Khofiyah NA, Hisjam M, Ma’aram A. Performance Efficiency Measurement Model Development of a Technology Transfer Office (TTO) to Accelerate Technology Commercialization in Universities. Applied System Innovation. 2022; 5(1):21. https://doi.org/10.3390/asi5010021
Chicago/Turabian StyleSutopo, Wahyudi, Nida An Khofiyah, Muhammad Hisjam, and Azanizawati Ma’aram. 2022. "Performance Efficiency Measurement Model Development of a Technology Transfer Office (TTO) to Accelerate Technology Commercialization in Universities" Applied System Innovation 5, no. 1: 21. https://doi.org/10.3390/asi5010021