Petrologic History of Lunar Phosphates Accounts for the Water Content of the Moon’s Mare Basalts


1
Department of Geology, University of Salamanca, 37008 Salamanca, Spain
2
School of Earth and Environmental Sciences, University of Manchester, M13 9PL Manchester, UK
3
Department of Research & Education, Naturalis Biodiversity Center, 2333 CR Leiden, The Netherlands
4
Department of Earth Sciences, University of Utrecht, 3584 CB Utrecht, The Netherlands
*
Author to whom correspondence should be addressed.
Geosciences 2019, 9(10), 421; https://doi.org/10.3390/geosciences9100421
Submission received: 7 June 2019
/
Revised: 18 September 2019
/
Accepted: 26 September 2019
/
Published: 28 September 2019
(This article belongs to the Special Issue Making an Impact: Exploring Advances in Meteorite and Mineralogical Studies in Planetary Science)
Abstract
:We present reaction balancing and thermodynamic modeling based on microtextural observations and mineral chemistry, to constrain the history of phosphate crystallization within two lunar mare basalts, 10003 and 14053. Phosphates are typically found within intercumulus melt pockets (mesostasis), representing the final stages of basaltic crystallization. In addition to phosphates, these pockets typically consist of Fe-rich clinopyroxene, fayalite, plagioclase, ilmenite, SiO2, and a residual K-rich glass. Some pockets also display evidence for unmixing into two immiscible melts: A Si-K-rich and an Fe-rich liquid. In these cases, the crystallization sequence is not always clear. Despite petrologic complications associated with mesostasis pockets (e.g., unmixing), the phosphates (apatite and merrillite) within these areas have been recently used for constraining the water content in the lunar mantle. We compute mineral reaction balancing for mesostasis pockets from Apollo high-Ti basalt 10003 and high-Al basalt 14053 to suggest that their parental magmas have an H2O content of 25 ± 10 ppm, consistent with reported estimates based on directly measured H2O abundances from these samples. Our results permit to constrain in which immiscible liquid a phosphate of interest crystallizes, and allows us to estimate the extent to which volatiles may have partitioned into other phases such as K-rich glass or surrounding clinopyroxene and plagioclase using a non-destructive method.
Keywords:
Mare basalt; Mass balance; Lunar hydration; Mesostasis; Planetary geology; Apatite; Apollo1. Introduction
The study of accessory minerals such as phosphates is fundamental in advancing our understanding of volatile element evolution during planetary magmatism (e.g., [1,2,3,4,5,6,7,8,9]). The Moon was traditionally considered to be a volatile-depleted body (e.g., [10,11,12,13]). However, since the direct measurement of hydrogen (expressed as both H2O and OH, here we use H2O in melts and OH in apatite) within apatites from lunar mare basalts [14,15] this credo has been challenged [8,14,16,17,18,19]. Early studies based on apatite measurements suggested that some mare basalt source regions are hydrous (e.g., [15]), with recent estimates placing an average water content for the lunar mantle at ~0.15–5.3 ppm [8], ~110 ppm [20], or ~320 ppm [21]. However, [5] highlighted that elevated water contents within lunar apatites (>> 100 ppm H2O) are underestimated during their crystallization because of the partitioning effects at non-Henrian law conditions. Those authors argued that zoning in apatites represent a replacement of H2O by Cl and F, implying that the primary magmas could have been more water-rich. Furthermore, [22] noted that decreasing F and increasing Cl + S from core to rim is preserved in some lunar apatites, suggesting late-stage metasomatic alteration with a S-Cl–bearing, but F-poor fluid. By implication, late volatiles may be present locally, altering earlier dry assemblages. All this is consistent with our general knowledge about fractional crystallization of magmas on Earth (e.g., [23,24]) in which the last melts will increase in volatile and incompatible elements by orders of magnitude. This is also a fundamental aspect of thermodynamic modeling tools for the input conditions used when calculating mineral equilibria in such mineral assemblages (e.g., MELTS [25,26] and SPICES [27,28]).
Apatite is among the final mineral phases to crystallize within basaltic systems, commonly crystallizing within microdomains of residual, late-stage, interstitial melt pockets (mesostasis). These pockets display variable mineralogy, and commonly show evidence for having undergone silicate liquid immiscibility (SLI), (e.g., [6,23,29,30]). This process occurs during the late-stage differentiation of Fe-rich terrestrial and lunar basalts, commonly producing coeval Fe-rich and Si-rich liquid compositions (e.g., [23,24,31]).
Mesostasis petrology, including associated phosphates, is not routinely described within studies that investigate mare basalts, in particular, the importance of SLI in relation to phosphates is often overlooked. Both immiscible fractions can crystallize apatite (Figure 1), thus, when using melt-mineral partition coefficients to estimate volatile abundance in the residual melt, it is important to know which immiscible conjugate liquid an apatite of interest crystallized from.
Within this contribution, we aim to better constrain the conditions under which phosphates such as apatite (ideally (F, Cl, OH) Ca5(PO4)3) and merrillite (ideally Ca9NaMg(PO4)7) crystallize within immiscible melts. This will enable a more effective understanding of how volatile elements partition into phosphates, ultimately allowing more robust H2O back-calculations for estimating magmatic water contents. To understand phosphate crystallization conditions, we present reaction balance calculations based on phase equilibria principles integrated with thermodynamic modeling, together with microtextural observations taken from [6] for two representative mesostasis pockets from Apollo basalts 10003,152 and 14053,241. These samples have been thoroughly characterized by detailed mineral analyses [6,32], displaying contrasting phosphate crystallization histories in one merrillite-poor (10003) and one merrillite-rich (14053) sample. This will enable us to (i) address the paragenesis of late-stage immiscible melts within mesostasis pockets and, in particular, in which immiscible fraction the various phosphates are expected to crystallize, (ii) explore how the residual melt (ResLiq) chemically fractionates its cations and volatiles into the different phases/glasses, which constrains the back-calculation of water content in the parent magma, and (iii) understand the pre- and/or post-SLI conditions of apatite crystallization and how this influences merrillite formation.
2. Methods and Rationale
The combination of mineral reaction balancing with mineral chemistry and microtextural observations is a powerful tool for understanding petrological systems. This method, that considers phase ratios rather than absolute quantities, is commonly utilized for constraining metamorphic reactions in migmatites and granulite-facies rocks [33,34,35]. It has the potential to yield important insights into the understanding of mineral-melt reactions that take place in petrologically complex domains such as mesostasis pockets. The evolution of a system is constrained through the identification of reactant and product phases within a given mineral assemblage. The phase compositions within the chemical system (components) define a square matrix representing a system of linear equations to balance each component (Table 1, Table 2 and Table 3), The reaction coefficients are derived through linear algebra calculations using the inverse matrix and matrix multiplication (e.g., 10 × 10 matrix in Table 1, see Section 4.2 and Section 5.2 for details). A balance can only be achieved in a pseudo-univariant system, which mathematically has a unique solution for non-degenerate systems, and therefore can only solve for n variables by having n independent equations. One reaction coefficient is set to 1, reducing the equations system to n - 1 equations for n variables (see also [36]). In order to balance reactions with variance >1, solid solution phases can be split into end-members (see the Ab-An-Or example of the multivariant reactions in Table 1), or one can use exchange vectors in phases of variable composition (e.g., Tschermak substitution). After the calculations, the phases can be reconstituted from the end-members and/or exchange vectors. The method requires (i) a detailed microtextural analysis, i.e., mineral mode and major-element chemistry for all phases within the micro-domain of interest, (ii) based on the phases rule, the definition of a simplified chemical system for each reaction within the micro-domain, (iii) proper reaction balancing, including the calculation of volume ratios of product phases, and (iv) rigorous quantification using thermodynamic software, whenever a database is properly designed, for lunar basalts in this case. Therefore, the present reaction balancing procedure, through a simple computer spreadsheet, allows one to quickly see what happens when a compositional variable is changed. For more examples using the balancing method applied here, see [34].
This combination of microtextural analysis, chemical (compositions and reaction balance), and petrological (coherent P-T estimates) constraints helps to distinguish between alternative reactions, and enables phases to be identified that have been fully consumed during crystallization (i.e., not present within the observed mineral assemblage).
Table 1 Example of mass balance in a 10-component chemical system, using phases observed in Apollo 11 sample 10003,152 and compositions determined by EMP, recalculated on a molar basis. For details and references, see the main text and Table S1.
In order to test how well the reaction-balance calculations are simulating the observed mineral assemblages, the calculated volume ratios of product phases can be compared with both the observed phase ratios and thermodynamic estimates. It is important to note that depending on the 2D cut of a 3D sample, the resulting ratios may change. Hence, we estimated volume ratios in several mesostasis pockets with the aim to better tackle this potential obstacle. Despite the issues surrounding volume-ratio estimations, such comparisons serve as a first-order test to validate or reject the reaction-balancing calculations. For instance, in the example reaction balance A + B = C + D, we compare whether the calculated volume ratio C/D matches the observed C/D ratio under the microscope.
Pressure-Temperature conditions of the mare basalts at the different evolutionary stages were estimated using the thermodynamic database of rhyolite-MELTS software v.1.2.0 [25,26], using input compositions which were obtained by integrating mineral chemistry and modes (Table S1) of each phase/glass within five different mesostasis microdomains. Whereas MELTS has not been specifically calibrated for investigating basalts under lunar conditions, it remains one the best tools to investigate lunar samples from a thermodynamic point of view. We modeled crystallization at low oxygen fugacity (typical for lunar magmas) of up to 1 log unit below the iron-wüstite buffer. This software accounts for the phases and residual glass(es) involved in the equilibrium crystallization during the magma cooling (see also Table 2, Figure 2 and Figure 3), except for F and Cl in apatite.
3. Mesostasis Petrology
To investigate mesostasis mineral-melt reactions we draw on the textures and mineral chemistry reported within the literature for two mesostasis pockets from lunar basalts 10003 and 14053 by [32] and [6], respectively. All major-element mineral compositions needed to conduct the reaction balancing calculations were taken from these two papers, and the full data set used, as well as the backscatter images and false-color x-ray maps of the mesostasis pockets investigated for petrographical context, are summarized in Figure 1. Below is a brief summary of the wider context of these samples together with a petrological summary of the mesostasis pockets.
3.1. Sample 10003 Petrology
The general petrology of basalt 10003 has been described in numerous papers [10,11,37]. It is an evolved high Ti-basalt with a bulk-rock Mg# = 100 × XMg/(XMg + XFe) of 32–38 [38], and a medium-grained sub-ophitic texture. In regions containing mesostasis pockets, the minerals are characterized by significant zoning from the core to rim: Plagioclase crystals typically change from 91% anorthite (An) in the core to 71% An at the rim. Similarly, clinopyroxenes typically display a strong zonation towards FeO-enriched rims (Mg# ~58 in the core and 12 at the rim). This sample does not contain pristine olivine phenocrysts, but olivine inclusions are commonly observed within clinopyroxene phenocrysts, indicating back-reaction of former olivine phenocrysts with melt into clinopyroxene [10].
The total mesostasis volume within this sample is ~ 0.8 vol% [11]. Combined false-color x-ray maps and BSE images for the representative mesostasis pockets investigated for 10003 (reported by [6]) are displayed in Figure 1a,b. Mesostasis pockets in this sample range in size from ~ 50 to 500 μm. A full petrographic description is found in [6] and is summarized here. Major element abundances for two mesostasis pockets are reported in the Supplementary Materials tables (Table S1). Typical mineral assemblages contain ‘globules’ of a Si-K-Ba-rich feldspathic glass (hereafter referred to as K-rich glass) set within a melt matrix of fayalite (Fa). These intergrowths (Figure 1) are commonly referred to as ‘sieve’ textures and are characteristic of conjugate immiscible liquids (SLI, [39,40,41]). The fayalite composition is relatively uniform (Fo < 10), whereas the K-glass displays significant chemical variations, ranging from dominantly rhyolitic to almost pure K-feldspar (K2O ranges from 3.3 to 11 wt%, and SiO2 from 55 to 78 wt%). We refer to the K-rich patches as ‘glass’ because they are locally isotropic in cross-polarized light. Minor, but important phases within the mesostasis pockets are apatite, small ilmenite, and SiO2 grains (Figure 1a,b). Hyalophane, a Ba-rich K-feldspar, is also locally present, as well as scarce merrillite.
Defining the extent of the mesostasis pockets can in some cases be ambiguous, particularly for phases such as ilmenite and SiO2. Microtextures cannot always distinguish as to whether they are part of the mesostasis assemblage or represent pseudo-eutectic phases from the main crystallization sequence. Similar to most lunar apatites in the literature, the apatites are predominantly F-rich [42]. The H2O content of the apatites has not been directly measured, thus we have estimated their content using stoichiometric constraints from the measured microprobe analyses of Cl and F (as detailed by [8]). Testing this method on apatite for which H2O was directly measured gave similar results (within 10% relative of SIMS analyses, see below). We note two microtextural occurrences of apatite within this sample, an observation not made by [6] (Figure 1a,b): (i) larger apatite aggregates (>100 μm) interstitial to pseudo-eutectic minerals (i.e., clinopyroxene, SiO2, plagioclase), and (ii) smaller (<50 μm), isolated euhedral crystals within the late-stage residual melt pockets (i.e., mesostasis pockets).
3.2. Sample 14053 Petrology
The petrology of 14053 has been previously described in [32,43,44,45]. This sample is a low-Ti, high-Al basalt, with similar Mg# ratios (~48) to other low-Ti basalts. Olivine, pyroxene, and plagioclase phenocrysts are present. Minor opaque phases (mainly Cr-rich spinel and ilmenite), phosphates, residual glasses (K-rich, fayalite-rich), and some high-T SiO2 polymorphs (cristobalite/tridymite) are also present. All phases show sub-ophitic textures that grade from medium-grained in early-crystallized phases to fine-grained in the mesostasis.
The total amount of mesostasis within this sample has been estimated at ~2.3 vol% [32]. Figure 1c,d shows the combined false-color x-ray maps and BSE images (from [6]) for the representative mesostasis pockets investigated. Mesostasis pockets in this sample range in size from ~ 50 to 500 μm. Full petrological descriptions are found in [6] and are summarized here. Minor, but important phases within the mesostasis pockets include phosphates (apatite, merrillite), small ilmenite, SiO2 polymorphs, and K-rich glass set within a melt matrix of fayalite (Fa) in a ‘sieve’ texture. The fayalite composition is relatively uniform (Fo < 10), whereas the K-rich glass displays significant chemical variations with K2O ranging from 0.6–12 wt% and SiO2 from 55–75 wt%. This sample has been exposed to extremely reducing conditions resulting from solar-wind implantation and subsequent impact-derived reheating, which has resulted in unique intergrowths within mesostasis pockets of Fe0 and SiO2, resulting from the isochemical breakdown of fayalite [32]. As these processes have mainly affected the exterior parts of the sample, we only consider reported mesostasis pockets from sections taken within the interior parts of the sample.
Defining the extent of the mesostasis pockets is subject to the same limitations as mentioned for sample 10003. Local merrillite, present within the mesostasis pockets (Figure 1d), is distinguished from apatite based on lower CaO and lower EMP totals, due to the high REE content of merrillite [6]. The H2O content of apatite within this sample (Table 1) has been determined in two ways: (i) direct SIMS analyses reported by [14] and [6], and (ii) estimates based on stoichiometric constraints from the measured Cl and F values (reported by [32] and [14], see [42] for method). As with sample 10003, we identify two microtextural occurrences of phosphates within this sample (Figure 1c,d, see also [6,32]): (i) isolated euhedral apatite crystals (up to 50 μm) within the residual melt pockets (i.e., mesostasis pockets), and (ii) local occurrence of apatite-merrillite intergrowths within microdomains of SLI (Figure 1d).
4. Reaction Balance of Sample 10003
4.1. Melt Compositions, and Choice of Chemical System
Prior to conducting the reaction balance calculations for the selected mesostasis pocket, we must first establish the melt compositions involved in each step within the reactions sequence as follows. Figure 1a,b displays a BSE and mixed x-ray maps of the mesostasis pocket investigated here. The parental melt (bulk) composition (Table 1) was calculated according to the integration of the mineral chemistry and modes (Table S1) of each phase/glass within five different mesostasis microdomains showing, for instance, ranges among them of SiO2 and FeO within 45–55 wt% and 8–25 wt%, respectively. We utilized the average value as input for the thermodynamical modeling (starting parental melt composition). This average composition is consistent with the bulk composition reported by [36]. It was recalculated into a molar composition on a 56 oxygen basis. The advantage of using an arbitrary, high number of oxygens (here: 56) lies in covering the high number of oxygen in “complex phases” such as silicate melts. Some thermodynamic software packages (e.g., Thermocalc and Perple_X) use 8 oxygen which then leads to cation fractions << 1. The higher number of oxygen allows us to restrict ourselves to 3 digits behind the decimal point.
The bulk composition of 10003 determines the chemical system for reaction balancing. To simplify the calculations and to allow some flexibility in terms of element exchange between adjacent minerals, we have grouped Fe + Mg + Mn, as well as F + Cl, as they have similar cation sizes and are known to exchange easily. We have neglected the influence of trace elements such as Y and REE, although they can have a strong influence on phosphate crystallization (see sample 14053). As apatite is the only relatively abundant accessory phase here, these elements are likely to partition strongly into this one phase, and we can neglect their influence on the balance.
The resulting chemical system has 8 oxide components (Table 1), namely those combining with Si, Ti, Al, (Mg + Fe + Mn), Ca, Na, K, P, and 2 fluid components: OH, (F + Cl). In order to balance a reaction within this system, 11 phases or phase components are needed and we normalize to one of these, giving it a stoichiometric coefficient equal to −1. Splitting some phases into end-members allows the calculation of equilibria with less than 11 phases, i.e., having a higher variance. For example, feldspars are split into An, Ab, and Or, apatite into OH-Apt (hereafter Apt) and (F+Cl)-Apt. This is easiest to do in calculations on a molar basis, so bulk analyses were also recast into molar values. We used the initial melt phase (parental melt composition, Table 1) for normalization in each reaction, which facilitates the modeling of successive reactions.
Projected onto the SiO2-Ol-Pl plane (Figure 2a,b), the qualitative reaction path from the parental melt composition to the pseudo-eutectic point can be predicted using established phase equilibria relationships. The main crystallization sequence can be summarized as:
- (a)
- crystallization of Ol, then Ol + Pl, then Ol + Pl + Cpx,
- (b)
- resorption of Ol and crystallization of more Cpx + Pl after passing the peritectic point,
- (c)
- crystallization of Cpx + Pl + SiO2 at the pseudo-eutectic point.
This sequence matches our thermodynamical modeling results (see Section 4.2 and Figure 2 and Figure 3), as well as the general crystallization trend reported by other studies [10,11,46,47] based on petrological observations. In order to model mesostasis crystallization (in the reaction sequence outlined in more detail below), we have started with a parental melt that produces a series of residual melts (ResLiq1, ResLiq2, ResLiq3) during partial crystallization (Figure 2b,c and Figure 3). The residual-melt composition for a given reaction is then used as the starting point for the second reaction, and so forth, thus maintaining full integrity of the system. As such, small changes in the first reaction will affect the stoichiometric coefficients of the last reaction, and provide a ‘reality check’ (examples highlighted below). Once the residual interstitial liquid reaches the pseudo-eutectic (i.e., ResLiq 3), this melt represents the precursor of the mesostasis pocket and is likely to have quenched and/or crystallized in a closed system. Thus, the bulk chemistry of the mesostasis pocket shown in Figure 1 is considered to reflect the composition of the mesostasis precursor melt (referred to here as ResLiq3, see below).
4.2. Bulk Mass Balance, Early Reactions and Thermodynamic Modeling
In order to test whether the chosen parental melt composition is realistic, we first conducted a mass balance calculation to see if the combination of mesostasis (ResLiq3) and the solid crystallized phases (phenocrysts and later minerals) observed with their average compositions (from [6]) can actually build the bulk-rock composition. This also serves as an example of how the method works (Table 1, Figure 2). The top half of the table gives the phase compositions, recalculated on a molar basis, defining a 10 × 10 matrix. The reaction coefficients are obtained by multiplying the inverse of this matrix with the 10 × 1 composition vector of the bulk sample. This 10 × 1 vector represents the bulk composition used for normalization, with a stoichiometric coefficient −1.
The results indicate that all phases have a positive stoichiometric coefficient, which shows that the linear combination of these 10 phases can indeed form the bulk composition. The detailed balance is:
1.199 Ol + 3.089 Cpx + 0.004 F-Apt + 0.001 Apt + 3.075 Ilm + 1.839 An + 0.195 Ab + 1.223 SiO2 + 0.083 ResLiq3 = 1 PM (“primary melt” = bulk)
This balance (Table 1) shows a good match with observed phase abundances, which suggests that phase compositions and modes are realistic. Actually (F + Cl)-Apt and Apt combine into a single apatite solid solution, and An and Ab together form plagioclase (Pl), increasing the variance of the system. The reaction coefficient of the theoretical phase “H2O in Liq” is zero, meaning it drops out of the equation and not that the liquid is anhydrous. It has therefore been left out of Table 2, which summarizes all balances calculated.
The crystallization steps predicted by Figure 2 can be modelled through successive reactions. Step (a) is summarized in the following balanced reaction (Table 2):
Parental Melt = Ol + Cpx + Pl + Ilm + Apt + ResLiq1
The calculated phase volume ratios (by thermodynamics and reaction balancing) for this reaction are consistent with the observed mineral modes reported by [6] for this stage (Figure 2c). The reaction balance (1) works best when the residual melt becomes slightly richer in Si, Al and Ca consistent with the expected phase equilibria (i.e., the residual melt moving towards the SiO2 apex in Figure 2a). Most ilmenite crystallized at this stage, although some late, fine-grained ilmenite is present in mesostasis domains indicating that minor late-stage ilmenite crystallization does occur. Some phases obtained a stoichiometric coefficient of zero in this and other balances (Table 2), indicating that fewer phases are needed for a proper balance (i.e., the phases with a zero coefficient do not take part in the reaction). To complement these calculations, we also computed thermodynamical modeling to test if what is observed in the mesostasis pocket compositions is coherent to magma differentiation through fractional crystallization processes (Figure 2c, Figure 3d). This has also provided constraints on the most likely H2O content under which these lunar magmas evolved (Table 2). The balance (including compositions and modes), in line with our thermodynamic results, yields P-T estimates of c. 1020 °C and 1.2 kbar. We input the data sets into the MELTS software and retrieved phenocrystic assemblages and abundances with chemical compositions for various T–P–H2O conditions. We finally compared the best fit of SiO2–T–P–H2O conditions between the calculated and the observed results for ResLiq and the main cotectic phases (Cpx and Ol). The output composition from our thermodynamic calculations for ResLiq3 is ~ 10% higher in SiO2 than the amount used in the reaction balance, possibly due to software limitations. We input F, Cl, and H2O until equilibria 3 and 4 were achieved with coherent product ratios (i.e., matching the observations) while respecting the crystallographic limits for each mineral phase. This explains the presence of two apatite phases (water-absent F-Apt, and halogen-absent Apt).
The increasingly Si-K-enriched residual liquid, ResLiq1, eventually reacted during step (b) with phenocrystic olivine when it became metastable:
ResLiq1 + Ol ± Ilm = Cpx + Pl + Apt + ResLiq2
This is a common reaction within basaltic systems, which occurs just beyond the peritectic point within the (projected) Fa-SiO2 system (Figure 2a). This is consistent with textural observations whereby olivine is only present as inclusions within clinopyroxene. Reaction (2) produces volume ratios of product phases that match the observed ratios.
The final reaction represents crystallization at the pseudo-eutectic in step (c), where SiO2 is produced. It is at this the stage that the residual melt (ResLiq3) can fill the space between the earlier formed crystals forming mesostasis pockets. The balanced reaction is:
ResLiq2 = Cpx + Pl + SiO2 + Apt + ResLiq3
The balance is in line with the thermodynamic modeling results that additionally indicate conditions of 860 °C and 1 kbar. In a real eutectic point, the melt composition would not change. However, Figure 2a is merely a 3-component projection in 10-component compositional space, so the point is, in reality, a pseudo-eutectic.
4.3. Mesostasis Reactions
Based on textural observations, during or just after the formation of ResLiq3, the residual melt splits into two immiscible components (SLI), a K-Si-rich melt fraction (“K-Liq”) and a mafic fraction (“Fa-Liq”). This balance can be simply written as:
ResLiq3 = K-liq + Fa-liq
From this stage onwards, the two melts evolved independently and solidified as separate assemblages with crystalline phases and glass. Based on our phase balancing (Table 2), the Fa-rich melt solidified as follows:
and the felsic melt solidified via:
Fa-liq = Fa + Pl + Apt ± H2O ± Ilmenite
K-liq = K-rich glass + Pl + SiO2 + Apt ± Kfs ± H2O
We are aware that crystallization and degassing processes have significant yet opposite influence on the water abundances from mesostasis domains, i.e., (i) magmas reaching upper crustal levels exsolve gases as solubility of volatiles strongly decreases, (ii) degassing is consistent with a drop of water content along crystallization of cotectic phases, and (iii) at the time of the mare basalt cooled down, processes such as cotectic crystallization, degassing and water diffusion might affect the water balance in the system. Yet, degassing mechanisms and quantification are beyond the aim of this paper, and regardless, it does not change the modal abundance of solid products. Hence, in the balanced reaction, we input into the starting matrix the contents of F + Cl and H2O of ResLiq3 until achieving equilibria (3) and (4), and no H2O excess is produced. This provides constraints on the initial F/OH ratio of the closed basaltic system. We obtained a water deficit in the final K-Liq and Fa-Liq if the ratio was too low, and water excess if it was too high. Depending on variations in Ca and P, the optimum (F + Cl)/OH molar ratio turned out to be ~ 5. This implies that the average H2O content of apatite from this sample is about 0.17 moles on a 12.5 oxygen formula, or ~ 2700 ppm H2O. This is in the same order of magnitude as the water content that can be calculated from apatite analyses given in [6] (Table 1).
Consistent with petrological observations (Figure 1), two generations of apatite are supported by these reactions. A main-stage apatite is predicted by reactions (1)–(3) and a ‘mesostasis apatite’ is predicted by reactions (5) and (6). Furthermore, these calculations demonstrate that the ‘mesostasis’ apatite can be associated with either mafic or felsic immiscible liquids. The calculated volume ratios for product phases of reactions (5) and (6) match the observed values: Apt/Pl in crystallized Fa-Liq and K-Liq have ratios of 0.1 and 0.9, respectively (Table 2). Interestingly, the balance result indicates that K-feldspar is not forming, although some Kfs (sanidine) may have crystallized from K-glass. This is consistent with the scarcity of K-feldspar sensu stricto within mesostasis pockets. Another result of reaction balancing is that the volume ratios give the best match when allowing some H2O within the glass phases that solidified from the residual liquids.
5. Reaction Balance of Sample 14053
5.1. Defining the Chemical System for the Parental Melt and Mesostasis Reactions
In order to assess whether or not merrillite crystallized prior to apatite, and where it may have grown locally as the only phosphate within some mesostasis pockets, we conducted similar reaction balancing for merrillite-bearing sample 14053. Figure 1c,d displays BSE and combined x-ray maps for the mesostasis pocket selected. Before conducting the reaction balance calculations, we first established the chemical system (number of phases and components) and the composition of the residual interstitial liquid that forms the precursor of the mesostasis pocket. This is done by matching the cotectic phenocryst compositions with those obtained through thermodynamic modeling of the parent melt composition (Table 3).
The bulk rock composition was constrained from [43] and [48] for major elements but taking the slightly higher value for P from [49], Y from [49], and REE from [48] and [50]. The averaged mineral and glass compositions are from [32]. Additionally, a Pl component was added to the mesostasis (50% An) to attain a realistic basaltic composition (equal volume as Fa). Based on [2], apatite is considered to contain about 10% of the REE relative to merrillite, with a similar inter-element REE pattern. Cpx has a lower REE content than the phosphates, predominantly containing the HREEs relative to the LREEs. Similarly, Pl has a much lower REE content than the phosphates and predominantly contains Eu and LREE. Hence, Cpx and Pl together have REE concentrations (except Eu) several times lower than apatite. The Y+REEs were assigned to apatite using the exchange mechanism Ca + P = > YREE + Si (called REY-Apt). We considered a substantial amount of Y+REE to reside in Cpx, Pl, Ilm, Ol, and reduced the bulk Y+REE in the balance at around 20%. The molar volumes used for SiO2, Cpx and Ol correspond to tridymite, pigeonite, and forsterite, respectively. The mineral modes utilized for comparison, combine data from [43] and [51] (sample interior only).
Table 2 Mass balance and thermodynamics on Apollo 11 10003,152 in a 10-component chemical system. Each balance involves 11 phases (minerals, melts) or phase components (e.g., feldspar end members Ab, An, Or). The top half of the table gives the phase compositions, recalculated on a molar basis. The lower half gives reaction coefficients for each phase in each balance. "--" means a phase is not used in that particular balance. The first balance comes from Table 1. For details and references, see main text.
The oxide components defining the chemical system are similar to 10003 (Si, Ti, Al, Mg, Fe, Mn, Ca, Na, K, P, and two volatile components: OH, [F + Cl]). However, here we also include Y and REE, as they are major components of merrillite. To allow some flexibility of element exchange between adjacent minerals, we have grouped Fe + Mg + Mn, as well as F + Cl, and Y+REE. The last two groups have a strong influence on phosphate crystallization (e.g., [2]). To balance a reaction with the 11 oxide components, 12 phases or phase components are needed. Similar to the calculations for 10003 we split feldspars into An, Ab and Or, apatite into hydrous Apt and F-Apt, and merrillite into Ca-Merr and REE-Merr. The easiest way to conduct these calculations is on a molar basis, so bulk analyses were also recast into molar values.
As in the previous sections, for each reaction, there is a stoichiometric coefficient equal to −1 when normalized, and we used the initial melt phase for normalization in the first balance. As in sample 10003, crystallization of the parental melt in the first reaction produces a residual liquid that evolves into the final residual melt (mesostasis). The subsequent reaction sequence (detailed below) starts with this last residual melt.
On this basis, the reaction balance for the crystallization of the parental melt (Table 3) is:
Parental melt = > Residual-liquid + Ol(Fa) + Cpx + Ilm + Pl + SiO2
This reaction is consistent with petrographic observations, and the calculated phase volume ratios are in line with reported mineral modes. A textural complication that affects volume ratios with olivine, is that some olivine grains are enclosed by clinopyroxene and should be considered as phenocrysts that have back-reacted with the melt to produce clinopyroxene, similar as in sample 10003. However, the net effect of such a two-stage process gives the same balance as in reaction (A). Notably, no phosphates are formed at this stage, by contrast with sample 10003.
5.2. Residual Mesostasis Reactions
As with sample 10003, the mesostasis mineral assemblage is described by a sequence of reactions involving successive residual liquids (Table 3), starting with reaction A. The next step is the splitting of the residual melt (i.e., SLI), without the involvement of the pseudo-eutectic minerals, into a K-rich and Si-rich melt fraction (K-liq) and a mafic fraction (Fa-liq):
Residual-liquid (Mesostasis) = Fa-liq + K-liq
From this stage onwards, as with sample 10003, the two melts evolved independently and solidified as separate assemblages with crystalline phases and glass. For this sample, the Fa-rich melt solidified as follows:
Fa-liq = Fa + Pl + Apt + Merr
K-liq = K-glass
Reaction C is able to account for the intergrowths of phosphates observed in the microtextures. The calculated volume ratios match the observed values: Apt/Pl and Apt/Merr are 0.27 and 4.4, respectively (Table 3). The clear dominance of Apt over Merr also matches the thermodynamic modeling predictions and the observation that some Apt occurs as isolated crystals, whereas other grains are intergrown with Merr (e.g., Figure 1d). Interestingly, the thermodynamic results, despite all limitations to model phosphate equilibria, reveal that both phosphates (apatite and merrillite) can form together at c. 1080 °C and 3–4 kbar.
As with 10003, K-feldspar is not predicted to form, although some Kfs may have crystallized from K-glass, which is in line with the scarcity of K-feldspar sensu stricto within mesostasis pockets. We constrained the Apt/Mer volume ratio to be ~ 4.4 on the basis of bulk and mineral Y+REE, Ca, P and halogen contents during our phase balancing. These mass balance calculations suggest that sample 14053 has a bulk water content of 15 to 35 ppm H2O, based on phosphates only.
6. Discussion
6.1. The Onset of SLI in Lunar Basalts
Following the crystallization of olivine, plagioclase, and clinopyroxene, the residual liquid (ResLiq2) is driven towards the pseudo-eutectic, the composition of which in some cases enters into the SLI field (ResLiq3). This results in the separation of conjugate mafic and felsic liquids (reaction 3), creating the classic immiscible ‘sieve’ texture observed in the samples investigated here. However, in general, the lunar SLI field is poorly defined, in part due to the sensitivity of SLI to conditions such as fO2, H2O and FeO content (e.g., [41,52]). Thus, whether any given sample undergoes SLI is likely to reflect highly localized conditions, potentially even within individual mesostasis pockets. During the rapid cooling of the final melt fraction, local compositional gradients are expected to be preserved, as has been observed in terrestrial melting (e.g., [53]). This is observed in some large patches of K-glass, that are found along the edges of mesostasis pockets and are characterized by low FeO content (< 1 wt%), relative to the K-glass analyzed that is associated with the ‘sieve’ textures (>1 wt%, Figure 4). The low-FeO/high-K glass may have crystallized via reaction (2), i.e., represent ResLiq2. However, the high-FeO glass may represent the ‘true’ product of SLI, developing in the mingling zone of the two immiscible liquids. The control of FeO was highlighted by [6], accounting for why some lunar samples lack evidence for SLI (e.g., 70035, 12018). Indeed, if reactions are balanced using an interstitial liquid with a low Fe + Mg content (c. < 0.19 moles), then late olivine (fayalite) is not predicted to be present within the mesostasis assemblage (i.e., no SLI). We note in our reaction balance calculations that small compositional variations within analytical uncertainty (which for EPMA analyses are typically < 1%) can also shift Apt from a reactant phase to a phase that is crystallizing. This underscores the fact that minor changes in chemistry can have large effects on the local microdomain equilibria, and the resulting crystallizing assemblage within a mesostasis pocket.
6.2. Phosphate OH/Halogen Ratios
An important factor to highlight for the reactions presented above is that depending on the composition of the ‘primary’ apatite from the main crystallizing sequence (e.g., reaction 1), the secondary ‘mesostasis’ apatite will be either poorer in [Cl + F] (thus richer in H2O) than the ‘primary’ apatite, or vice versa. Some studies have postulated that felsic melts may be generally enriched in H2O over F and Cl, i.e., F and Cl preferentially partition into the mafic fraction during SLI, resulting in apatites with higher OH/F and OH/Cl values within the felsic conjugate liquid [54,55]. Indeed, such partitioning behavior was suggested to occur following the identification of almost pure hydroxy-apatite (up to 16700 ppm H2O) in apatites associated with plagioclase and silica assemblages in the brecciated lunar meteorite NWA 773 [54]. This is generally consistent with the results of our reaction balancing, which requires H2O to be present within the starting residual felsic-liquid (ResLiq1), to better match the volume ratios of the newly grown phases. However, following the separation of immiscible liquids, P2O5 is thought to partition largely into the mafic conjugate liquid [6,56,57]. Thus, in view of the proposed volatile partitioning above, any newly formed apatite associated with the mafic fraction is likely to have lower OH/F values relative to ‘felsic’ apatites. Indeed, this is consistent with reported mare basalt apatites, which are generally F-rich, relative to other lunar lithologies [8]. Furthermore, the Fa-Liq/K-liq ratios observed in our calculations, which average ~2 for all mesostasis pockets, are consistent with the calculated ratios. Attempting to shift some hydrous apatite components to Fa-Liq resulted invariably in an H2O deficit in K-Liq (i.e., the ‘mafic’ apatite is required to contain a hydrous component). The balance may also be influenced by the local enrichment of residual melts in REE elements, which tends to favor apatite and may also lead to local merrillite crystallization. Merrillite tracking through sample 14053 (see next section) has served as an important clue in order to test the relative order of halogen versus hydroxyl depletion in a lunar melt. Merrillite, a volatile-free and REE-rich phosphate, can in some lunar basalts display complex intergrowths with apatite (Figure 1d). However, due to its scarcity within 10003, its influence is negligible in that sample.
Overall, the occurrence of several generations of apatite unambiguously illustrates the need to consider the petrological context in order to apply the correct partition coefficients during volatile back-calculations. Importantly, the ‘primary’ generation of apatite, which crystallized from a mafic melt, will require distinct partition coefficients from the generation of apatite associated with the later felsic fractions.
6.3. REE Budget
To achieve a balance of Y+REE for the reactions in 14053, it was necessary to introduce a factor that lowers the bulk Y+REE budget that can be attributed to phosphates. Some Y+REE may also reside in both the small baddeleyite grains that are locally present and the (pseudo-) cotectic phases that crystallized from the parental melt. When using data from [2 within Figure 1], almost 80% of Y+REE could reside in the (pseudo-) cotectic phases, but this value hampered a proper balance. Instead, at 20% the balance was coherent and we, therefore, conclude that the average Y+REE concentrations in phases like olivine must be a factor 100 lower than the (maximum?) values reported. This, in turn, is generally consistent with the low partition coefficients for REE between melt and olivine [58]. In our view, this result is not surprising, because in terrestrial granites 60% of the REE may reside in accessory phases (e.g., [59]).
6.4. Estimating the OH Content of Lunar Mare Basalts and the Lunar Mantle
If apatite was the only phosphate in lunar basalts and the only hydrous phase (and assuming it was in equilibrium with the melt), the H2O content of the basaltic magma could be estimated directly from its Cl and F content. However, this is not that case, because some phosphates are present in the form of anhydrous merrillite ([2,9], but see below), thus lowering the estimated H2O content. Furthermore, [17] reported 20–30 ppm water in olivine and plagioclase from Apollo basalts. In the terrestrial mantle, the partitioning of water between pyroxene and olivine in the FMASH and FMSH systems increasingly favors pyroxene with decreasing pressure [60]. However, this result cannot be extrapolated to lunar samples due to the strong differences in the pressure conditions. Despite this, the water content in Cpx is positively correlated with tetrahedral Al [61] and water partitioning between Cpx and Ol is thus likely to favor Cpx. In turn, Cpx will likely contain higher water abundance relative to co-existing Ol. Therefore, based on the H2O concentrations and the abundances in Table 1, the minimum contribution of cotectic phases in lunar basalts to the total H2O budget may equal ~14–20 ppm. Such an abundance is likely to be of similar (or higher) magnitude as that of apatite.
The contribution of cotectic phases to the water budget, highlighted above, must be viewed with some caution and is likely to vary greatly between different mesostasis pockets. A possible reason for the large discrepancy may be that only values above the detection limits are generally reported. Thus, abundances reported may represent maximum values rather than average values. If this cautionary note holds true, then the water content of lunar samples 14053 and 10003 may be anywhere between ~14 and 35 ppm (i.e., ~15–35 and ~14–20 ppm, respectively). The H2O content of minerals derived from crystallized melts is determined by the amount of H2O in the parental melt, the degree of differentiation, and the amount of degassing [18,62]. Although we have no constraints on the third factor, it probably has the largest uncertainty. Therefore, not taking into account the low-P degassing process, our H2O estimates for 14053 and 10003 represents a lower limit for the lunar mare basalt mantle reservoir in these regions. These estimates imply a very high crystallization temperature (1020–1080 °C), which is consistent with the presence of tridymite and cristobalite and clinopyroxene compositions above the Cpx-Opx solvus in these samples. Our calculations are consistent with mantle source estimates for Apollo 14 and Apollo 11 source regions (5 to 28 ppm H2O) based only on apatite partitioning behavior [8]. Notably, this value is higher compared to recent estimates of the bulk lunar mantle based on a complication of reported lunar water abundances (0.15–5.3 ppm H2O, [8]) indicating that the mare basalt source regions are more hydrated than mantle regions under the lunar highlands. In other words, our results estimate the water amount in the mare basalt, which is far from being an estimate of the average of the bulk lunar reservoirs, as these distinct reservoirs may have totally different water contents [8]. Overall, the consistency of the water estimates calculated here with the estimates derived from direct measurements highlights the validity of this approach as a non-destructive method for assessing lunar water budgets.
Interestingly, a similar debate raged during the 1990s over the water content of terrestrial komatiites. Experimental, mineralogical and textural arguments were used by all contenders. [63] summarized the arguments in a seminal review paper and opted for the nearly dry, high-temperature scenario, although they admitted that local amphibole and rare vesicular textures could indicate locally wet conditions. By analogy, in our view, the lack of amphiboles and micas within mesostasis regions limits the water content of the lunar basalts, as does the scarcity of vesicular textures within 14053. Some basalts from several Apollo missions are vesicular, however. For instance, Apollo sample 15556 contains up to 50% vesicles by volume [64], indicating that localized water (and/or other volatiles) enrichment may exist.
7. Conclusions
We highlight a non-destructive method of phase equilibria reaction balancing as a tool for exploring light on the volatile-element partitioning during the petrological evolution of interstitial mesostasis pockets within lunar basalts. This method acts as a complementary tool to direct measurements of volatiles.
Table 3 Mass balance and thermodynamics on Apollo 14 14053,241 in an 11-component chemical system. Each balance involves 12 phases (minerals, melts) or phase components. The top half of the table gives the phase compositions, recalculated on a molar basis. The lower half gives reaction coefficients for each phase in each balance. "--" means a phase is not used in that particular balance. For details and references, see main text.
Within lunar basalts, typically conducted using SIMS methods. The following conclusions about lunar phosphate petrology can be drawn from the reaction balancing:
- Modeling the mesostasis mineral assemblage for Apollo sample 10003, the reaction-balancing matches well the observed mineral modes in the context that the residual Si-K-rich liquid is the major H2O-bearing phase. The calculations indicate the occurrence of several generations of apatite potentially occurring within both the mafic and felsic immiscible melt fractions, each with its own H2O-halogen ratio. This carries important implications for the interpretation of apatite volatile chemistry, e.g., selecting appropriate partition coefficients. Our results present a way to track the apatite crystallization history, leading to more robust magmatic H2O back-calculations from lunar apatite.
- By contrast, only one generation of apatite (associated with the mesostasis pocket) crystallized in Apollo sample 14053. The calculations suggest that the bulk sample contains between 15 to 35 ppm H2O, which is consistent with estimates for the mantle source region of 14053 from [8].
- Our calculations indicate a discrepancy between H2O values reported for single minerals and whole-rock contents. The reason may be that only values above the detection limits are commonly reported, rather than average values. We suggest that in many geochemical studies, it may be a useful exercise to compare bulk rock analyses with phase compositions and modal abundances to detect potential discrepancies. It may also be a way of detecting non-equilibrated, heterogeneous trace element distributions.
Supplementary Materials
The following are available online at https://www.mdpi.com/2076-3263/9/10/421/s1, Table S1: Mineral compositions of mesostasis pockets.
Author Contributions
A.M.Á.-V. and J.F.P.-F. conceived the study, suggested the hypothesis and produced the figures. L.M.K. and A.M.Á.-V. computed the mass balances and thermodynamic calculations. A.M.Á.-V., J.F.P.-F., and L.M.K. interpreted the data and wrote the paper.
Funding
This research was supported by an STFC consolidated grant ST/M001253/1 to the University of Manchester through P-F and a research grant to A-V under the “José Castillejo” program (CAS14-00189; MEC – Spanish Government) at the University of Manchester. We also thank the funding support of projects VOLGASDEC (PGC2018-095693-B-I00) (MINECO), and USAL-2019 (Programa Propio - mod. 1B) through A-V, as well as the assistance of the Stable Isotopes Laboratory (NUCLEUS) at University of Salamanca.
Acknowledgments
We appreciate the constructive and in-depth comments by three anonymous reviewers, and especially by the Guest Editor, Matt Whitaker, that greatly helped to improve this contribution.
Conflicts of Interest
The authors declare no competing interest.
References
- Jolliff, B.L.; Haskin, L.A.; Colson, R.O.; Wadhwa, M. Partitioning in REE saturating minerals: Theory, experiment, and modeling of whitlockite, apatite, and evolution of lunar residual magmas. Geochim. Cosmochim. Acta 1993, 57, 4069–4094. [Google Scholar] [CrossRef]
- Jolliff, B.L.; Hughes, J.M.; Freeman, J.J.; Zeigler, R.A. Crystal chemistry of lunar merrillite and comparison to other meteoritic and planetary suites of whitlockite and merrillite. Am. Mineral. 2006, 91, 1583–1595. [Google Scholar] [CrossRef]
- McSween, H.Y.; Eisenhour, D.D.; Taylor, L.A.; Wadhwa, M.; Crozaz, G. QUE94201 shergottite: Crystallization of a Martian basaltic magma. Geochim. Cosmochim. Acta 1996, 60, 4563–4569. [Google Scholar] [CrossRef]
- Hughes, J.M.; Jolliff, B.L.; Gunter, M.E. The atomic arrangement of merrillite from the Fra Mauro Formation, Apollo 14 lunar mission: The first structure of merrillite from the Moon. Am. Mineral. 2006, 91, 1547–1552. [Google Scholar] [CrossRef]
- Boyce, J.W.; Tomlinson, S.M.; McCubbin, F.M.; Greenwood, J.P.; Treiman, A.H. The lunar apatite paradox. Science 2014, 344, 400–402. [Google Scholar] [CrossRef] [PubMed]
- Pernet-Fisher, J.F.; Howarth, G.H.; Liu, Y.; Chen, Y.; Taylor, L.A. Estimating the lunar mantle water budget from phosphates: Complications associated with silicate-liquid-immiscibility. Geochim. Cosmochim. Acta 2014, 144, 326–341. [Google Scholar] [CrossRef]
- Shearer, C.K.; Burger, P.V.; Papike, J.J.; McCubbin, F.M.; Bell, A.S. Crystal chemistry of merrillite from Martian meteorites: Mineralogical recorders of magmatic processes and planetary differentiation. Meteor. Planet. Sci. 2015, 50, 649–673. [Google Scholar] [CrossRef]
- McCubbin, F.M.; Kaaden, K.E.V.; Tartèse, R.; Klima, R.L.; Liu, Y.; Mortimer, J.; Elardo, S.M. Magmatic volatiles (H, C, N, F, S, Cl) in the lunar mantle, crust, and regolith: Abundances, distributions, processes, and reservoirs. Am. Mineral. 2015, 100, 1668–1707. [Google Scholar] [CrossRef]
- Xie, X.; Yang, H.; Gu, X.; Downs, R.T. Chemical composition and crystal structure of merrillite from the Suizhou meteorite. Am. Mineral. 2016, 100, 2753–2756. [Google Scholar] [CrossRef]
- Beaty, D.W.; Albee, A.L. Comparative petrology and possible genetic relations among the Apollo 11 basalts. In Proceedings of the 9th Lunar and Planetary Science Conference, New York, NY, USA, 13–17 March 1978. [Google Scholar]
- Gamble, R.P.; Coish, R.A.; Taylor, L.A. The consanguinity of the oldest Apollo 11 mare basalts. In Proceedings of the 9th Lunar and Planetary Science Conference, New York, NY, USA, 13–17 March 1978. [Google Scholar]
- Sharp, Z.D.; Shearer, C.K.; McKeegan, K.D.; Barnes, J.D.; Wang, Y.Q. The chlorine isotope composition of the Moon and implications for an anhydrous mantle. Science 2010, 329, 1050–1053. [Google Scholar] [CrossRef]
- Paniello, R.C.; Day, J.M.; Moynier, F. Zinc isotopic evidence for the origin of the Moon. Nature 2012, 490, 376–379. [Google Scholar] [CrossRef] [PubMed]
- Boyce, J.W.; Liu, Y.; Rossman, G.R.; Guan, Y.; Eiler, J.M.; Stolper, E.M.; Taylor, L.A. Lunar apatite with terrestrial volatile abundances. Nature 2010, 466, 466–469. [Google Scholar] [CrossRef] [PubMed] [Green Version]
- McCubbin, F.M.; Steele, A.; Hauri, E.H.; Nekvasil, H.; Yamashita, S.; Hemley, R.J. Nominally hydrous magmatism on the Moon. Proc. Nat. Acad. Sci. USA 2010, 107, 11223–11228. [Google Scholar] [CrossRef] [PubMed] [Green Version]
- Greenwood, J.P.; Itoh, S.; Sakamoto, N.; Warren, P.; Taylor, L.; Yurimoto, H. Hydrogen isotope ratios in lunar rocks indicate delivery of cometary water to the Moon. Nat. Geosci. 2011, 4, 79–82. [Google Scholar] [CrossRef] [Green Version]
- Liu, Y.; Mosenfelder, J.L.; Guan, Y.; Rossman, G.R.; Eiler, J.M.; Taylor, L.A. SIMS analysis of water abundance in nominally anhydrous minerals in lunar basalts. In Proceedings of the 43rd Lunar and Planetary Science Conference, The Woodlands, TX, USA, 19–23 March 2012. [Google Scholar]
- Tartèse, R.; Anand, M.; Barnes, J.J.; Starkey, N.A.; Franchi, I.A.; Sano, Y. The abundance, distribution, and isotopic composition of Hydrogen in the Moon as revealed by basaltic lunar samples: Implications for the volatile inventory of the Moon. Geochim. Cosmochim. Acta 2013, 122, 58–74. [Google Scholar] [CrossRef]
- Barnes, J.J.; Tartèse, R.; Anand, M.; McCubbin, F.M.; Franchi, I.A.; Starkey, N.A.; Russell, S.S. The origin of water in the primitive Moon as revealed by the lunar highlands samples. Earth Planet. Sci. Lett. 2014, 390, 244–252. [Google Scholar] [CrossRef]
- Chen, Y.; Zhang, Y.; Liu, Y.; Guan, Y.; Eiler, J. Water, fluorine, and sulfur concentrations in the lunar mantle. Earth Planet. Sci. Lett. 2015, 427, 37–46. [Google Scholar] [CrossRef] [Green Version]
- Hui, H.J.; Peslier, A.H.; Zhang, Y.X.; Neal, C.R. Water in lunar anorthosites and evidence for a wet early Moon. Nat. Geosci. 2013, 6, 177–180. [Google Scholar] [CrossRef]
- Konecke, B.A.; Fiege, A.; Simon, A.C.; Holtz, F. Cryptic metasomatism during late-stage lunar magmatism implicated by sulfur in apatite. Geology 2017, 45, 739–742. [Google Scholar] [CrossRef]
- Roedder, E.; Weiblen, P.W. Silicate liquid immiscibility in lunar magmas, evidenced by melt inclusions in lunar rocks. Science 1970, 167, 641–644. [Google Scholar] [CrossRef]
- Philpotts, A.R. Compositions of immiscible liquids in volcanic rocks. Contrib. Mineral. Petrol. 1982, 80, 201–218. [Google Scholar] [CrossRef]
- Ghiorso, M.S.; Sack, R.O. Chemical mass transfer in magmatic processes. IV. A revised and internally consistent thermodynamic model for the interpolation and extrapolation of liquid-solid equilibria in magmatic systems at elevated temperatures and pressures. Contrib. Mineral. Petrol. 1995, 119, 197–212. [Google Scholar] [CrossRef]
- Asimow, P.D.; Ghiorso, M.S. Algorithmic modifications extending MELTS to calculate subsolidus phase relations. Am. Mineral. 1998, 83, 1127–1131. [Google Scholar] [CrossRef]
- Longhi, J. Comparative liquidus equilibria of hypersthene-normative basalts at low pressure. Am. Mineral. 1991, 76, 785–800. [Google Scholar]
- Davenport, J.D.; Longhi, J.; Neal, C.R.; Bolster, D.; Jolliff, B.L. Simulating Planetary Igneous Crystallization Environments (SPICEs): A Suite of Igneous Crystallization Programs. In Proceedings of the 45th Lunar and Planetary Science Conference, The Woodlands, TX, USA, 17–21 March 2014. [Google Scholar]
- Taylor, L.A.; Kullerud, G.; Bryan, W.B. Opaque mineralogy and textural features of Apollo 12 samples and a comparison with Apollo 11 rocks. In Proceedings of the 1971 Lunar Science Conference, Houston, TX, USA, 11–14 January 1971. [Google Scholar]
- Charlier, B.; Namur, O.; Toplis, M.J.; Schiano, P.; Cluzel, N.; Higgins, M.D.; Vander Auwera, J. Large-scale silicate liquid immiscibility during differentiation of tholeiitic basalt to granite and the origin of the Daly gap. Geology 2011, 39, 907–910. [Google Scholar] [CrossRef]
- Potts, N.J.; Tartèse, R.; Anand, M.; Westrenen, W.V.; Griffiths, A.A.; Barrett, T.J.; Franchi, I.A. Characterization of mesostasis regions in lunar basalts: Understanding late-stage melt evolution and its influence on apatite formation. Meteor. Planet. Sci. 2016, 51, 1555–1575. [Google Scholar] [CrossRef] [Green Version]
- Taylor, L.A.; Patchen, A.; Mayne, R.G.; Taylor, D.H. The most reduced rock from the moon, Apollo 14 basalt 14053: Its unique features and their origin. Am. Mineral. 2004, 89, 1617–1624. [Google Scholar] [CrossRef]
- Kriegsman, L.M.; Hensen, B.J. Back reaction between restite and melt: Implications for geothermobarometry and pressure–temperature paths. Geology 1998, 26, 1111–1114. [Google Scholar] [CrossRef]
- Álvarez-Valero, A.M.; Kriegsman, L.M. Chemical, petrological and mass balance constraints on the textural evolution of pelitic enclaves. Lithos 2010, 116, 300–309. [Google Scholar] [CrossRef]
- Álvarez-Valero, A.M.; Gómez-Barreiro, J.; Alampi, A.; Castiñeiras, P.; Martínez-Catalán, J.R. Local isobaric heating metamorphic history in the lower crust of a Variscan exotic unit (NW Spain). Lithosphere 2014, 6, 409–418. [Google Scholar] [CrossRef]
- Thompson, J.B. Composition space: An algebraic and geometric approach. In: Ferry J.M. (Ed.), Characterization of Metamorphism through Mineral Equilibria. Rev. Mineral. 1982, 10, 1–32. [Google Scholar]
- McGee, P.E.; Warner, J.L.; Simonds, C.H. Introduction to the Apollo collections. Part 1: Lunar igneous rocks. NASA STI/Recon Tech. Rep. 1977, 77, 22034. [Google Scholar]
- Meyer, C. Lunar Sample Compendium. 2011. Available online: http://curator.jsc.nasa.gov/lunar/compendium.cfm (accessed on 26 September 2019).
- Rutherford, M.J.; Hess, P.C.; Daniel, G.H. Experimental liquid line of descent and liquid immiscibility for basalt 70017. In Proceedings of the 5th Lunar and Planetary Science Conference, Houston, TX, USA, 18–22 March 1974. [Google Scholar]
- Neal, C.R.; Taylor, L.A. Metasomatic products of the lunar magma ocean: The role of KREEP dissemination. Geochim. Cosmochim. Acta 1989, 53, 529–541. [Google Scholar] [CrossRef]
- Charlier, B.; Grove, T.L. Experiments on liquid immiscibility along tholeiitic liquid lines of descent. Contrib. Mineral. Petrol. 2012, 164, 27–44. [Google Scholar] [CrossRef] [Green Version]
- McCubbin, F.M.; Jolliff, B.L.; Nekvasil, H.; Carpenter, P.K.; Zeigler, R.A.; Steele, A.; Lindsley, D.H. Fluorine and chlorine abundances in lunar apatite: Implications for heterogeneous distributions of magmatic volatiles in the lunar interior. Geochim. Cosmochim. Acta 2011, 75, 5073–5093. [Google Scholar] [CrossRef]
- Gancarz, A.J.; Albee, A.L.; Chodos, A.A. Petrologic and mineralogic investigation of some crystalline rocks returned by Apollo 14 mission. Earth Planet. Sci. Lett. 1971, 12, 1–18. [Google Scholar] [CrossRef]
- El Goresy, A.; Taylor, L.A.; Ramdohr, P. Fra Mauro crystalline rocks: Mineralogy, geochemistry, and subsolidus reduction of the opaque minerals. In Proceedings of the 3rd Lunar Science Conference, Houston, TX, USA, 10–13 January 1972. [Google Scholar]
- Papike, J.J.; Hodges, F.N.; Bence, A.E.; Cameron, M.; Rhodes, J.M. Mare basalts: Crystal chemistry, mineralogy and petrology. Rev. Geophys. Space Phys. 1976, 14, 475–540. [Google Scholar] [CrossRef]
- Haggerty, S.E.; Boyd, F.R.; Bell, P.M.; Finger, L.W.; Bryan, W.B. Opaque minerals and olivine in lavas and breccias from Mare Tranquillitatis. Geochim. Cosmochim. Acta Supp. 1970, 1, 513. [Google Scholar]
- Bailey, J.C.; Champness, P.E.; Dunham, A.C.; Esson, J.; Fyfe, W.S.; Mackenzie, W.S.; Zussman, J. Mineralogy and petrology of Apollo 11 lunar samples. Geochim. Cosmochim. Acta Supp. 1970, 1, 169. [Google Scholar]
- Hubbard, N.J.; Gast, P.W.; Rhodes, J.M.; Bansal, B.M.; Wiesmann, H.; Church, S.E. Non mare basalts: Part II. In Proceedings of the 3rd Lunar Science Conference, Houston, TX, USA, 10–13 January 1972. [Google Scholar]
- Willis, J.P.; Erlank, A.J.; Gurney, J.J.; Theil, R.H.; Ahrens, L.H. Major, minor, and trace element data for some Apollo 11, 12, 14 and 15 samples. In Proceedings of the 3rd Lunar Science Conference, Houston, TX, USA, 10–13 January 1972. [Google Scholar]
- Neal, C. Interior of the Moon. J. Geophys. Res. 2001, 106, 27865–27885. [Google Scholar] [CrossRef]
- Patchen, A.; Taylor, L.A. The most reduced rock from the Moon—Apollo 14 basalt 14053: Extreme reduction entirely from a re-heating event. In Proceedings of the 35th Lunar and Planetary Science Conference, League City, TX, USA, 15–19 March 2004. [Google Scholar]
- Lester, G.W.; Clark, A.H.; Kyser, T.K.; Naslund, H.R. Experiments on liquid immiscibility in silicate melts with H2O, P, S, F and Cl: Implications for natural magmas. Contrib. Mineral. Petrol. 2013, 166, 329–349. [Google Scholar] [CrossRef]
- Braun, I.; Kriegsman, L.M. Partial melting in crustal xenoliths and anatectic migmatites: A comparison. Phys. Chem. Earth Part A Solid Earth Geod. 2001, 26, 261–266. [Google Scholar] [CrossRef]
- Fagan, T.J.; Kashima, D.; Wakabayashi, Y.; Suginohara, A. Case study of magmatic differentiation trends on the Moon based on lunar meteorite Northwest Africa 773 and comparison with Apollo 15 quartz monzodiorite. Geochim. Cosmochim. Acta 2014, 133, 97–127. [Google Scholar] [CrossRef]
- Tartèse, R.; Anand, M.; Joy, K.H.; Franchi, I.A. H and Cl isotope systematics of apatite in brecciated lunar meteorites Northwest Africa 4472, Northwest Africa 773, Sayh al Uhaymir 169, and Kalahari 009. Meteor. Planet. Sci. 2014, 49, 2266–2289. [Google Scholar] [CrossRef]
- Ryerson, F.J.; Hess, P.C. Implications of liquid-liquid distribution coefficients to mineral-liquid partitioning. Geochim. Cosmochim. Acta 1978, 42, 921–932. [Google Scholar] [CrossRef]
- Ryerson, F.J.; Hess, P.C. The role of P2O5 in silicate melts. Geochim. Cosmochim. Acta 1980, 44, 611–624. [Google Scholar] [CrossRef]
- McIntosh, E.C.; Rapp, J.F.; Draper, D.S. Results from high-pressure temperature experiments investigating REE partitioning between olivine and melt in a composition relevant to the moon. In Proceedings of the 47th Lunar and Planetary Science Conference, The Woodlands, TX, USA, 21–25 March 2016. [Google Scholar]
- Reid, M.R. Ion probe investigation of rare earth element distributions and partial melting of metasedimentary granulites. In Granulites and Crustal Evolution; Vielzeuf, D., Vidal, P., Eds.; Kluwer Academic Publishers: Dordrecht, The Netherlands, 1990; pp. 507–522. [Google Scholar]
- Férot, A.; Bolfan-Casanova, N. Water storage capacity in olivine and pyroxene to 14 GPa: Implications for the water content of the Earth’s upper mantle and nature of seismic discontinuities. Earth Planet. Sci. Lett. 2012, 349, 218–230. [Google Scholar] [CrossRef]
- Lloyd, A.S.; Ferriss, E.; Ruprecht, P.; Hauri, E.H.; Jicha, B.R.; Plank, T. An assessment of clinopyroxene as a recorder of magmatic water and magma ascent rate. J. Petrol. 2016, 57, 1865–1886. [Google Scholar] [CrossRef]
- Peslier, A.H. A review of water contents of nominally anhydrous natural minerals in the mantles of Earth, Mars and the Moon. J. Volcanol. Geotherm. Res. 2010, 197, 239–258. [Google Scholar] [CrossRef]
- Arndt, N.; Ginibre, C.; Chauvel, C.; Albarède, F.; Cheadle, M.; Herzberg, C.; Jenner, G.; Lahaye, Y. Were komatiites wet? Geology 1998, 26, 739–742. [Google Scholar] [CrossRef]
- Ryder, G.; Schuraytz, B.C. Chemical variation of the large Apollo 15 olivine-normative mare basalt rock samples. J. Geophys. Res. Planet. 2001, 106, 1435–1451. [Google Scholar] [CrossRef]
Figure 1.
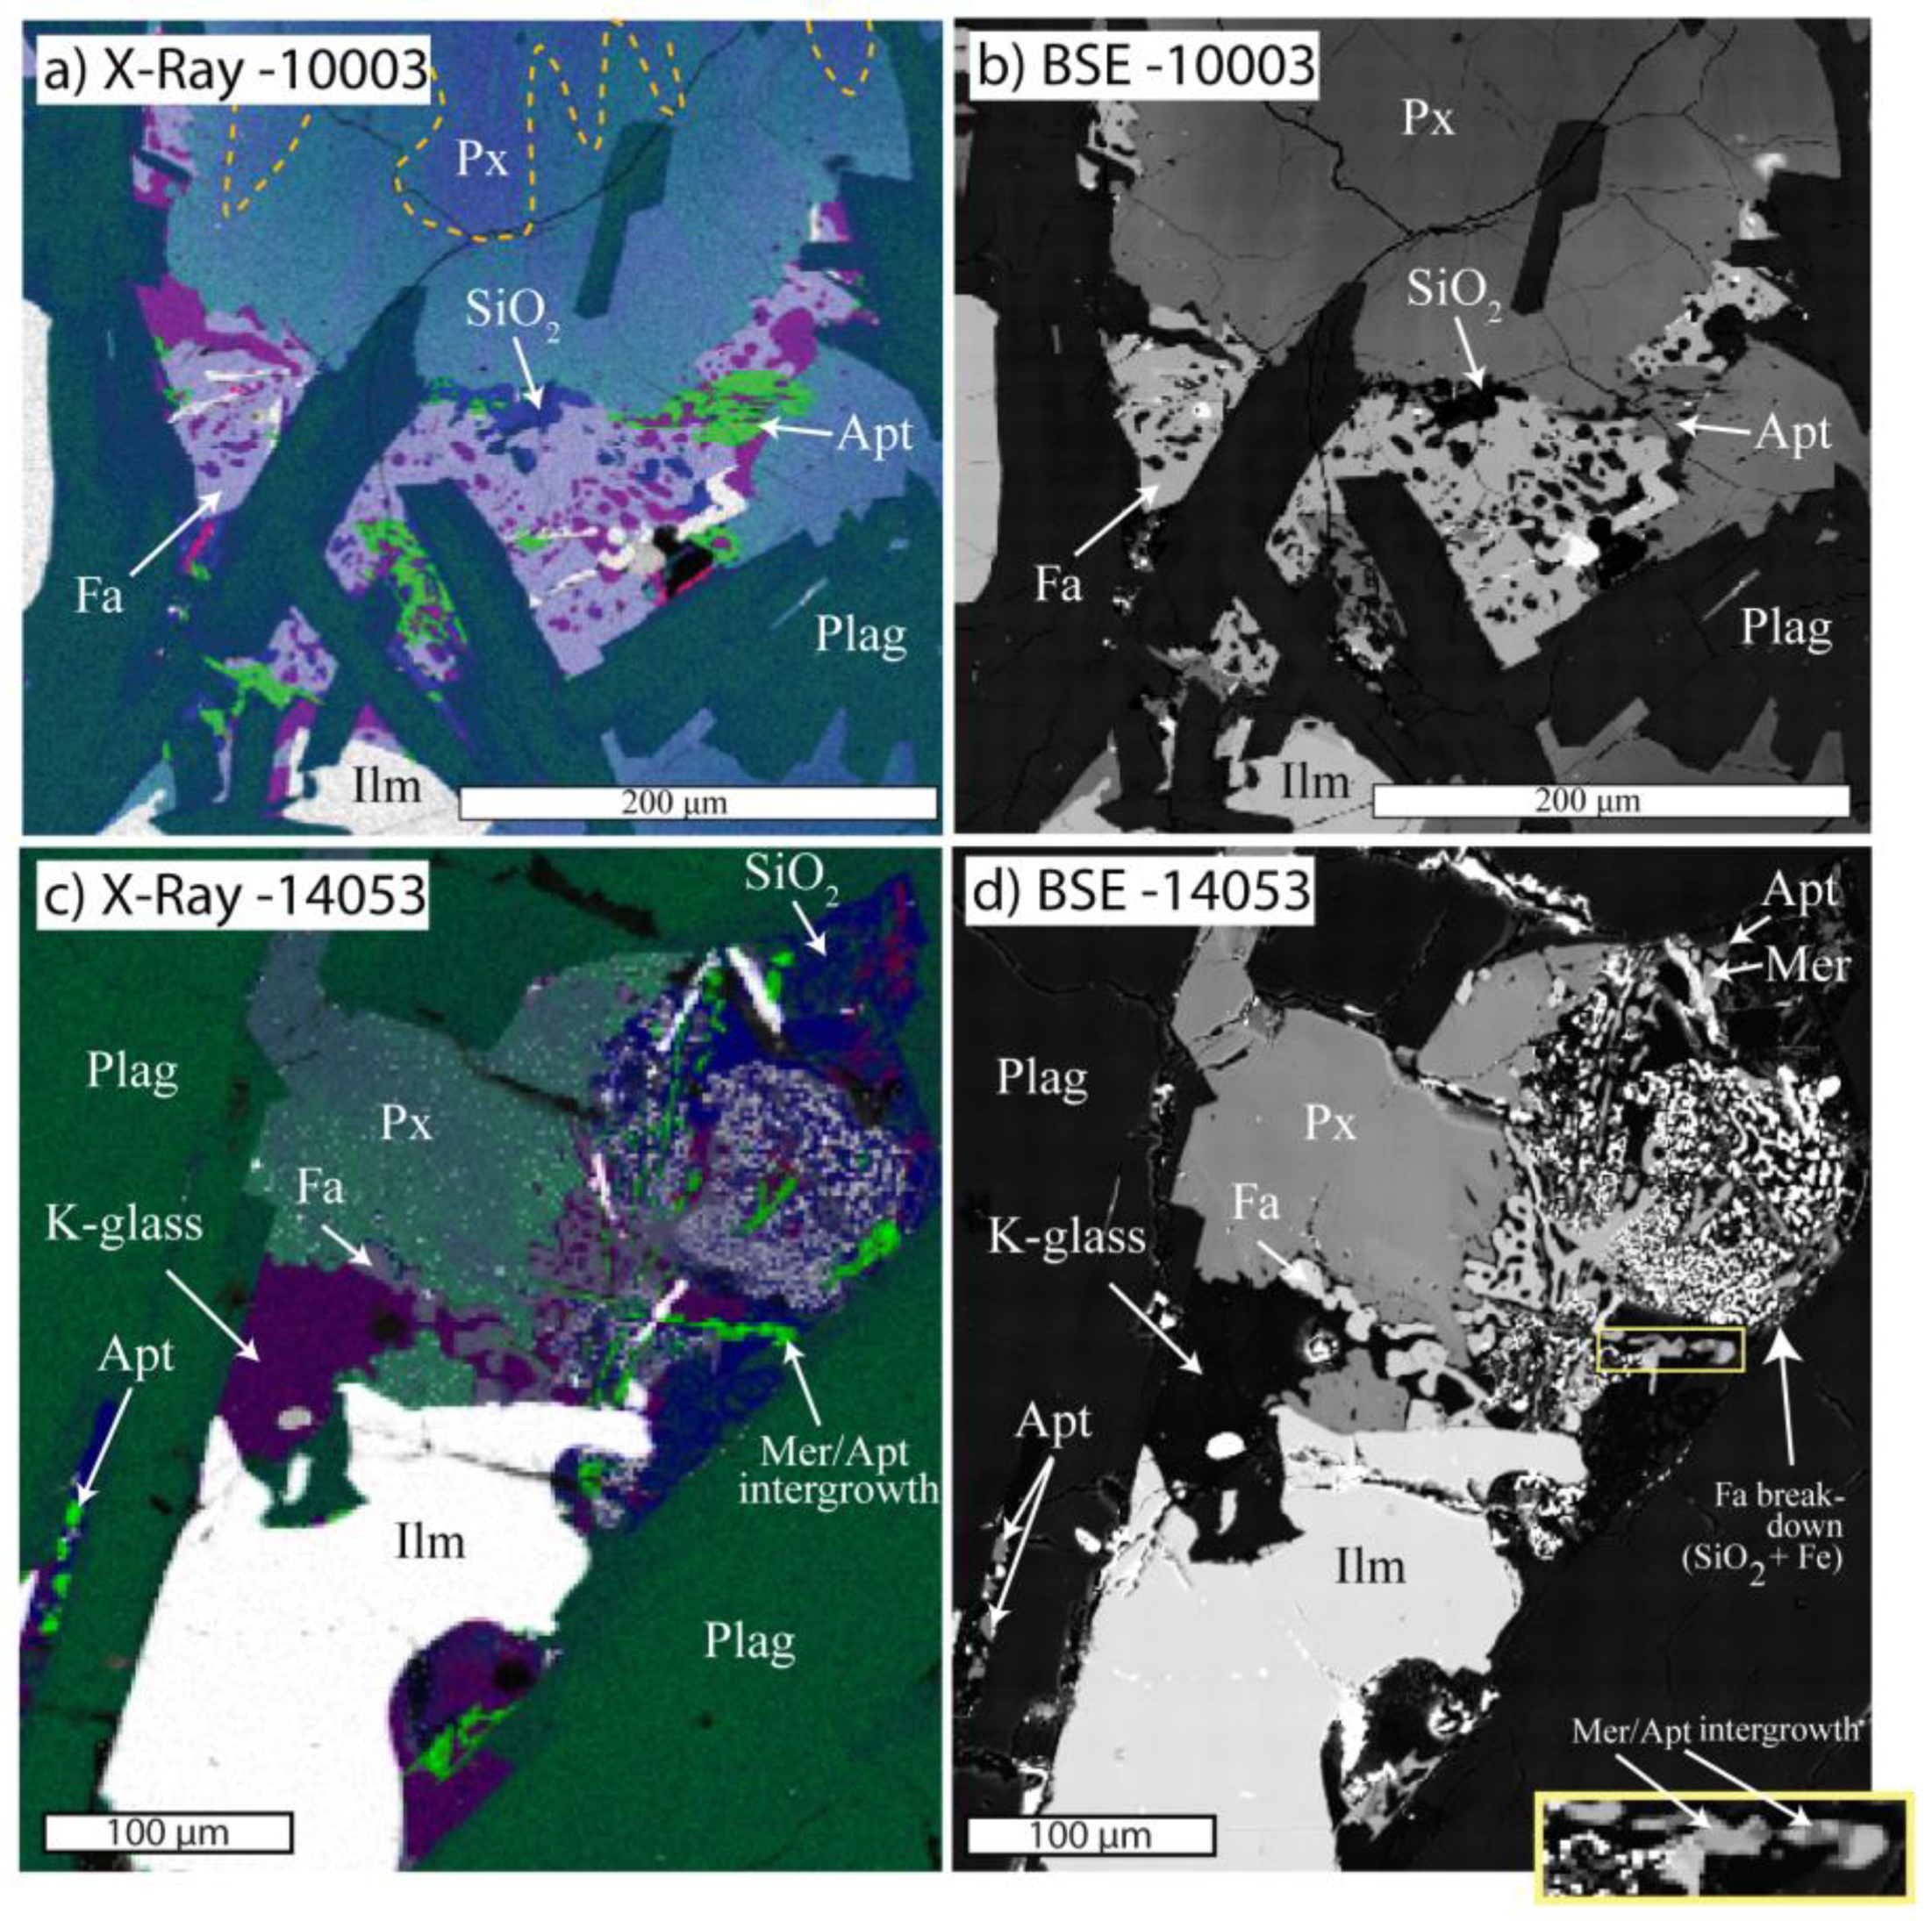
False-color composite (Si – blue, Ca – green, K – red, Fe – gray) x-ray maps (a,c) for the mesostasis pockets within basalts 10003 and 14053, respectively (Source: A and c modified from [6]). Color variations highlight pyroxene and plagioclase zoning. Pyroxene zoning is characterized by gradation from dark to light blue, reflecting increasing Ca content from core to rim (examples highlighted by dashed orange lines). Plagioclase zoning is characterized by gradation from dark-green to dark-blue, reflecting decreasing An% from core to rim. (b,d) BSE images of mesostasis in basalts 10003 and 14053, respectively, highlighting chemical variations of apatite (darker, Apt) and merrillite (lighter, Mer), and the complex intergrowth of phosphates in some spots. Fa (fayalite), Plag (plagioclase), Px (pyroxene), Kfs (K-feldspar), Ilm (ilmenite), and SiO2 (silica).
Figure 1.
False-color composite (Si – blue, Ca – green, K – red, Fe – gray) x-ray maps (a,c) for the mesostasis pockets within basalts 10003 and 14053, respectively (Source: A and c modified from [6]). Color variations highlight pyroxene and plagioclase zoning. Pyroxene zoning is characterized by gradation from dark to light blue, reflecting increasing Ca content from core to rim (examples highlighted by dashed orange lines). Plagioclase zoning is characterized by gradation from dark-green to dark-blue, reflecting decreasing An% from core to rim. (b,d) BSE images of mesostasis in basalts 10003 and 14053, respectively, highlighting chemical variations of apatite (darker, Apt) and merrillite (lighter, Mer), and the complex intergrowth of phosphates in some spots. Fa (fayalite), Plag (plagioclase), Px (pyroxene), Kfs (K-feldspar), Ilm (ilmenite), and SiO2 (silica).

Figure 2.
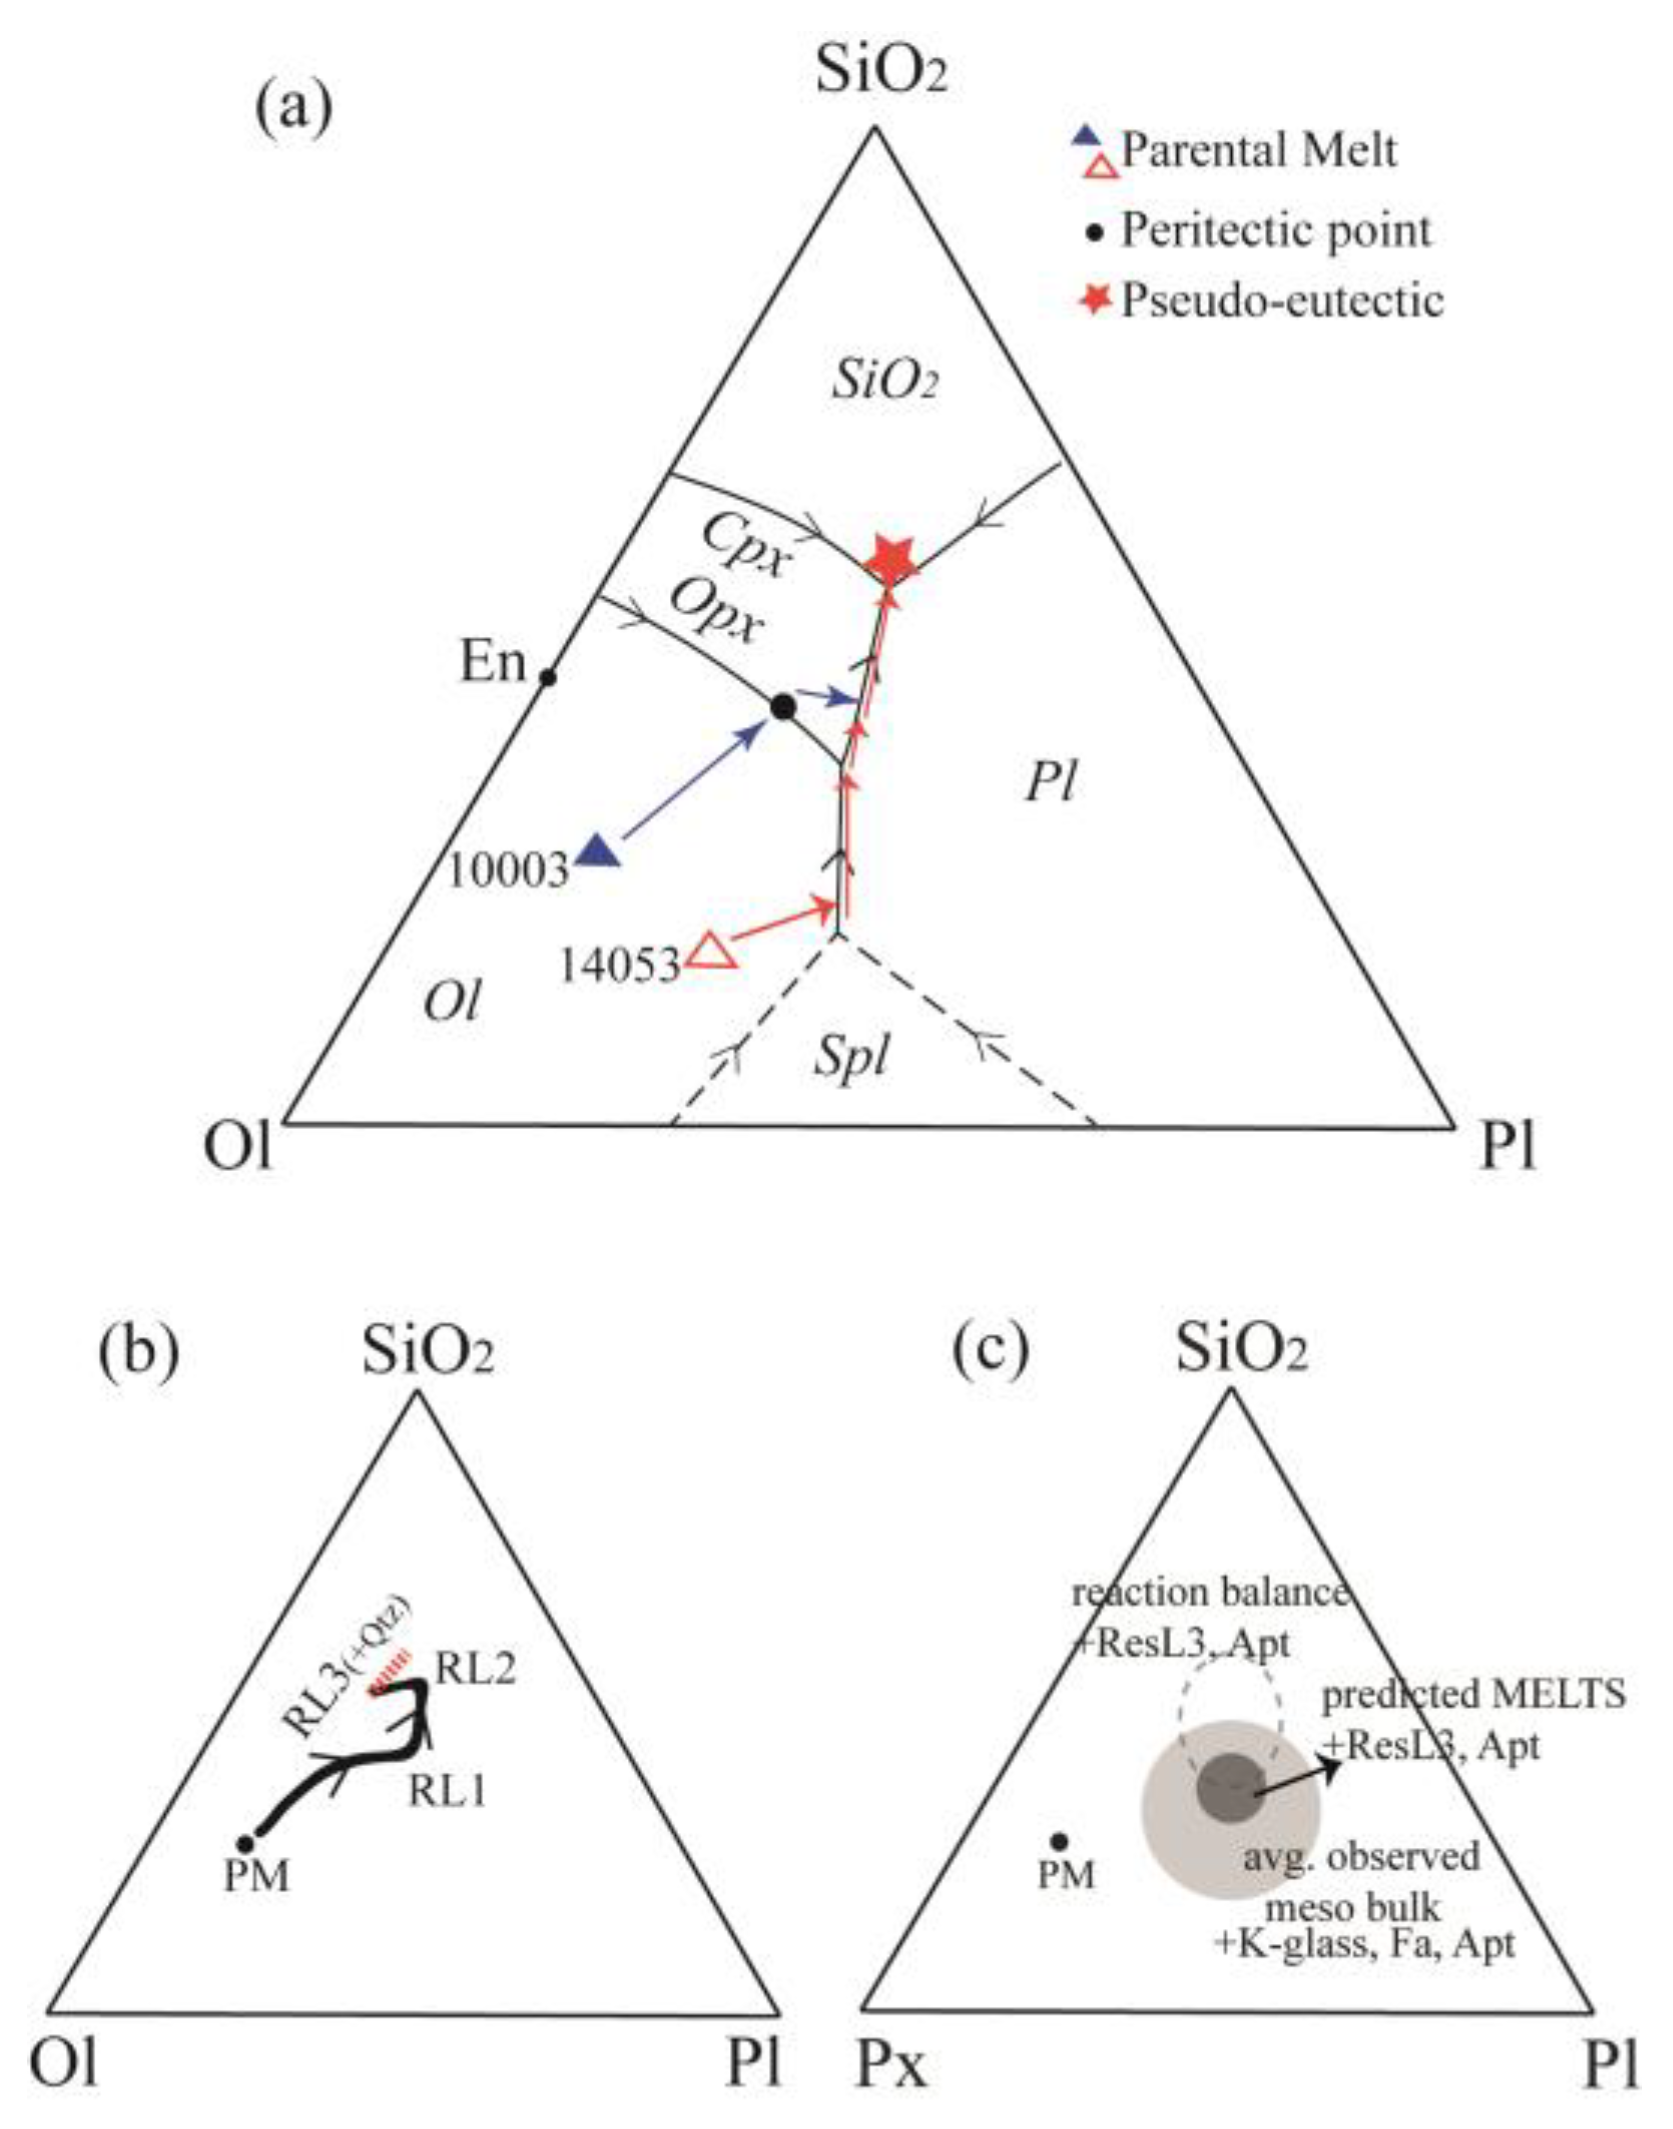
(a) Ternary diagram showing the petrological evolution of lunar samples 10003 and 14053. The parental melt compositions (see Table 1 and Table 2) and subsequent melt evolution is represented by blue and red circles and arrows for 10003 and 14053, respectively. The red star represents the composition of the final residual liquid which has been used as the mesostasis starting composition (see text for details), (b) Ternary diagram showing the petrological evolution (path of solid line) of lunar sample 10003 from the parental melt composition (Table 1) to the subsequent melt residual liquids. The red dashed section highlights the theoretical path of ResL3 if quartz is absent and, therefore, ResL3 would be higher in silica than ResL2 (see text for further details), (c) Ternary diagram showing the compositional fields matching mineral modes among the three approaches: Observed (bulk composition), thermodynamical model and reaction balancing for sample 10003 (see also Table 2 and Table S1).
Figure 2.
(a) Ternary diagram showing the petrological evolution of lunar samples 10003 and 14053. The parental melt compositions (see Table 1 and Table 2) and subsequent melt evolution is represented by blue and red circles and arrows for 10003 and 14053, respectively. The red star represents the composition of the final residual liquid which has been used as the mesostasis starting composition (see text for details), (b) Ternary diagram showing the petrological evolution (path of solid line) of lunar sample 10003 from the parental melt composition (Table 1) to the subsequent melt residual liquids. The red dashed section highlights the theoretical path of ResL3 if quartz is absent and, therefore, ResL3 would be higher in silica than ResL2 (see text for further details), (c) Ternary diagram showing the compositional fields matching mineral modes among the three approaches: Observed (bulk composition), thermodynamical model and reaction balancing for sample 10003 (see also Table 2 and Table S1).

Figure 3.
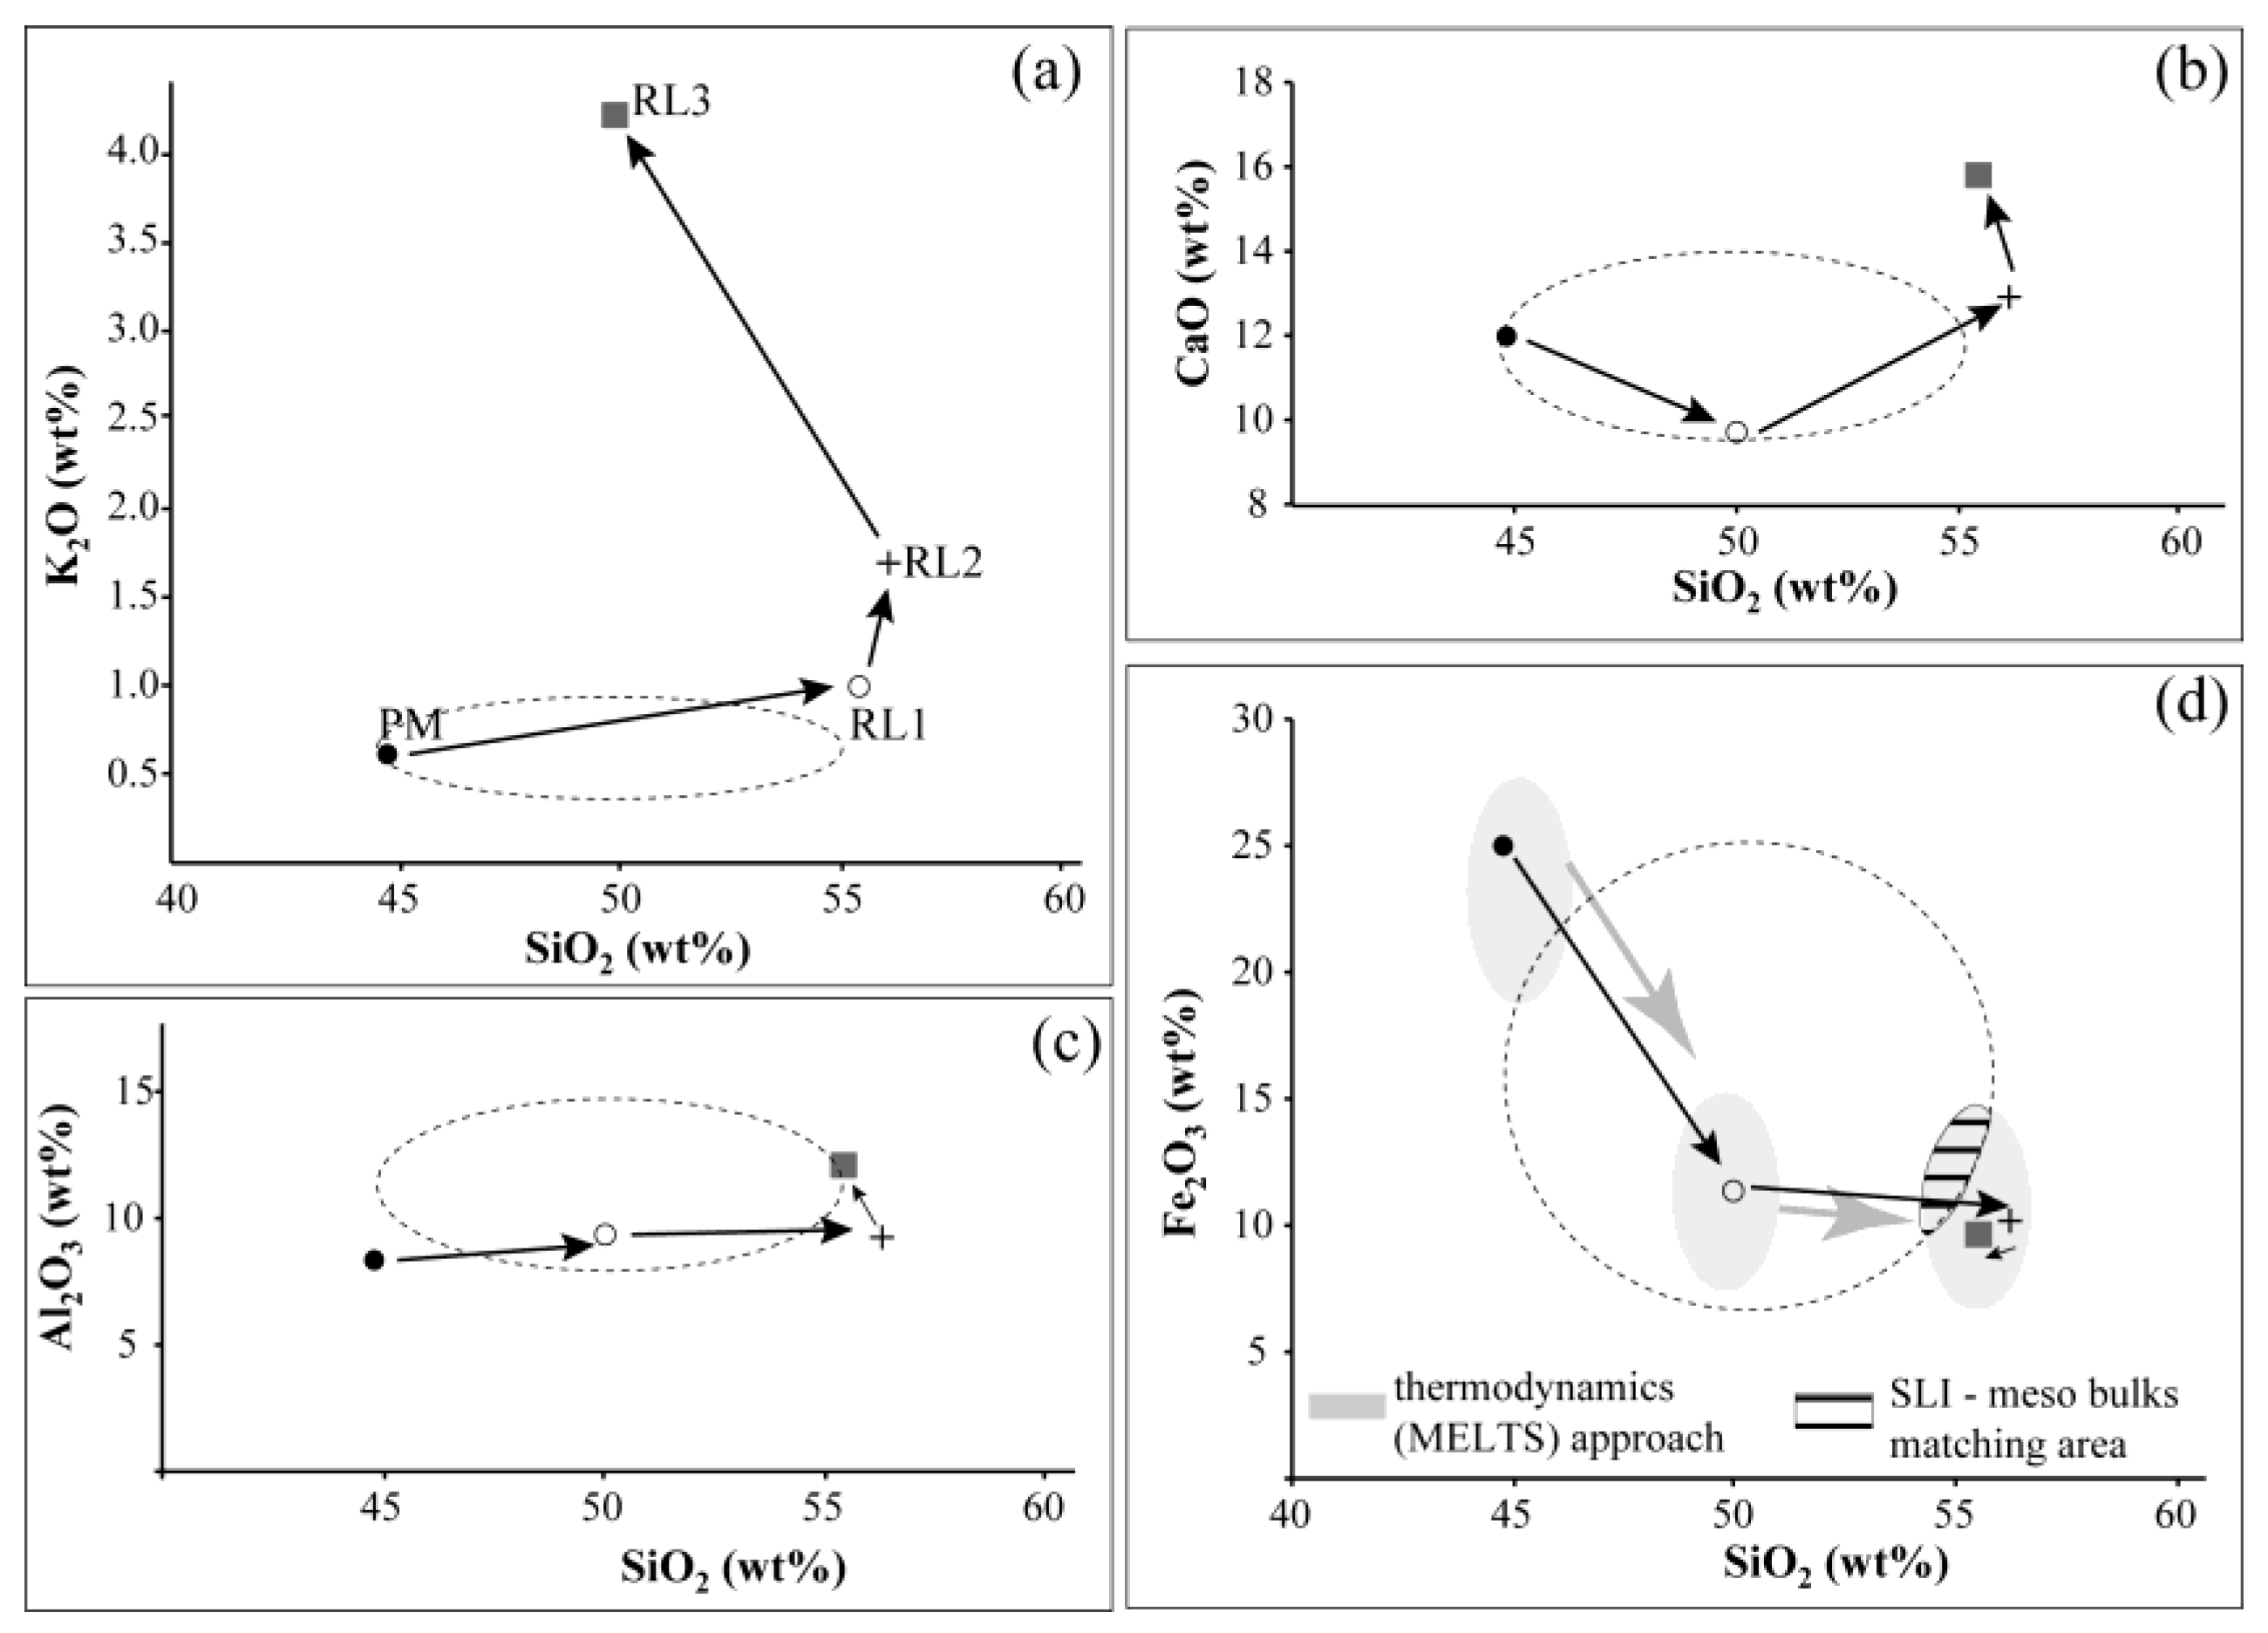
Harker variation diagrams (a–d) showing the compositional evolution of lunar sample 10003 from the parental melt composition (Table 1) to the subsequent melt residual liquids. Dashed ellipses represent the range of the bulk rock fields of the five different studied mesostasis microdomains. In (d) we highlight for comparison with the reaction balance results, the same compositional evolution through the thermodynamic modeling (grey ellipses) with MELTS. The common area of both ellipses (darker grey) indicates the matching compositional fields between SLI and bulk mesostasis.
Figure 3.
Harker variation diagrams (a–d) showing the compositional evolution of lunar sample 10003 from the parental melt composition (Table 1) to the subsequent melt residual liquids. Dashed ellipses represent the range of the bulk rock fields of the five different studied mesostasis microdomains. In (d) we highlight for comparison with the reaction balance results, the same compositional evolution through the thermodynamic modeling (grey ellipses) with MELTS. The common area of both ellipses (darker grey) indicates the matching compositional fields between SLI and bulk mesostasis.

Figure 4.
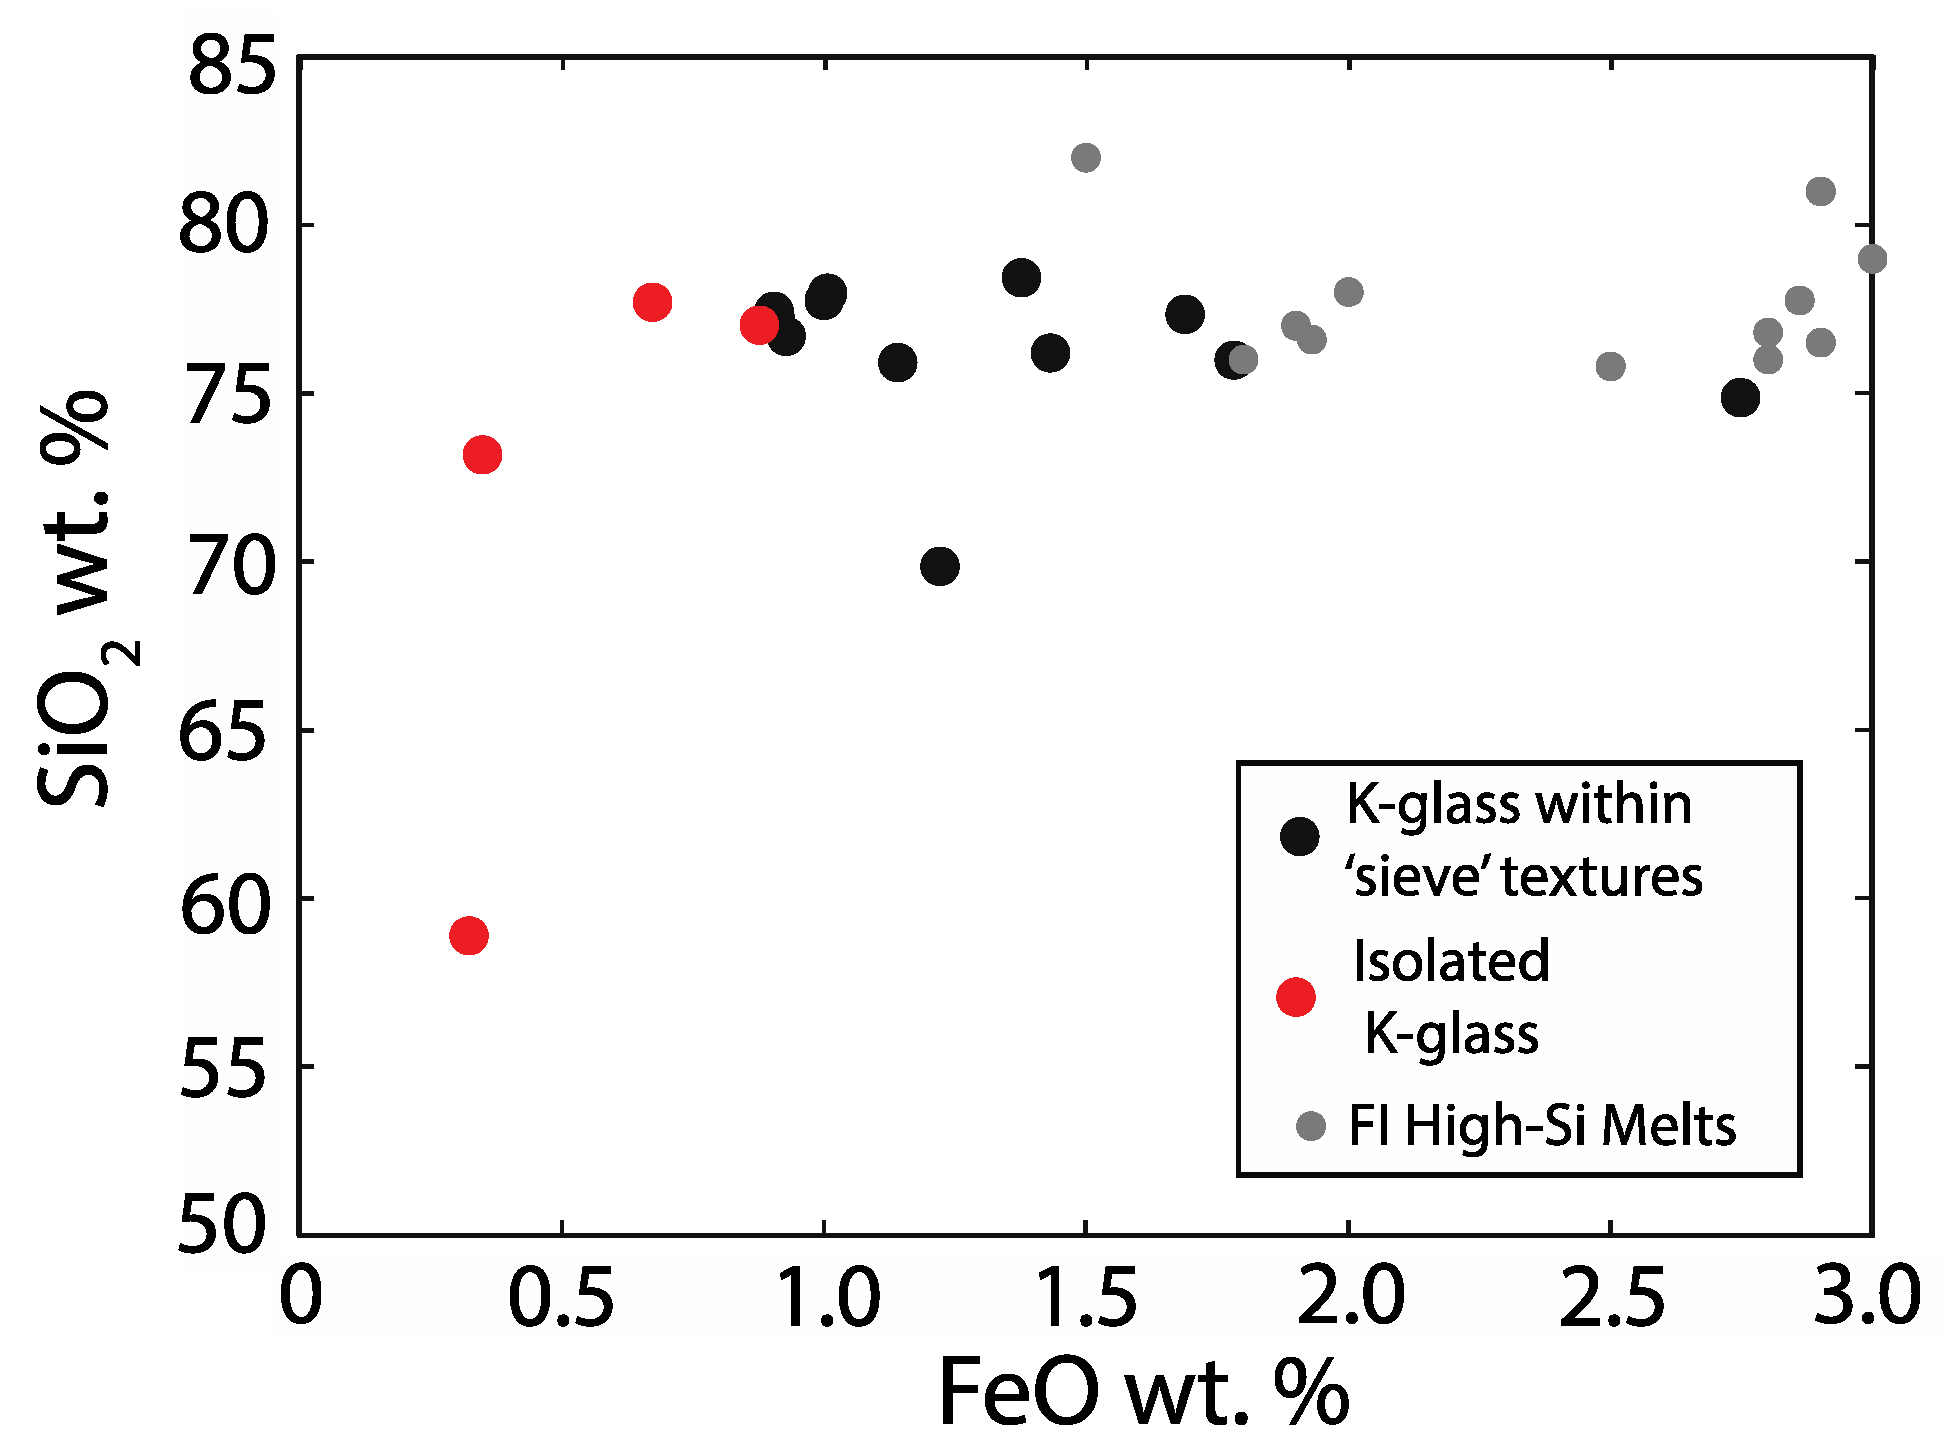
SiO2 wt% vs. FeO wt% for K-glass (black circles) associated with immiscible ‘sieve’ textures and K-glass isolated from Fa (red circles). For comparison, reported high-Si and high-K immiscible liquids (quenched as glass) within olivine melt inclusions (FI, gray circles) are plotted (data from [7,23]). Glass associated with immiscible liquids is characterized by FeO > 1 wt%, whereas glass not associated with immiscible liquids (i.e., not associated with Fa) and characterized by Fe < 1 wt%.
Figure 4.
SiO2 wt% vs. FeO wt% for K-glass (black circles) associated with immiscible ‘sieve’ textures and K-glass isolated from Fa (red circles). For comparison, reported high-Si and high-K immiscible liquids (quenched as glass) within olivine melt inclusions (FI, gray circles) are plotted (data from [7,23]). Glass associated with immiscible liquids is characterized by FeO > 1 wt%, whereas glass not associated with immiscible liquids (i.e., not associated with Fa) and characterized by Fe < 1 wt%.


Table 1.
Example of mass balance in a 10-component chemical system.
| Ol | Cpx | F-Apt | Apt | Ilm | An | Ab | SiO2 | H2O in Liq | ResLiq3 | PM | |
|---|---|---|---|---|---|---|---|---|---|---|---|
| SiO2 | 1.000 | 1.958 | 0.000 | 0.000 | 0.000 | 2.000 | 3.000 | 1.000 | 0.000 | 16.708 | 14.122 |
| AlO1.5 | 0.000 | 0.060 | 0.000 | 0.000 | 0.000 | 2.000 | 1.000 | 0.000 | 0.000 | 5.405 | 4.507 |
| (Fe,Mg,Mn)O | 2.000 | 1.292 | 0.000 | 0.000 | 1.000 | 0.000 | 0.000 | 0.000 | 0.000 | 7.618 | 10.095 |
| CaO | 0.000 | 0.703 | 5.000 | 5.000 | 0.000 | 1.000 | 0.000 | 0.000 | 0.000 | 3.566 | 4.335 |
| TiO2 | 0.000 | 0.000 | 0.000 | 0.000 | 1.000 | 0.000 | 0.000 | 0.000 | 0.000 | 0.000 | 3.075 |
| NaO0.5 | 0.000 | 0.000 | 0.000 | 0.000 | 0.000 | 0.000 | 1.000 | 0.000 | 0.000 | 0.962 | 0.275 |
| KO0.5 | 0.000 | 0.000 | 0.000 | 0.000 | 0.000 | 0.000 | 0.000 | 0.000 | 0.000 | 0.313 | 0.026 |
| PO2.5 | 0.000 | 0.000 | 3.000 | 3.000 | 0.000 | 0.000 | 0.000 | 0.000 | 0.000 | 0.9945 | 0.0995 |
| F, Cl | 0.000 | 0.000 | 1.000 | 0.000 | 0.000 | 0.000 | 0 000 | 0.000 | 0.000 | 0.2652 | 0.0265 |
| H2O | 0.000 | 0.000 | 0.000 | 1.000 | 0.000 | 0.000 | 0.000 | 0.000 | 1.000 | 0.0694 | 0.0069 |
| ppm H2O in melt | 308 | 29 | |||||||||
| oxygen pfu | 4 | 6 | 13 | 13 | 3 | 8 | 8 | 2 | 0.5 | 56 | 56 |
| reaction coefficient | 1.199 | 3.089 | 0.004 | 0.001 | 3.075 | 1.839 | 0.195 | 1.223 | 0.000 | 0.083 | −1 |
| molar V | 4.365 | 6.491 | 15.839 | 15.84 | 3.17 | 10.09 | 10.01 | 2.634 | 77.89 | 82.64 | |
| abundance (vol.%) | 8.0% | 30.7% | 0.1% | 0.0% | 14.9% | 28.4% | 3.0% | 4.9% | 9.9% | ||
| volume ratios | Cpx/Ol = 3.8 | Apt/Pl = 0 | Apt/Cpx = 0 | An%(0.90) | molar OH fraction in Apt = 0.21 | ||||||
Table 2.
Mass balance and thermodynamics on Apollo 11 10003,152 in a 10-component chemical system.
| Ol | Cpx | F-Apt | Apt | Ilm | An | Ab | SiO2 | K-glass | K-liq | Fa-liq | ResLiq3 | ResLiq2 | ResLiq1 | PM | |
|---|---|---|---|---|---|---|---|---|---|---|---|---|---|---|---|
| SiO2 | 1.000 | 1.958 | 0.000 | 0.000 | 0.000 | 2.000 | 3.000 | 1.000 | 3.000 | 6.866 | 9.842 | 16.708 | 17.868 | 17.505 | 14.122 |
| AlO1.5 | 0.000 | 0.060 | 0.000 | 0.000 | 0.000 | 2.000 | 1.000 | 0.000 | 1.000 | 1.104 | 4.301 | 5.405 | 6.193 | 6.351 | 4.507 |
| (Fe,Mg,Mn)O | 2.000 | 1.292 | 0.000 | 0.000 | 1.000 | 0.000 | 0.000 | 0.000 | 0.000 | 0.000 | 7.618 | 7.618 | 5.083 | 4.997 | 10.095 |
| CaO | 0.000 | 0.703 | 5.000 | 5.000 | 0.000 | 1.000 | 0.000 | 0.000 | 0.000 | 1.019 | 2.547 | 3.566 | 4.867 | 5.779 | 4.335 |
| TiO2 | 0.000 | 0.000 | 0.000 | 0.000 | 1.000 | 0.000 | 0.000 | 0.000 | 0.000 | 0.000 | 0.000 | 0.000 | 0.000 | 0.000 | 3.075 |
| NaO0.5 | 0.000 | 0.000 | 0.000 | 0.000 | 0.000 | 0.000 | 1.000 | 0.000 | 0.000 | 0.096 | 0.866 | 0.962 | 0.491 | 0.409 | 0.275 |
| KO0.5 | 0.000 | 0.000 | 0.000 | 0.000 | 0.000 | 0.000 | 0.000 | 0.000 | 0.500 | 0.313 | 0.000 | 0.313 | 0.080 | 0.048 | 0.026 |
| PO2.5 | 0.000 | 0.000 | 3.000 | 3.000 | 0.000 | 0.000 | 0.000 | 0.000 | 0.000 | 0.497 | 0.4973 | 0.9945 | 0.2766 | 0.1723 | 0.0995 |
| F, Cl | 0.000 | 0.000 | 1.000 | 0.000 | 0.000 | 0.000 | 0.000 | 0.000 | 0.000 | 0.113 | 0.1526 | 0.2652 | 0.0737 | 0.0460 | 0.0265 |
| H2O | 0.000 | 0.000 | 0.000 | 1.000 | 0.000 | 0.000 | 0.000 | 0.000 | 0.005 | 0.056 | 0.0132 | 0.0694 | 0.0192 | 0.0120 | 0.0069 |
| ppm H2O in melt | -- | -- | -- | -- | -- | -- | -- | -- | 177 | 871 | 82 | 308 | 87 | 54 | 29 |
| molar V (J/bar) | 4.365 | 6.491 | 15.839 | 15.839 | 3.17 | 10.086 | 10.009 | 2.634 | 9.79 | 24.21 | 55.55 | 77.89 | 76.36 | 77.15 | 82.64 |
| bulk balance (Table 1) | 1.199 | 3.089 | 0.004 | 0.001 | 3.075 | 1.839 | 0.195 | 1.223 | -- | -- | -- | 0.083 | -- | -- | −1 |
| reaction coefficients | |||||||||||||||
| reaction 1 | 1.496 | 0.984 | 0.001 | 0.000 | 3.075 | 0.448 | 0.049 | -- | -- | -- | -- | -- | -- | 0.552 | −1 |
| reaction 2 | −0.548 | 2.363 | 0.002 | 0.000 | 0.000 | 1.195 | 0.115 | -- | -- | -- | -- | -- | 0.598 | −1 | -- |
| reaction 3 | -- | 2.429 | 0.006 | 0.002 | 0.000 | 2.211 | 0.245 | 3.686 | -- | -- | -- | 0.255 | −1 | -- | -- |
| reaction 4 | -- | -- | -- | -- | -- | -- | -- | -- | -- | 1 | 1 | −1 | -- | -- | -- |
| reaction 5 | 3.809 | -- | 0.153 | 0.013 | 0.000 | 1.718 | 0.866 | 0.000 | -- | 0.000 | −1 | -- | -- | -- | -- |
| reaction 6 | 0.000 | 0.000 | 0.113 | 0.053 | 0.000 | 0.191 | 0.096 | 4.318 | 0.626 | −1 | -- | -- | -- | -- | -- |
| bulk balance check | 1.194 | 3.089 | 0.004 | 0.001 | 3.075 | 1.837 | 0.194 | 1.217 | 0.084 | ||||||
| volume ratios of product phases | mineral compositions | Thermodynamics - MELTS | |||||||||||||
| reaction nr | Ol/Pl | Cpx/Pl | Apt/Pl | An% in Pl | OH/(OH + F + Cl) in Apt | Fa-Liq / K-Liq ratio | P (kbar) - T (°C) | Modes (%) | |||||||
| 1 | 1.3 | 1.27 | 0.005 | 90% | 0.24 | -- | 1.5 ± 0.5–1020 ± 40 | Ol(9)RL(33)Pl(12)Cpx(40)Ap(6) | |||||||
| 2 | -- | 1.16 | 0.003 | 91% | 0.16 | -- | |||||||||
| 3 | -- | 0.64 | 0.005 | 90% | 0.21 | -- | 1 ± 0.3–860 ±4 0 | Cpx(30)Pl(25)SiO2(21)RL(15)Ap(9) | |||||||
| 4 | -- | -- | -- | -- | -- | 2.3 | |||||||||
| 5 | 0.64 | -- | 0.1 | 67% | 0.08 | -- | |||||||||
| 6 | -- | -- | 0.9 | 67% | 0.32 | -- | |||||||||
Table 3.
Mass balance and thermodynamics on Apollo 14 14053,241 in an 11-component chemical system.
| K-glass | Cpx | F-Apt | Apt | Ilm | An | Ab | Or | SiO2 | Ol | H2O in Liq | Ca-Mer | REE-Mer | Fa-liq | K-Liq | mesostasis | bulk 14053 | |
|---|---|---|---|---|---|---|---|---|---|---|---|---|---|---|---|---|---|
| SiO2 | 3.000 | 2.000 | 0.200 | 0.200 | 0.000 | 2.000 | 3.000 | 3.000 | 1.000 | 1.000 | 0.000 | 0.000 | 0.000 | 9.959 | 3.000 | 15.804 | 16.192 |
| AlO1.5 | 1.000 | 0.000 | 0.000 | 0.000 | 0.000 | 2.000 | 1.000 | 1.000 | 0.000 | 0.000 | 0.000 | 0.000 | 0.000 | 3.089 | 1.000 | 5.037 | 5.594 |
| (Fe,Mg.Mn)O | 0.000 | 1.500 | 0.000 | 0.000 | 1.000 | 0.000 | 0.000 | 0.000 | 0.000 | 2.000 | 0.000 | 2.000 | 2.000 | 9.517 | 0.000 | 9.517 | 9.392 |
| TiO2 | 0.000 | 0.000 | 0.000 | 0.000 | 1.000 | 0.000 | 0.000 | 0.000 | 0.000 | 0.000 | 0.000 | 0.000 | 0.000 | 0.000 | 0.000 | 0.000 | 0.693 |
| NaO0.5 | 0.000 | 0.000 | 0.000 | 0.000 | 0.000 | 0.000 | 1.000 | 0.000 | 0.000 | 0.000 | 0.000 | 0.000 | 0.000 | 1.030 | 0.000 | 1.030 | 0.298 |
| CaO | 0.000 | 0.500 | 4.800 | 4.800 | 0.000 | 1.000 | 0.000 | 0.000 | 0.000 | 0.000 | 0.000 | 19.000 | 16.000 | 3.056 | 0.000 | 3.056 | 4.188 |
| KO0.5 | 0.500 | 0.000 | 0.000 | 0.000 | 0.000 | 0.000 | 0.000 | 1.000 | 0.000 | 0.000 | 0.000 | 0.000 | 0.000 | 0.000 | 0.500 | 0.974 | 0.045 |
| PO2.5 | 0.000 | 0.000 | 2.800 | 2.800 | 0.000 | 0.000 | 0.000 | 0.000 | 0.000 | 0.000 | 0.000 | 14.000 | 14.00 | 1.252 | 0.000 | 1.252 | 0.034 |
| (Y,REE)O 1.5 | 0.000 | 0.000 | 0.200 | 0.200 | 0.000 | 0.000 | 0.000 | 0.000 | 0.000 | 0.000 | 0.000 | 0.000 | 2.000 | 0.089 | 0.000 | 0.089 | 0.002 |
| F,Cl | 0.000 | 0.000 | 1.000 | 0.000 | 0.000 | 0.000 | 0.000 | 0.000 | 0.000 | 0.000 | 0.000 | 0.000 | 0.100 | 0.260 | 0.000 | 0.260 | 0.007 |
| H2O | 0.005 | 0.000 | 0.000 | 1.000 | 0.000 | 0.000 | 0.000 | 0.000 | 0.000 | 0.000 | 1.000 | 0.000 | 0.000 | 0.095 | 0.005 | 0.105 | 0.003 |
| oxygens | 7.8 | 6.0 | 12.5 | 12.5 | 3.0 | 8.0 | 8.0 | 8.0 | 2.0 | 4.0 | 0 | 56 | 56 | 40.9 | 7.8 | 56.0 | 56.0 |
| coefficients reaction A | 0.04 | 3.06 | 0.00 | 0.00 | 0.69 | 2.58 | 0.27 | 0.00 | 1.65 | 1.93 | - | - | - | - | - | 0.03 | −1.00 |
| coefficients reaction B | - | 0.00 | 0.00 | 0.00 | 0.00 | 0.00 | 0.00 | 0.00 | 0.00 | 0.00 | 0.00 | 1.00 | 1.95 | −1.00 | - | ||
| coefficients reaction C | - | 0.00 | 0.26 | 0.09 | 0.00 | 1.03 | 1.03 | 0.00 | 0.00 | 4.74 | - | 0.01 | 0.01 | −1.00 | - | - | - |
| coefficients reaction D | 1.00 | 0.00 | 0.00 | 0.00 | 0.00 | 0.00 | 0.00 | 0.00 | 0.00 | - | - | 0.00 | 0.00 | - | −1.00 | - | - |
© 2019 by the authors. Licensee MDPI, Basel, Switzerland. This article is an open access article distributed under the terms and conditions of the Creative Commons Attribution (CC BY) license (http://creativecommons.org/licenses/by/4.0/).
Share and Cite
MDPI and ACS Style
Álvarez-Valero, A.M.; Pernet-Fisher, J.F.; Kriegsman, L.M. Petrologic History of Lunar Phosphates Accounts for the Water Content of the Moon’s Mare Basalts. Geosciences 2019, 9, 421. https://doi.org/10.3390/geosciences9100421
AMA Style
Álvarez-Valero AM, Pernet-Fisher JF, Kriegsman LM. Petrologic History of Lunar Phosphates Accounts for the Water Content of the Moon’s Mare Basalts. Geosciences. 2019; 9(10):421. https://doi.org/10.3390/geosciences9100421
Chicago/Turabian StyleÁlvarez-Valero, Antonio M., John F. Pernet-Fisher, and Leo M. Kriegsman. 2019. "Petrologic History of Lunar Phosphates Accounts for the Water Content of the Moon’s Mare Basalts" Geosciences 9, no. 10: 421. https://doi.org/10.3390/geosciences9100421
Note that from the first issue of 2016, this journal uses article numbers instead of page numbers. See further details here.