Instrumented Health Monitoring of an Earth Dam


1
K. N. Toosi University of Technology, Tehran 1996715433, Iran
2
University of Colorado Boulder, CO 80818, USA
3
University of Maryland, College Park, MD 20743, USA
4
University of Massachusetts, Lowell, MA 02142, USA
*
Author to whom correspondence should be addressed.
Infrastructures 2020, 5(3), 26; https://doi.org/10.3390/infrastructures5030026
Submission received: 30 January 2020
/
Revised: 25 February 2020
/
Accepted: 29 February 2020
/
Published: 3 March 2020
(This article belongs to the Special Issue Advances in Dam Engineering)
Abstract
:This work evaluates the stability of the Boostan earth dam by investigating its long-term performance and interpreting the measured data. To measure the dam response, several sensitive locations are instrumented. This process includes measuring various quantities such as pore water pressure, water level, and internal stress ratios using inspection devices such as ordinary and Casagrande piezometers, and total pressure cells. The recorded data shows that the pore pressure is in good agreement with the initial (stable) design condition. The installed piezometers show that the drainage is efficient, and the water table in the body is adequate. The instrument also shows a reasonable horizontal stress in the dam body. Overall, the condition of the case study dam is assessed to be normal. The results of this case report can be used as a guide in similar dams for instrumented health monitoring.
1. Introduction
The protection, maintenance, and proper operation of dams not only lead to a long life span of the structure, but they are also significant for health, safety, and environmental aspects [1]. The most significant problems that occur in the major infrastructure are those associated with the lack of proper maintenance procedures [2]. The high cost and long duration of constructing dams dictates the need for a comprehensive online maintenance and protection program. Early detection of defects and abnormalities is a critical step towards integrity assessment of dams, health monitoring, and overall risk management. To simulate the behavior of a dam during the construction time, it is necessary to precisely measure several parameters such as displacement, pore water pressure, leakage, etc. For this reason, multiple instrumental equipment are used [3].
Dam health monitoring is crucial to the project risk management and may significantly reduce the project risk exposure and future consequences, see Figure 1. A general risk management circle includes five steps:
- Identify: Establish the risk components.
- Analysis: Evaluate the likelihood of each risk element, and the associated consequences.
- Plan: Determine the general strategies to minimize the risk likelihood.
- Monitor: Continuously measure and update all variables that may indicate risk.
- Control: Take various risk reduction actions.
The health monitoring procedure is often used in the context of risk analysis to identify the potential failure modes (PFMs) [4]. The identified failure modes coupled with health monitoring are key metrics to understand the structural, hydraulic, and geothectical conditions. Postprocessing the dam monitoring data will identify the PFMs [5].
Many researchers provided recommendations for monitoring and analyzing earth dams and levees [6,7]. Instrumentation is used for a wide spectra of measurements to identify the variations of the physical and mechanical quantities that are implemented in the area of geotechnical engineering and constructing projects [8]. The quantities variations such as displacement, and water pressure are measured using instrumented data [9,10]. Placement of these instruments at sensitive locations on the dam structure along with proper measuring devices, and finally online data registration lead to a comprehensive dam safety assessment [11].
Structural failure of earth and rockfill dams may cause irreparable damages in the downstream facilities. The dam performance should be assessed from different behavioral aspects during health monitoring period (e.g., pore water pressures, tensions, displacements, and other controlling parameters). The results from these assessments and their corresponding interpretations should be regularly reported in a proper fashion. Moreover, special consideration in the event of emergencies (e.g., flood or earthquake) must be addressed [12]. By comparing the current and past behavior, the stability of the dam is evaluated [13].
Dam risk assessment can be utilized in various scales, from different perspectives, and also subjected to multiple hazards [14]. One may focus on macro-scale studies such as dam portfolio in a region [15], or perform a series of advanced numerical simulations [16,17,18], experimental tests [19,20], or field investigations on a particular dam. This paper attempts to investigate the capabilities of instrumentation in controlling the design and quality of an earth dam construction. Also, the stability of the dam is evaluated by examining its current condition. The most sensitive locations within the dam body is identified. The common concerns regarding the instrumented devices are addressed for the case study dam, and their impact on the overall stability is evaluated. This paper provides a comprehensive database for an earth dam with 10+ years of the monitored data.
2. Literature Review
Visual inspection was the first safety assessment method for embankments [11]. Next, instrumentation and monitoring tools were invented [21]. The 1853 recorded data from topographic levels of the Gross Bois in France can be considered as the first application of dam data monitoring [22]. During late 19th century, the open-pipe piezometers were used in USA, India, Europe, and Asia to study the leakage water running under the dams specialized for irrigation and being constructed on alluvial areas.
Instrumentation and monitoring of structures and reservoirs are important concerns in dam engineering [23]. The installation and monitoring of appropriate instrumentation are useful tools to visually investigate the safety of an embankment dam. Furthermore, instrumentation may be used to confirm that the long-term performance, such as creep deformation, is at the desired level [24]. In 1907, this kind of instrumentation was employed by the Britain to study the water level fluctuations in earth dams. In the USA, the reservoir water level and the hydrostatic gauges were initially employed in the rehabilitation office of earth dams to measure and record the water level, and pore water pressure [5]. The installation of the hydrostatic pressure gauges in 1938–1939 for Cobol Dam in the New Mexico, USA, is an example of early instrumentation [25]. Roy Karlson designed an instrument that measured the pressure using a sensor involving a stretched wire in the concrete and earth dams [12]. Also, in 1930s the researchers began to make use of the controlled instruments for the performance evaluation of the dam constructions with planning data, and the construction methods. This attempt led to the design of the two-piped hydraulic piezometers for measuring the pore pressure [26].
Gikas and Sakellariou [27] studied the long-term settlement behavior of Mornos Dam based on a finite element analysis in comparison with the records of installed instruments. Vibration wire sensors have a long life span, high accuracy, and stability. These sensors have been proved to be appropriate for special and severe environmental conditions [28]. Its exit signal frequency makes it less sensitive to the environmental noise and deficiencies in the conducting current than other sensors. Nowadays, the vibration wire sensors are the most applicable among the implemented instrumentation [29]. During 1930s and 1940s, the use of vibration wire sensors for behavior analysis gained popularity worldwide. In recent years, the instrumentation has gone under considerable changes that are indebted to the advancements of electronics and microcomputer technology. The advancements in these fields made it easier to collect and process the data; this has caused a change in the nature of instrumentation results. Recently, it has been made feasible to receive the information from dams’ instrumentation in the remotest areas of the world via satellites, and to transmit it to offices in other locations [30]. The information can be immediately simplified by computers and be put into a format that makes it possible to instantly recognize the performance deviations of the construction.
According to the statistical results from the investigation of 14,700 dams reported in ICOLD [31], Shi et al. [32], it was noticed that 7% were going to be destroyed and another 0.7% were totally destroyed. According to this report, a major part of the constructed dams was of earth and/or trench-type, and they had a very higher percentage of destruction in comparison to concrete dams (i.e., 74%). This clearly represents the necessity of the behavior analysis of earth dams [33].
The main failure modes of earth dams are piping and leakage from the dam body, foundation problems, and water overflow over the dam which can be identified by proper behavior analysis [34]. In a dam construction project, the instrumenting and stability analysis could be divided in four general phases: planning, construction, initial drainage, and operation. In each of the phases, the controlling parameters, such as leakage, displacement, and water pressure, are measured, evaluated, and controlled. According to the water level variations during the dam operation, the behavior analysis will gain high importance [35]. The rapid decrease or increase of the reservoir water level can lead to dangerous problems. Therefore, this issue must be under continuous control [36]. One may note that the dam behavior after severe events such as an earthquake or flood should be investigated individually for each dam [37].
3. Materials and Methods
3.1. Type of Instruments
The instruments used in dam monitoring can be divided into two main groups: [38]:
- Mechanical instruments: The main system of these instruments measures the quantity of interest directly and converts the measurement into a target parameter [39]. Their installation is easy, and in the case of failure, they can be easily replaced. Moreover, they are relatively cheap, and can be easily manufactured in a large amount. However, their application is limited in some conditions, and they may fail to properly meet the required measurement accuracy.
- Electrical instruments: They initially developed to cover the shortcomings of the mechanical instruments. Their measurement factor is mainly vibrational. Electrical instruments measure the quantity indirectly, and their reading results should be converted to the parameters via some formulas [40].
In another classification, the instruments can be categorized as follows. [41]:
- Stress measurements, e.g., Carlson soil stress meters and flat jacks.
- Pore pressure measurement, e.g., open standpipe piezometers and Casagrande piezometers.
- Flow measurement, e.g., weirs and impeller flow transducers.
- Temperature measurement, e.g., thermocouples and thermistors.
- Strong motion measurements.
3.2. Reading, Recording, and Processing the Data
The recording time of instruments should be in accordance with the instructions provided by the project instrumentation engineer. It usually requires a long enough time to capture the potential abnormalities. The time step should be dynamically adjusted based on the predicted (or recorded) variations. All other executive activities should be also recorded for future stability assessment purposes. Nearly all the response variations during the normal lifetime of dams are related to the changes in pool elevation and climate conditions (e.g., environmental temperature, amount of rainfall). Therefore, all the dam responses should be recorded in accordance to these variables, and visualized by time. Finally, the processing may require some level of corrections to the reading, as well as synchronizing multiple readings in a station.
The so-called cause and effect plots should be developed to properly address the response variations. For example, plotting the response variations, such as body and foundation deformation or pore water pressure versus to the pool level variations, is an effective way to explain the changes. Moreover, whenever the dam recording is interrupted (for example the instrument is failed), one may estimate the missing data by tracking the water level and temperature variations.
4. Case Study Dam
4.1. Boostan Dam Characteristics
Boostan Dam is constructed in Golestan province, and located ~35 km northeast of Gonbad city, and 23 km upstream of the Golestan Dam. The dam is placed on the Gorganrood River with coordination of 3725′30″ east longitude and 5525′00″ north latitude. The main purpose of this dam is flood control, irrigation. The dam is also capable of regulating 28 Mm water per year. General characteristics of the dam are summarized in Table 1. Figure 2a shows a satellite photo of Boostan Dam, and the general specifications of the dam and its associated structures are shown in Figure 2b.
4.2. Instruments in Boostan Dam
At the design stage of the Boostan Dam, six main sections were marked to be instrumented in the dam body. One of them (Section #2) is investigated in this paper. Section #2 is located exactly in line with the center of the former river axis, and the foundation has special sensitivities around there. Each of these sections comprises a set of tools such as standing and electric pipe piezometers and pressure measuring cells mounted at certain distances from the dam axis. In this dam, a total of 34 piezometers have been installed in 6 sections, 34 electrical piezometers in 3 sections, and 5 dampers in 3 different sections. Six pairs of pressure cells are also installed in a cross section (one horizontal and one vertical), as well as two triangular overflow discharge measuring tools on the left and right sides of the dam.
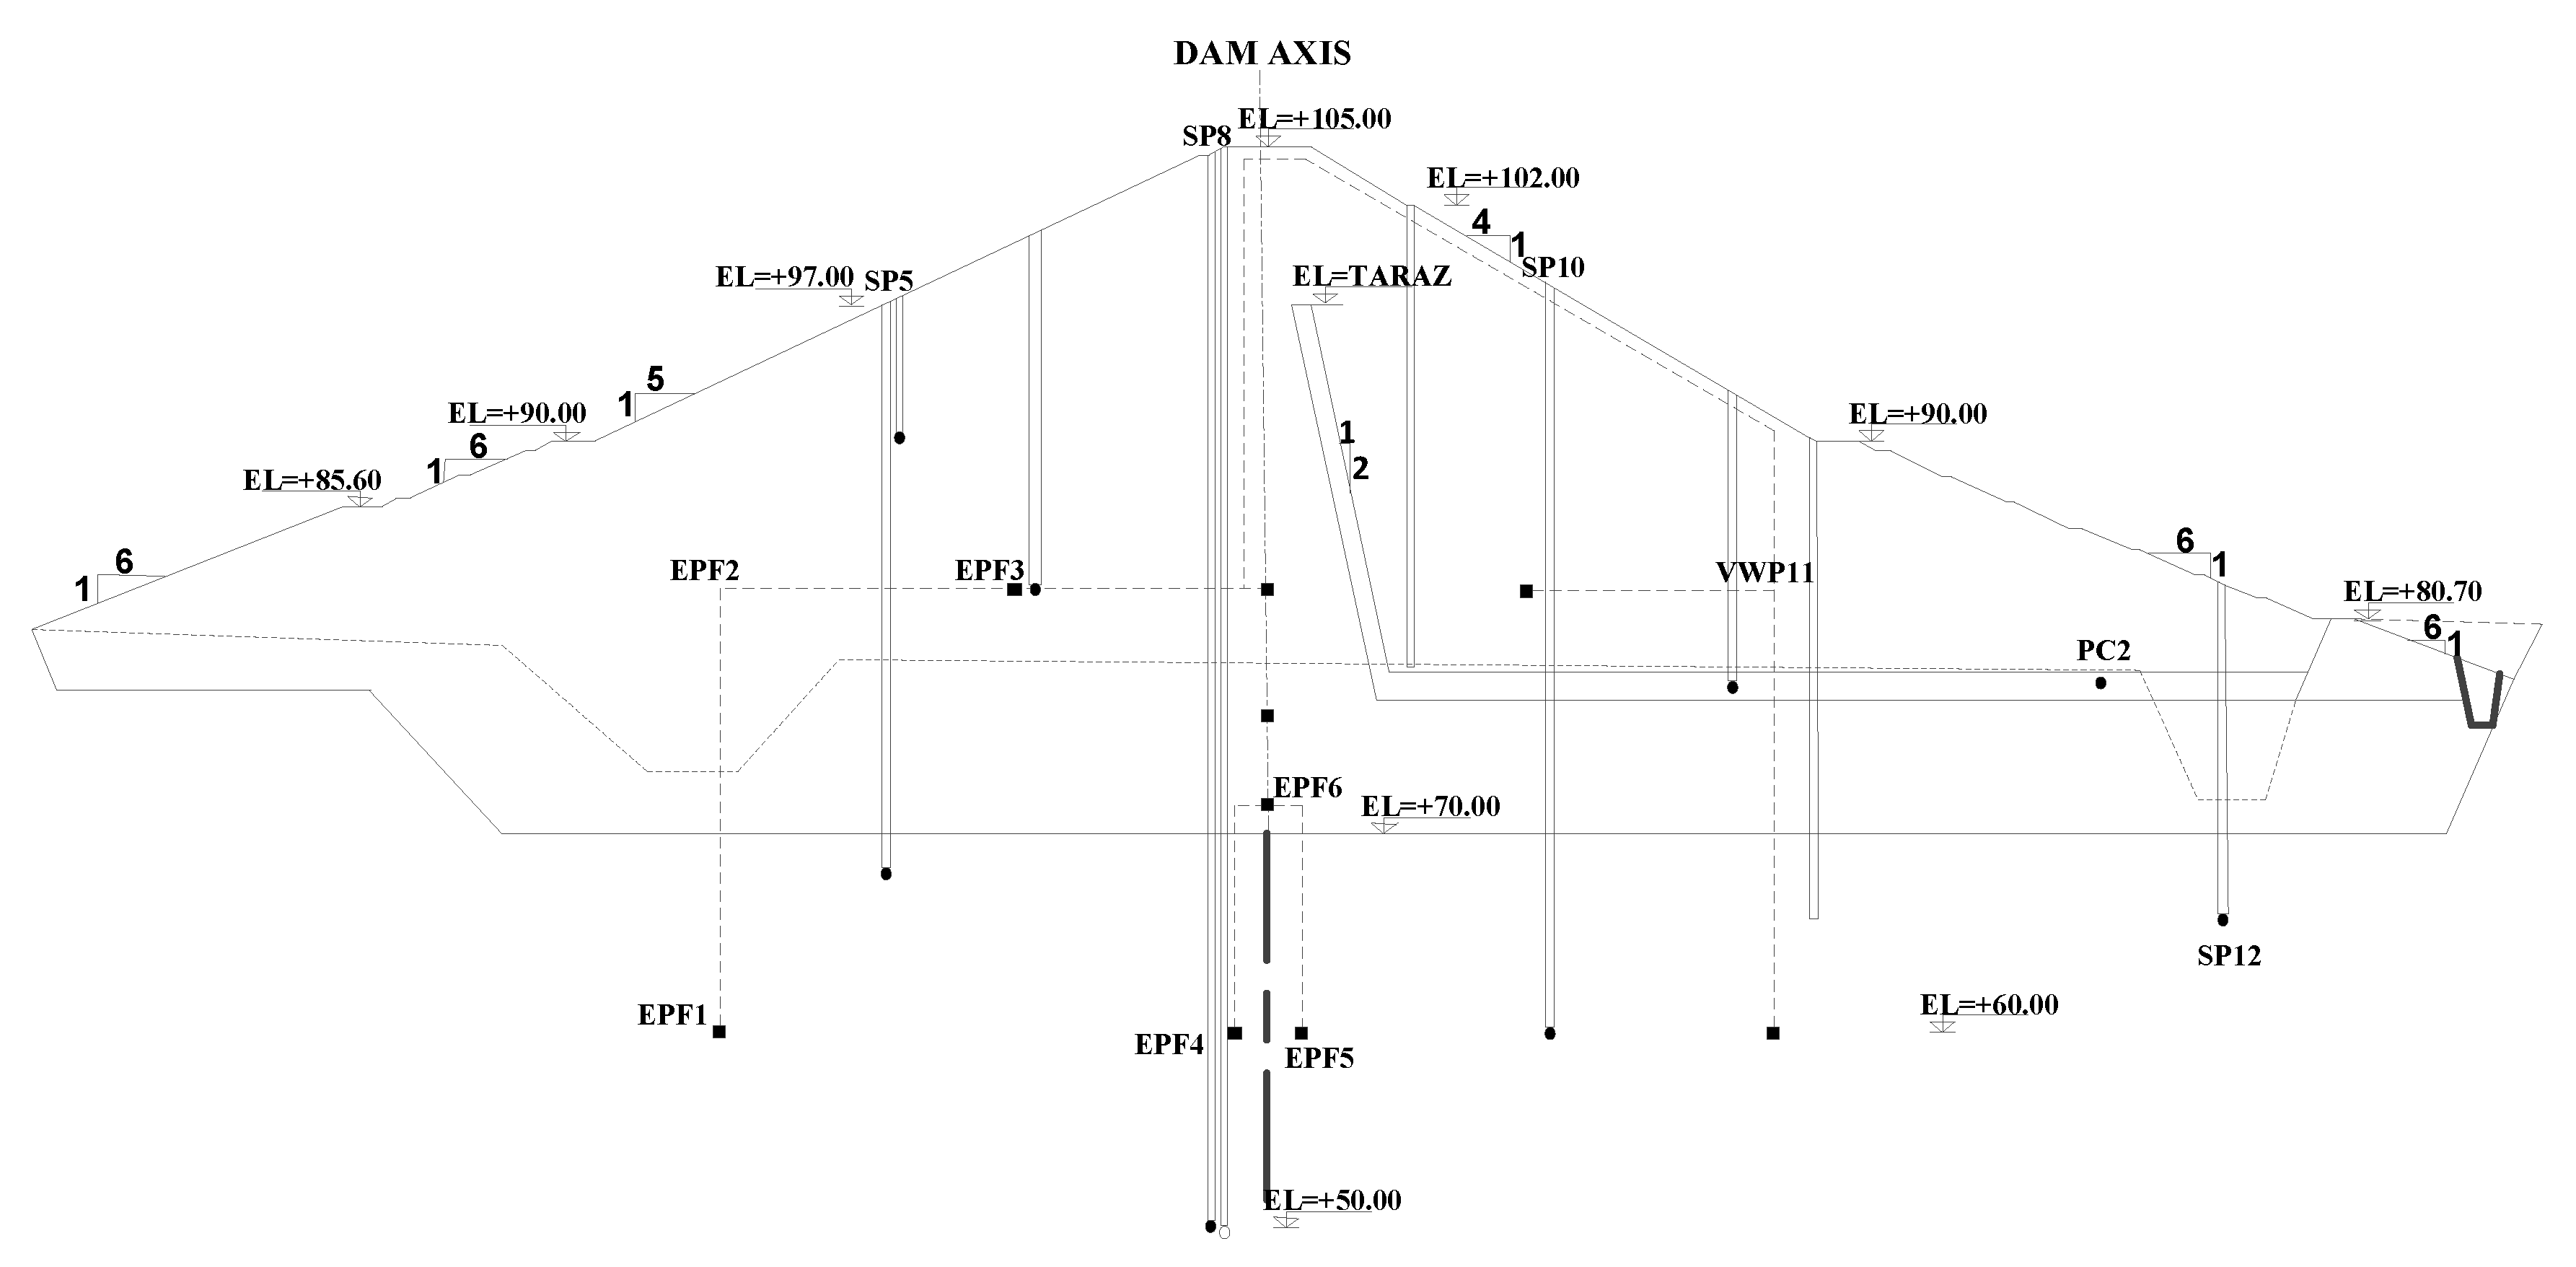
The drainpipes in the earth dams are required to ensure that the main body’s aggregates will not be washed off. In Boostan Dam, a horizontal drainage blanket has been used as a supplement along with the vertical chimney drainpipe. Also, considering that the chimney drainpipe was in the vicinity of the dam central line, the critical conditions of the leakage forces are considerably reduced. The installed instruments in the dam body and foundation of the Boostan Dam (to screen the piezometeric level fluctuations) are cascade and vibrational piezometers. The location map of these instruments for Section #2 are shown in Figure 3. The cut-off wall is built just below the body and the dam crest. It is extended 20 m beneath the dam base for Section #2. The cut-off wall damps the energy of the water passing under the dam, and avoids extensive uplift pressure by extending water passage through the porous soil. Therefore, its proper operation should be evaluated by the instrumented devices.
- Piezometers: Variation of pore water pressure is very important parameter in dam health monitoring. An increase in pore water pressure decreases the (effective) shear stresses (and thus treats the dam stability). The pore pressure leakage during the dam construction are affected by the leakage force from the water flow into the dam. The required time for downstream soil satiation and creation of a stable leakage has a direct relation to the soil type and the water regime behind the dam. In the Boostan Dam, a homogeneous earth dam, the drainage blanket is very effective, and can make the current lines vertical. Moreover, the presence of the drainage blanket reduces the pore water pressure to a great extent.
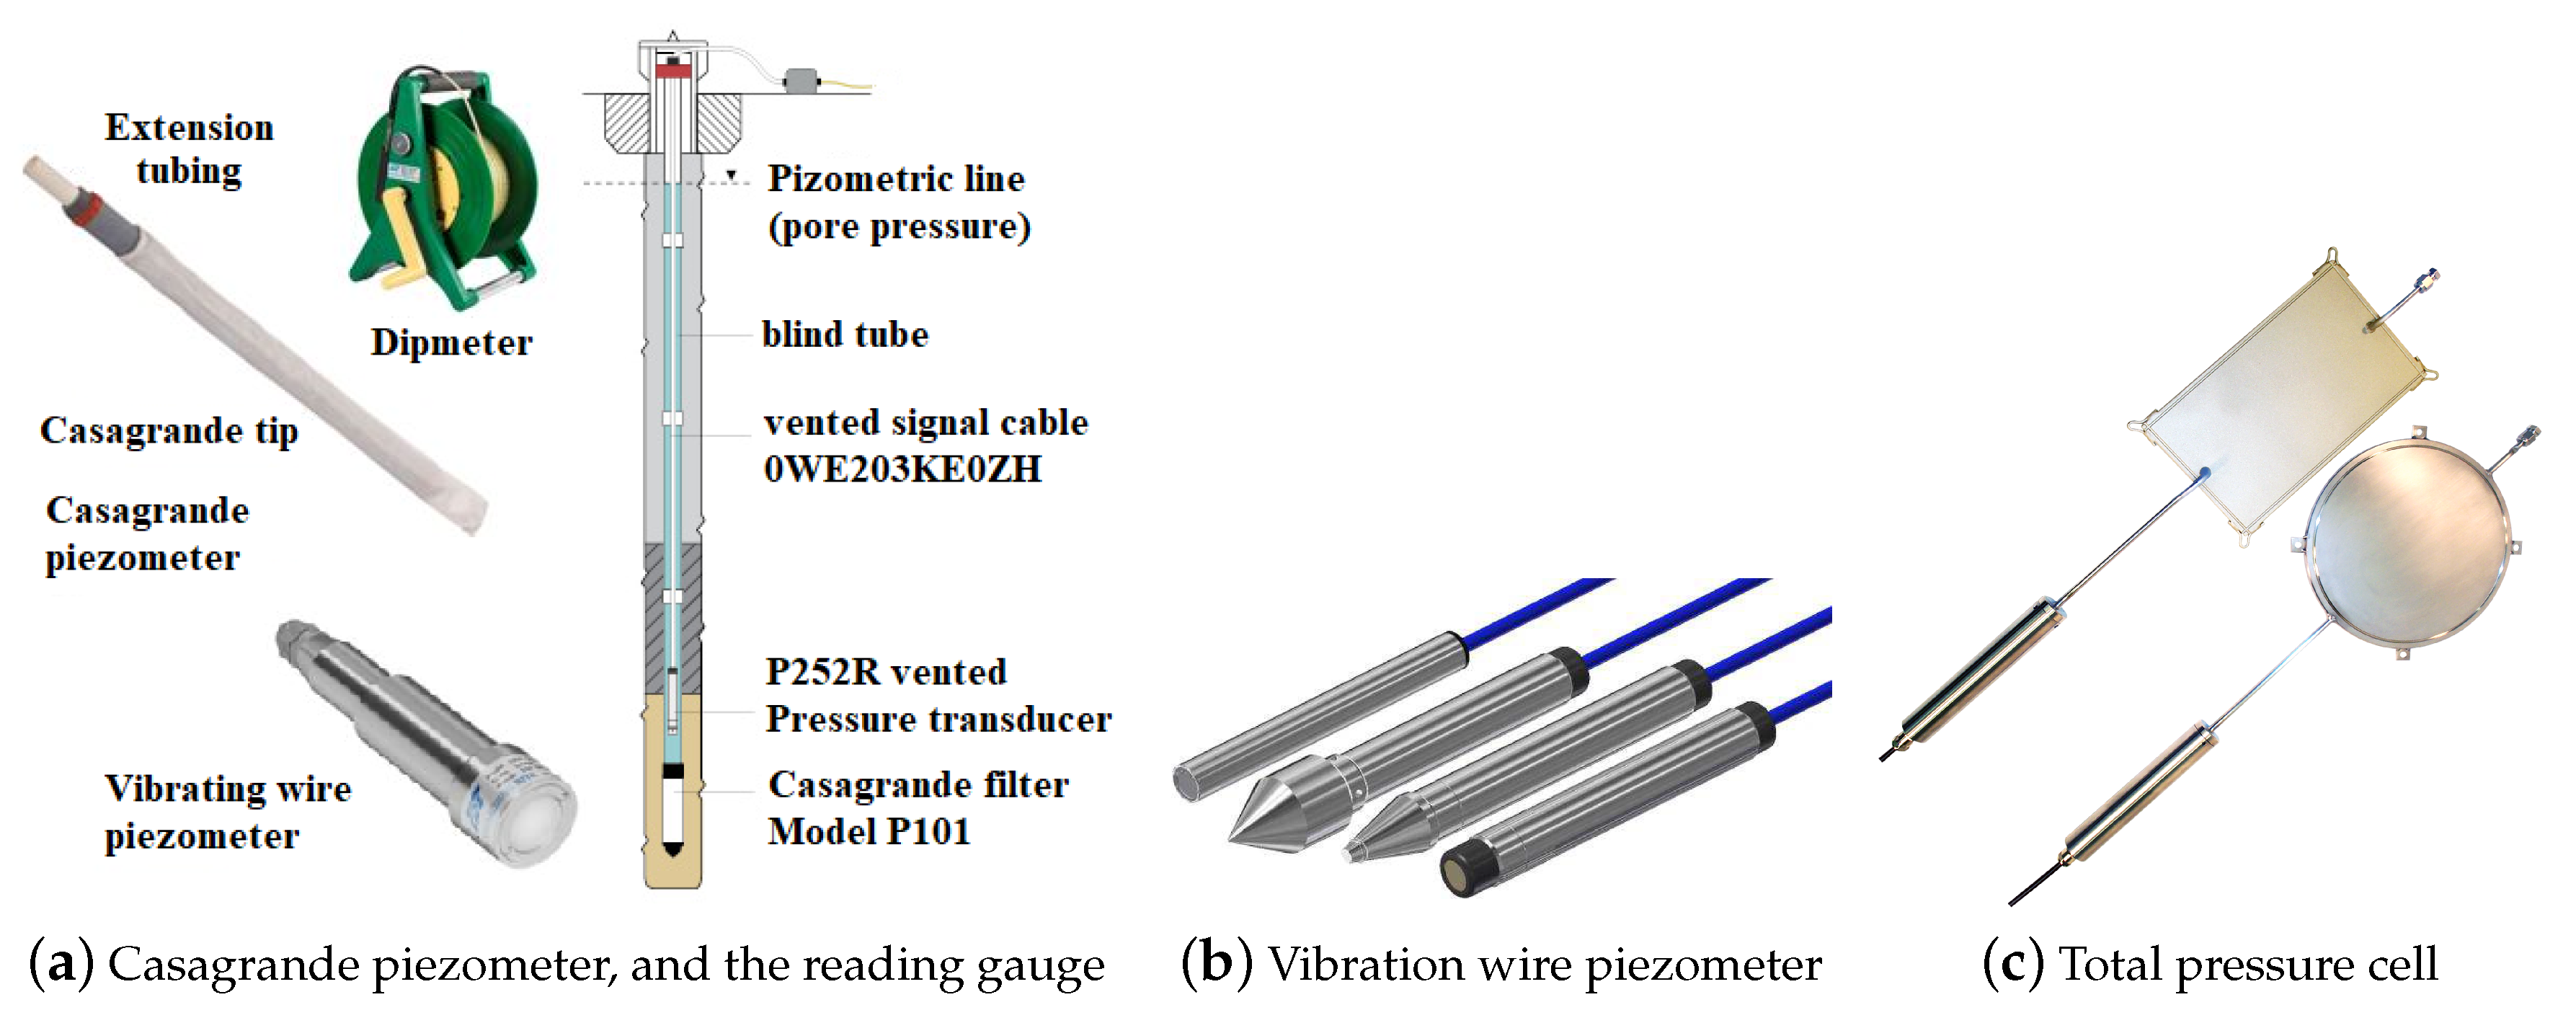
- Casagrande Piezometer: This is an effective and economical tool to measure the water pressure. It involves a plastic porous pipe at the bottom of the bore and a PVC pipe to record the water level. When the probe is entered into the pipe, upon its contact with water level, a continuous vocal signal is produced. The upstream level of the piezometer pipes in elongation is determined through survey operations, based on which the level and water height (total head) calculations are performed. Total head (or piezometeric level) is a summation of the installed piezometer level, z, and , where U refers to pore pressure. Figure 4a shows a sample of installed Casagrande piezometer. Table 2 shows the instrument specifications and their locations corresponding to Figure 3.
- Vibrating Wire Piezometer: The vibrational piezometers are reliable and stable instruments to measure the pore water pressure. The output of the piezometer includes a signal that is independent from impedance and the contact resistance, and can transmit the signal to a long distance. The sensor includes a porous tip piece often made of ceramic materials and a diaphragm. This diaphragm at its bottom is attached to a prestressed piece. When the pore pressure changes, the diaphragm moves, and alters the tension in the attached warp. The frequency of the normal vibration wire is a function of the imposed stress. Sample of the installed wire piezometer is shown in Figure 4b. Table 3 shows the instrument specifications and their locations corresponding to Figure 3.
- Total Pressure Cell: The effective soil pressure as well as the water pressure can be measured by total pressure cells. The instrument includes a flat cell filled with oil. The pressure imposed on the cell is imposed on the oil and is transformed into some signals by a transducer. They are connected to a digital reading device via some cables. This device measures the pressure imposed on the cell, see Figure 4c. A total of six pressure cells have been installed in Boostan Dam. Table 4 shows the instrument specifications and their locations. the location of TPC-2 can be found in Figure 3 at the lower discharge place.
5. Results and Observations
Data from instrumentation in Boostan Dam are recorded hourly, and collected monthly. Data are collected for approximately 12 years (2006 to 2018). The collected and filtered data are then used to plot several appropriate graphs, and finally to evaluate the stability of the dam.
5.1. Performance of the Casagrande Piezometers
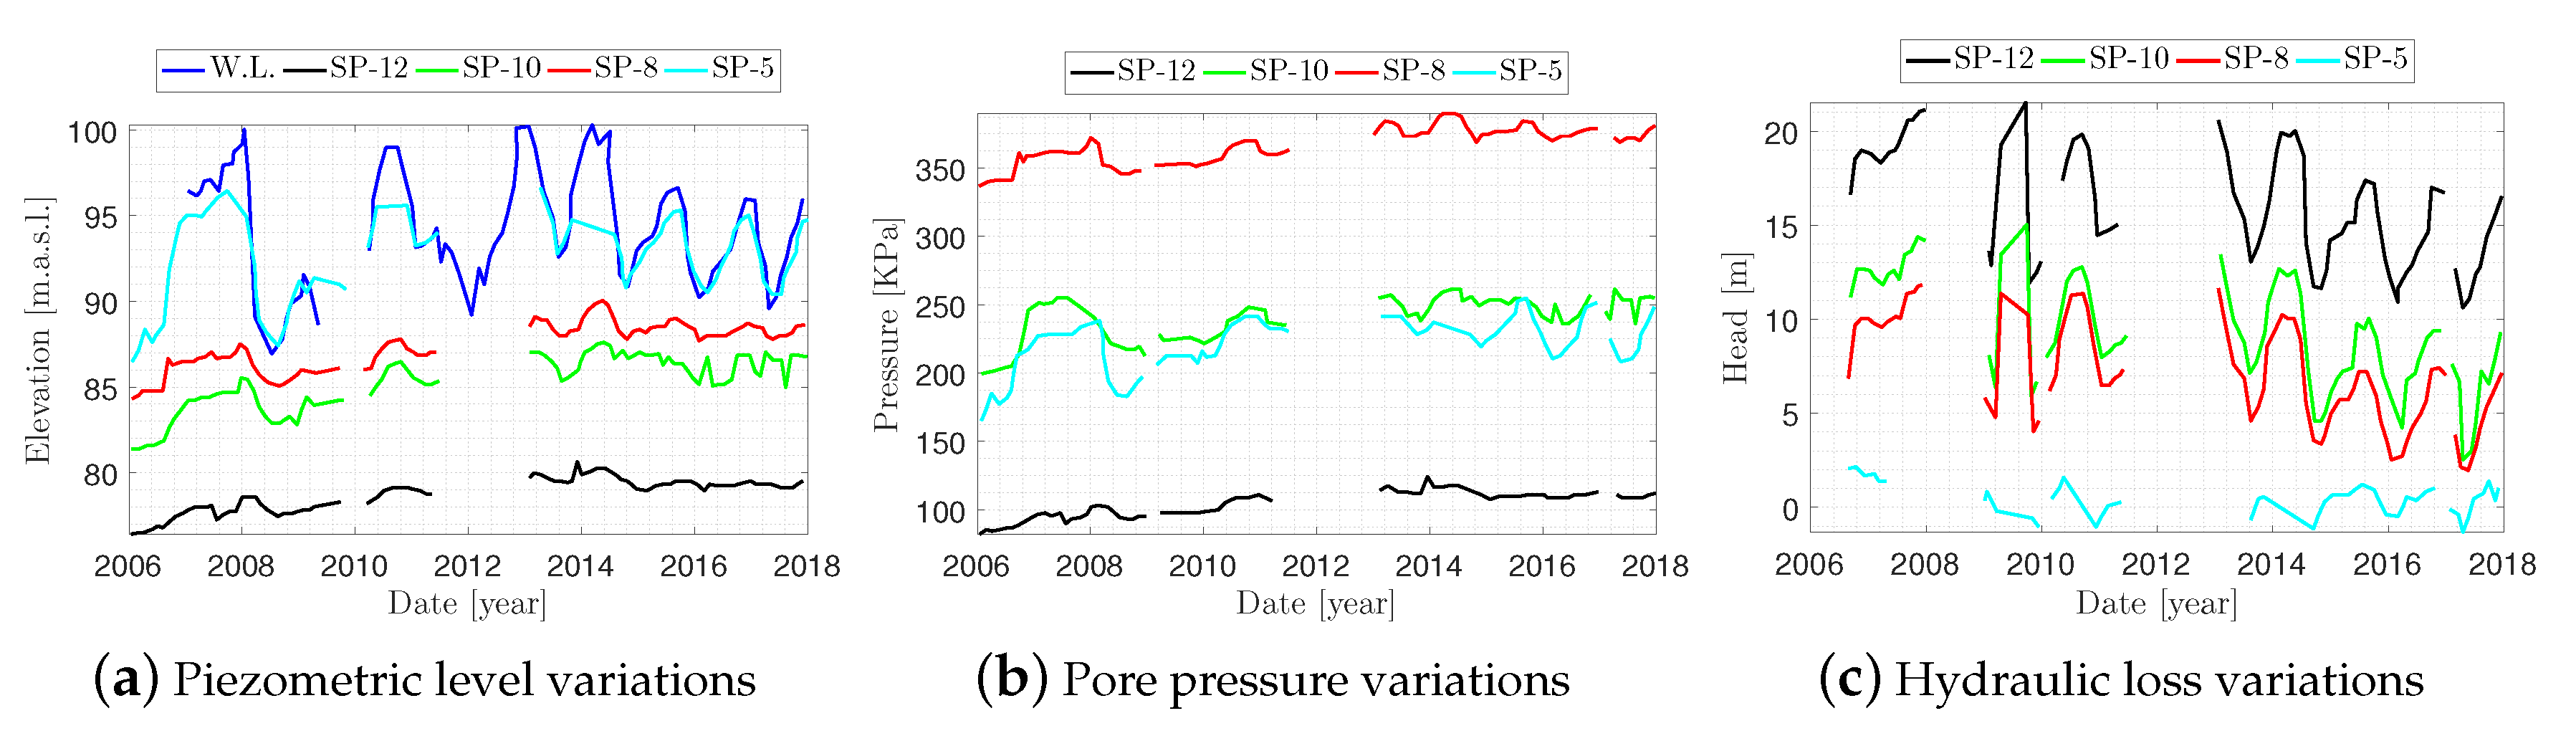
To evaluate the stability of the dam, three quantities are tracked: (1) piezometeric level; (2) pore pressure; and (3) hydraulic loss, see Figure 5. Four Casagrande piezometers have been installed in the foundation: SP-5 and SP-8 are located upstream of the dam, and SP-10 and SP-12 are located downstream of the dam. Screening the general trend of the piezometeric level variations reveals a reduction due to water passing through the foundation layers. Variations of the piezometeric level in SP-5 are in close agreement with pool level variations (which is reasonable considering the spatial location of SP-5 at level 69.5 m). The upper level of the piezometer pipe is located at 97 m, and thus we lose the reading if the pool level reaches this value.
SP-8 is installed at the upstream dam body (and is more close to the bottom of the cut-off wall), and is less sensitive to the water level fluctuations. SP-10 and SP-12 piezometers, which are located in the dam downstream, are more affected by the water level fluctuations and show a logical hydraulic loss compared to the reservoir level. The sudden jumps can be attributed to the reading and recording errors. As it is expected, the piezometeric level in SP-12 shows a considerable difference with regard to the reservoir water level. The water level fluctuations are effective on the piezometer’s behavior. According to these plots, the hydraulic loss is increased by getting away from the reservoir (e.g., SP-12). Total hydraulic loss in different piezometers is SP-5 from 0.0 to 2.18 m, SP-8 from 1.65 to 13.64 m, SP-10 from 2.43 to 15.53 m, and SP-12 from 9.23 to 21.5 m.
5.2. Performance of the Vibration Wire Piezometers
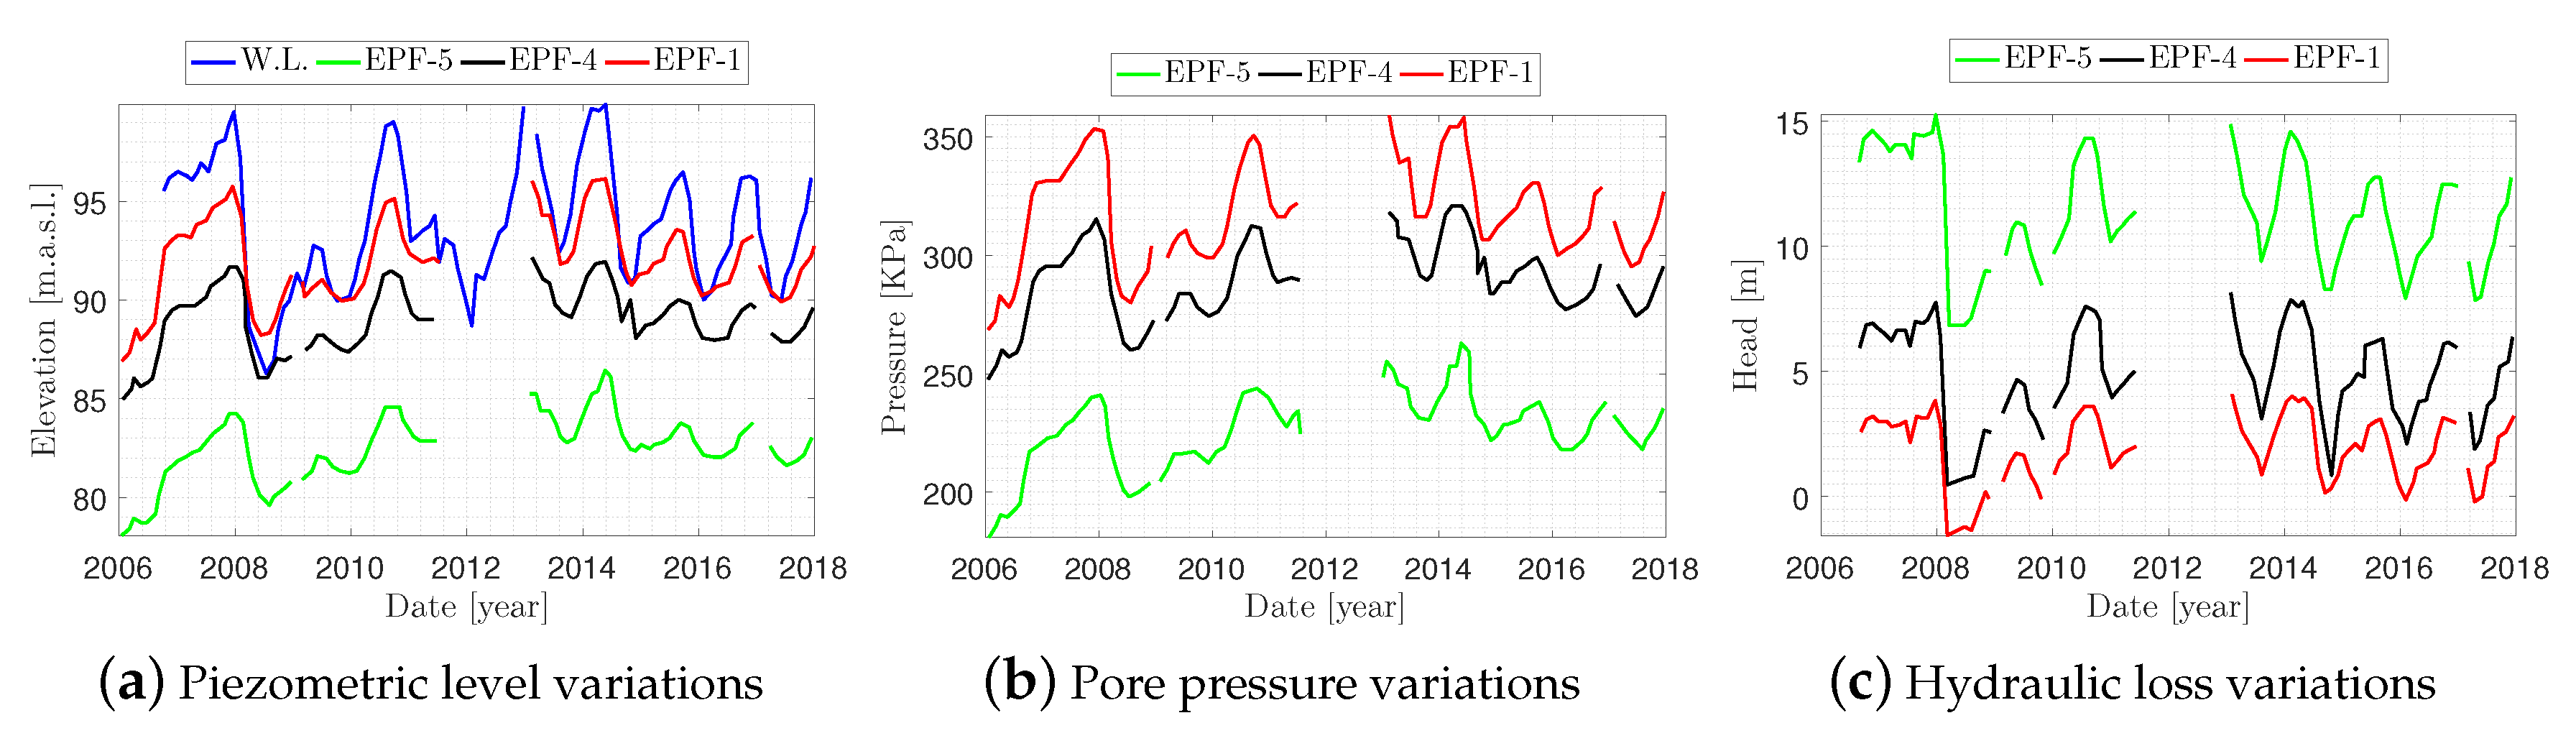
Similar to the previous section, the piezometeric level, pore pressure, and hydraulic loss curves are computed for the vibration wire piezometers; see Figure 6. Based on the locating map of the installed instruments, EPF-1 and EPF-4 are located in the upstream, whereas EPF-5 and EPF-10 piezometers are installed in the downstream cut-off wall at foundation level (EPF-10 is not operating anymore). According to the plots, the piezometeric level follows the same trend as the pool elevation at the upstream. For example, the piezometeric level in EPF-1 and EPF-4 is close to the reservoir level. The piezometeric level changes when the pool level exceeds 95 m.
The water head loss is increased by getting away from the reservoir. As seen, the general trend of fluctuations in the pore pressure is similar to those curves from the piezometeric level. Total hydraulic loss in different piezometers can be summarized as EPF-1 from 0 to 4.36 m, EPF-4 from 0.42 to 8.49 m, and EPF-5 from 6.91 to 15.38 m. Comparing the water head loss values in 2005 and the previous years, the general condition of the dam seems to be normal.
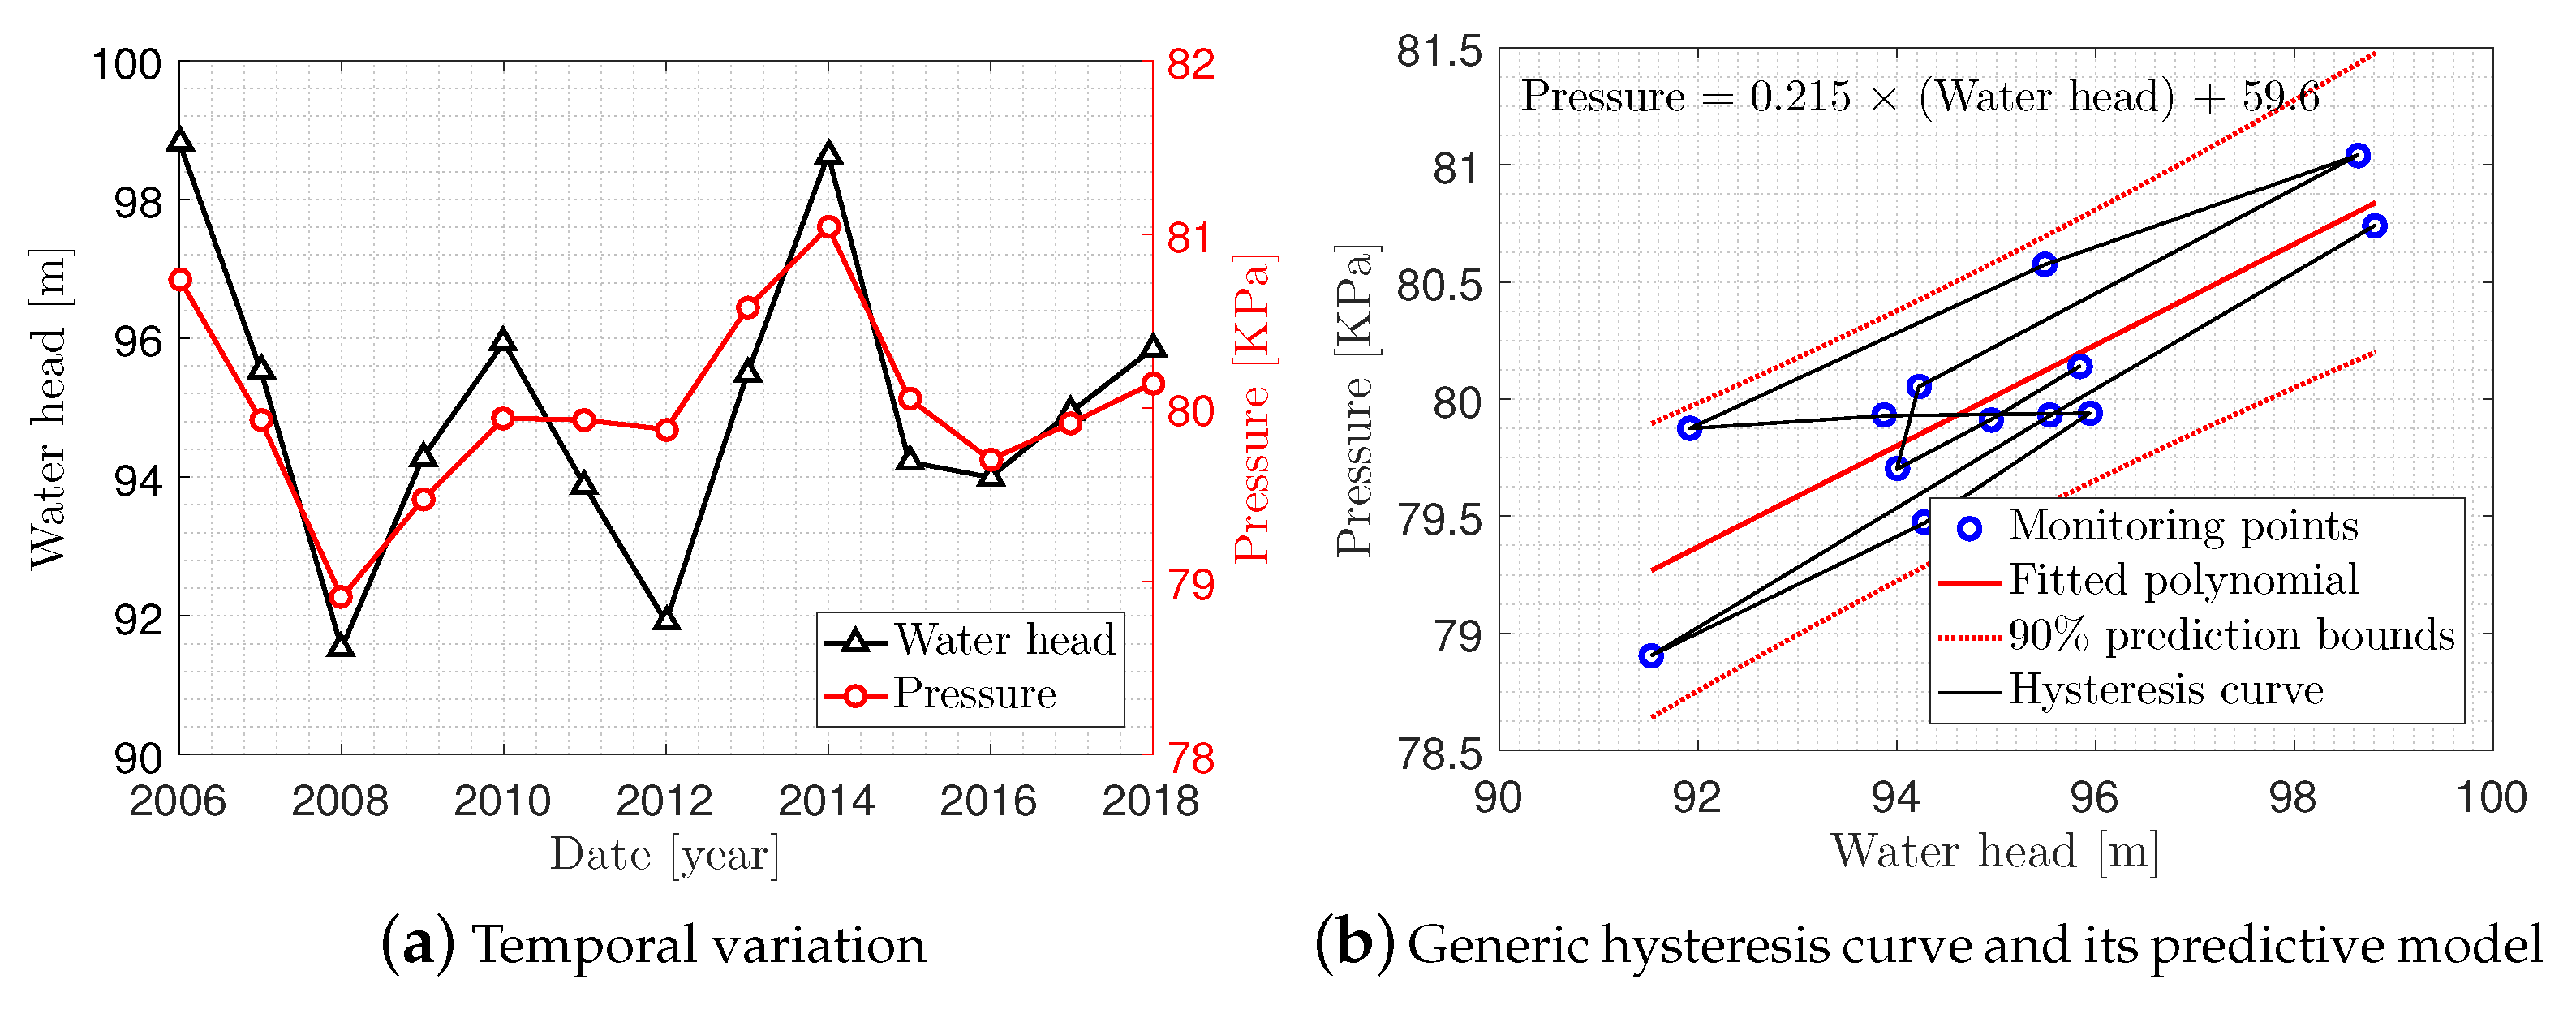
5.3. Hysteresis Curve of the Foundation Piezometers
A hysteresis curve presents a graph where the horizontal axis is the reservoir water level and the vertical one is the pressure head. The hysteresis curve is plotted for different recording dates, and thus is a metric to show the stability of the foundation and performance of the cut-off wall. The temporal nature of “water level” and “pressure” curves in Figure 7a is converted to the hysteresis curve in Figure 7b for a sample piezometer. The structural health of a dam foundation (i.e., the lack of scouring in the foundation particles) has a direct relation with narrow hysteresis curve. It is also possible to fit a first-order polynomial to the data points. Such a predictive model presents the pressure as a function of the water head.
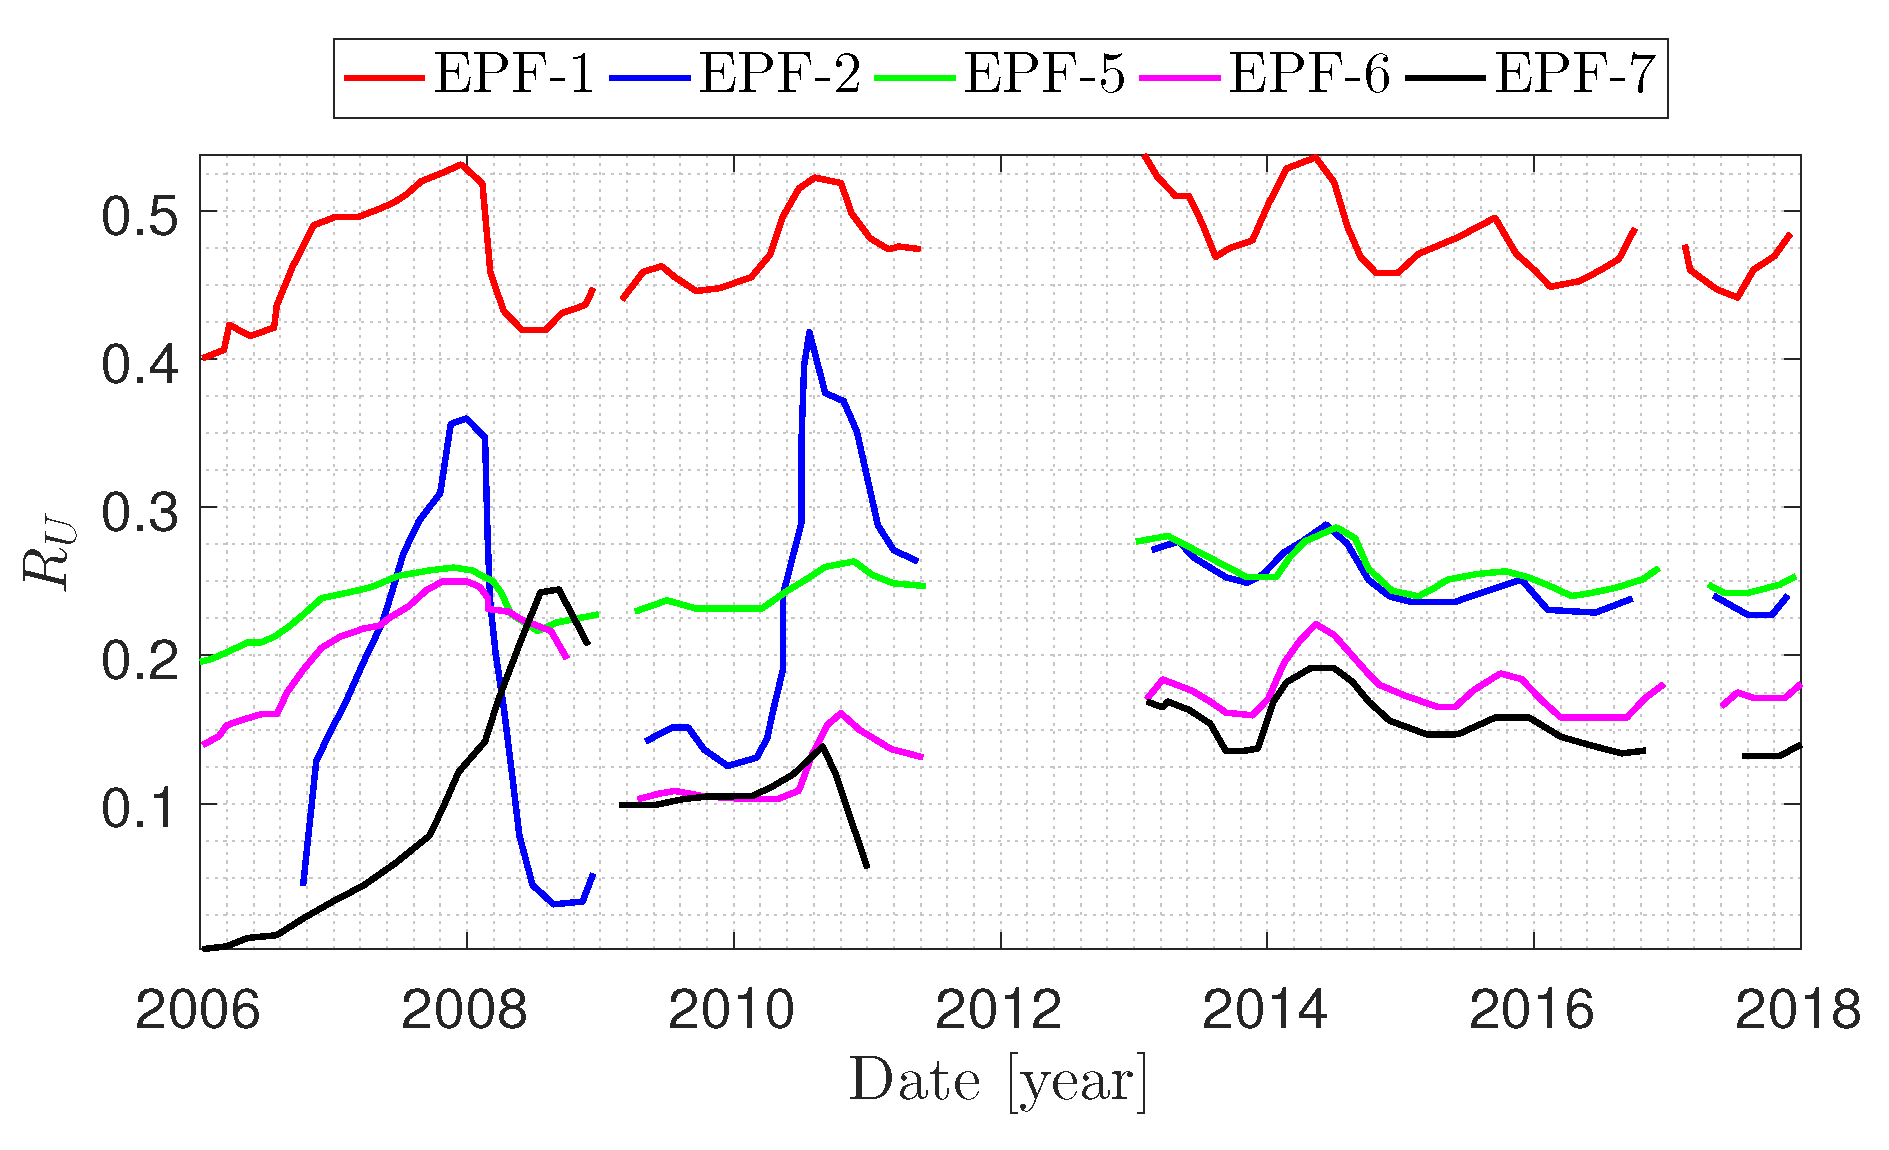
5.4. Excess Pore Pressure Ratio
The excess pore pressure ratio, , is defined as the fraction of pore pressure from pizometric reading, , to the vertical effective overburden stress, (where h presents the height and is the specific density). This is a very important parameter in the stability assessment of earth dams. The dam performance is evaluated as follows.
- If : Dam conditions are safe and favorable
- If : There is a potential risk. The considered section should be continuously evaluated for updated results.
- If : Dam is in a critical condition. As the pore pressure is high, the water tends to exit the soil. This may eventually lead to dam failure.
- If (i.e., ): A hydraulic failure occurs in the dam.
Variations of at Section #2 are plotted in Figure 8 for Boostan Dam. For the majority of pizometers, this value is less than 0.4, showing the satisfactory condition with no immediate risk of uplift. EPF-1 is located at the closest distance from the reservoir, and is highly affected then. The associated with this pizometer shows some values beyond 0.4 (and at some dates even beyond 0.5). Therefore, this section should be monitored regularly for any sudden changes in future.
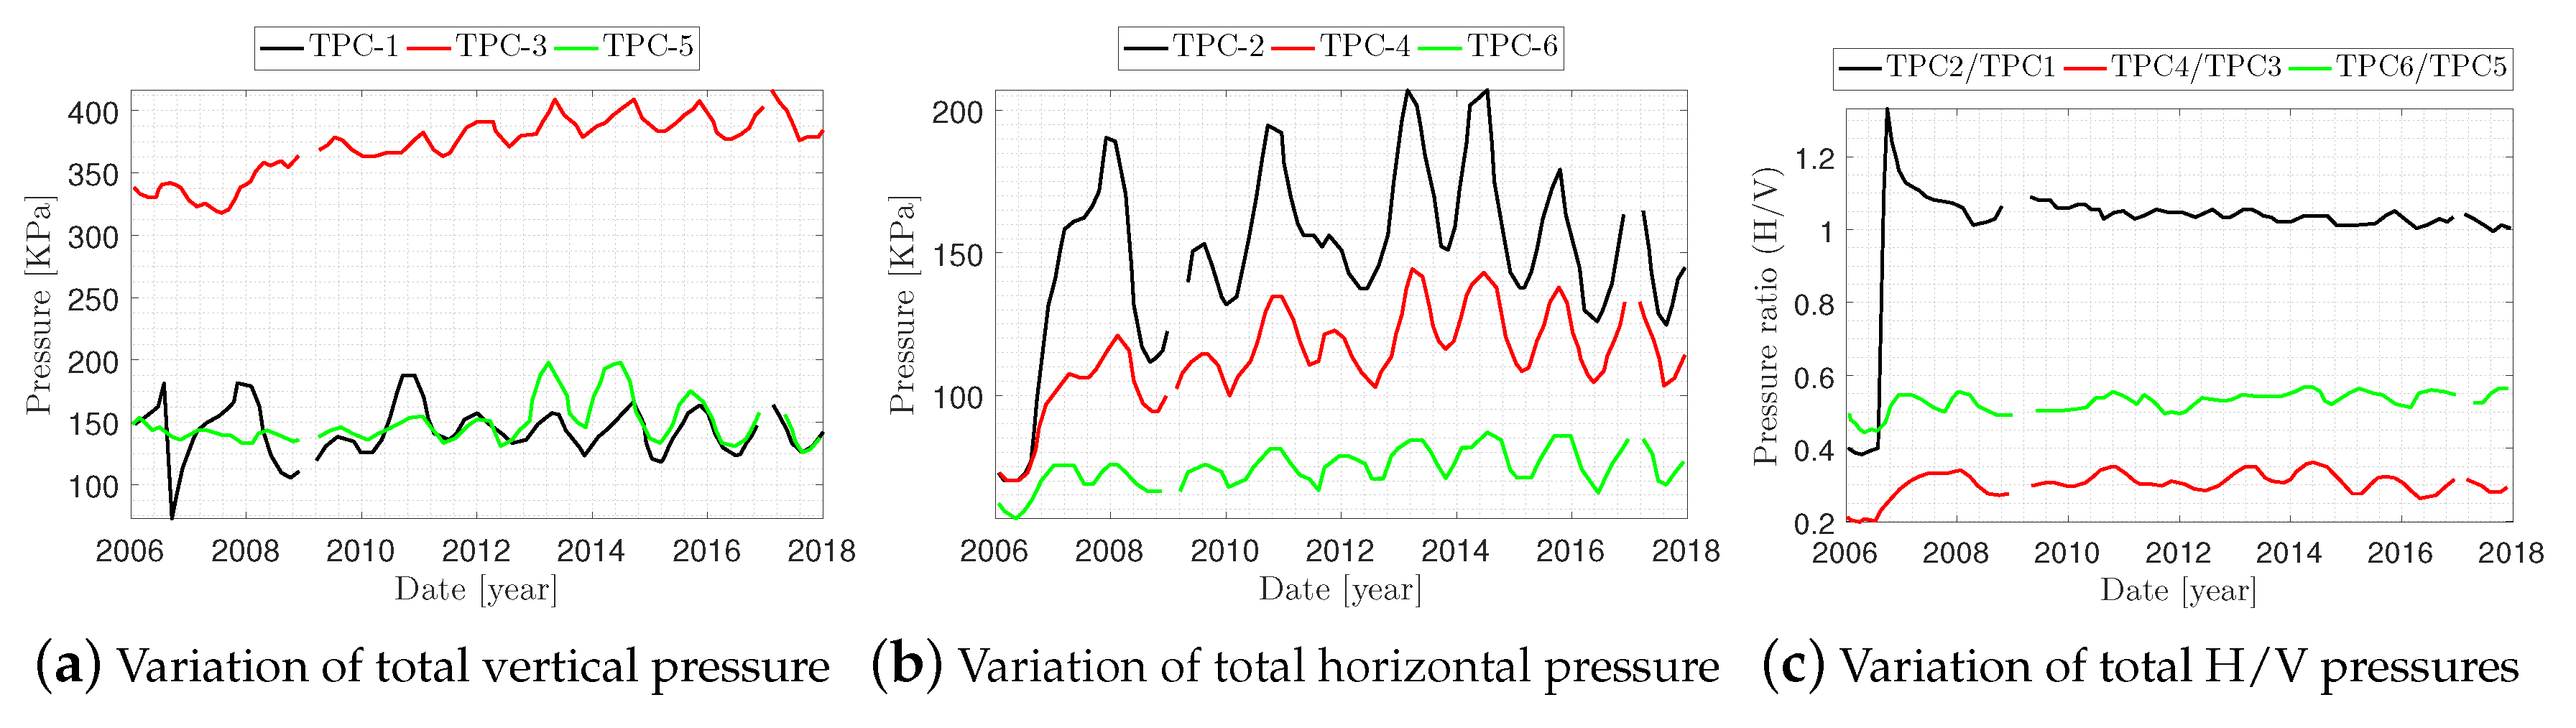
5.5. Performance of the Total Pressure Cells
The location and direction of six total pressure cells (TPC) are shown in Table 4. All of them are installed in Section #4. Variation of the vertical, horizontal, and ratio of total pressure are shown in Figure 9. In general, the fluctuations in both horizontal and vertical pressure components are consistent with the reservoir level variations. In the most of locations, the vertical pressure is higher than the horizontal one. Only in one location their ratio varies around unit. This results also show that TPC-4 is more sensitive to the water level.
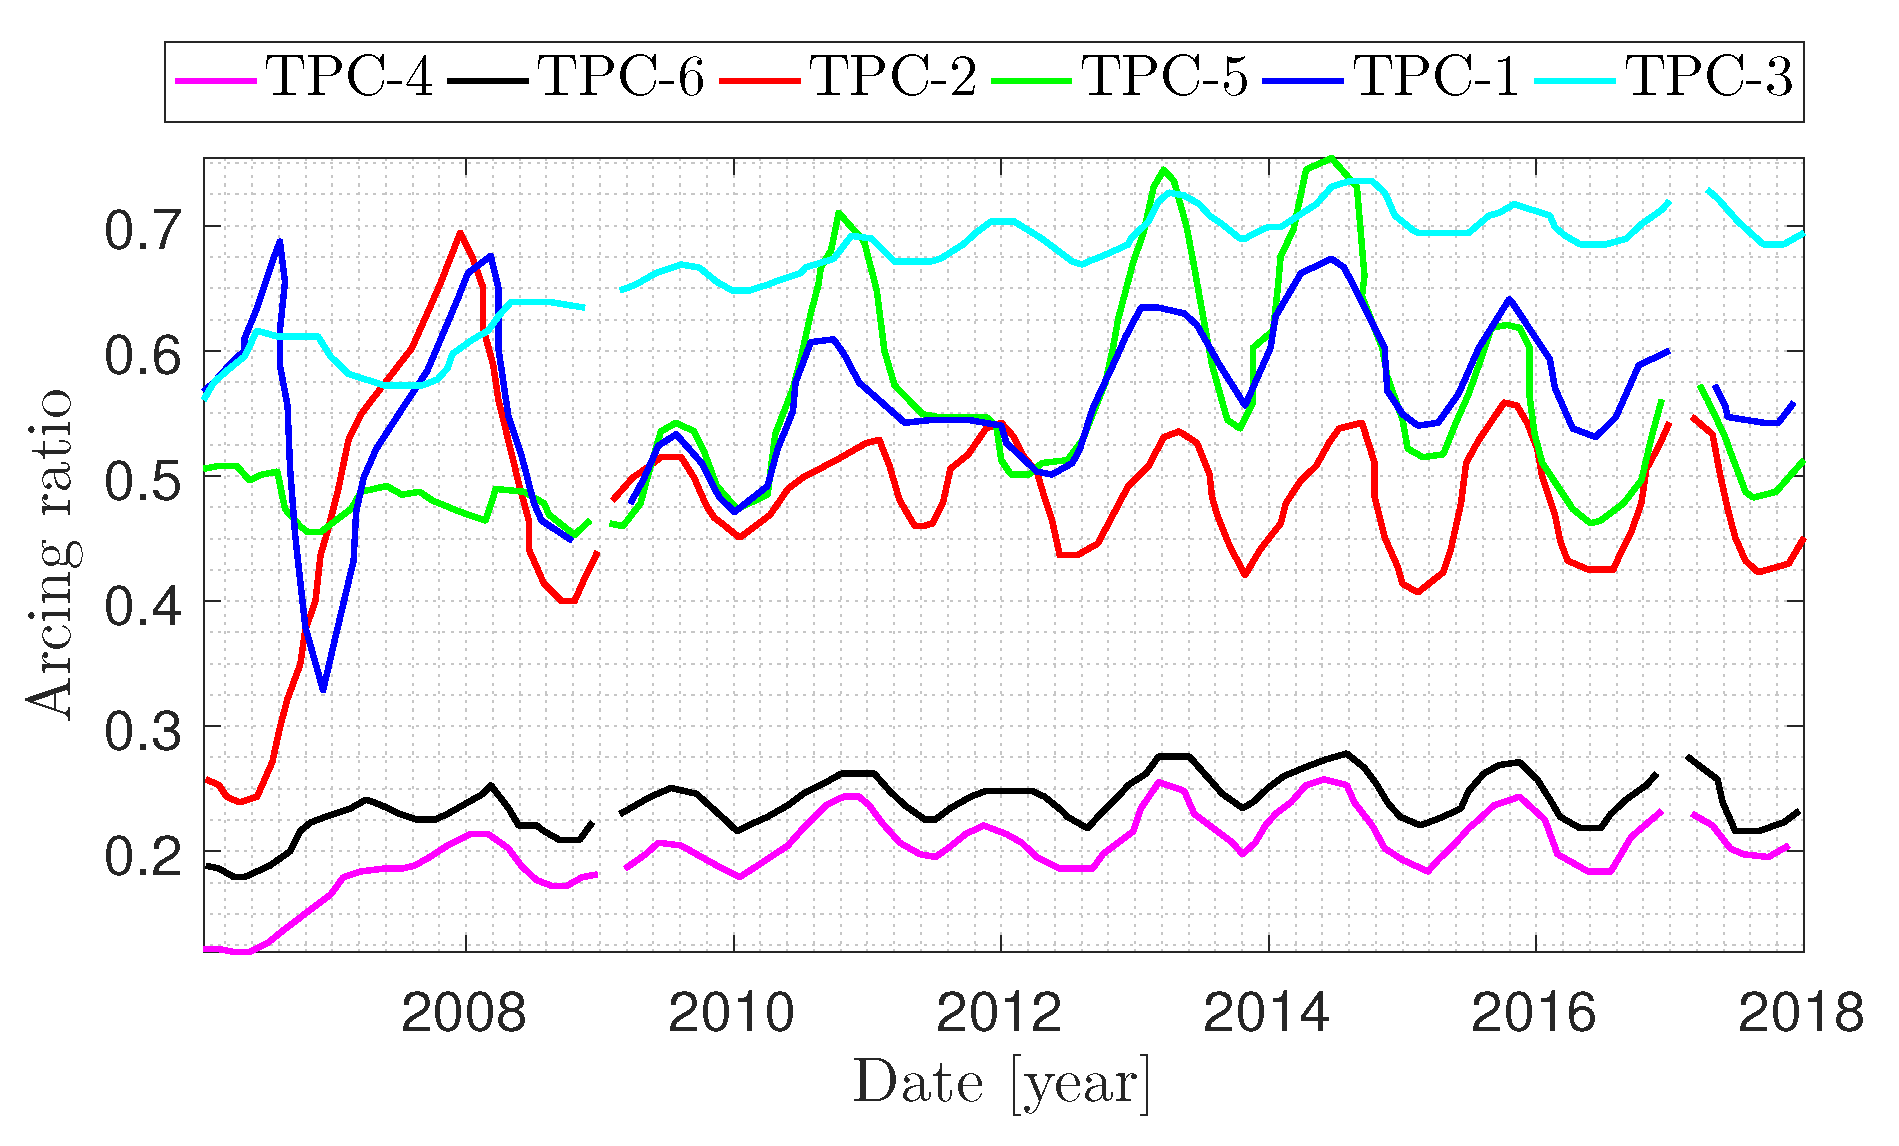
Finally, Figure 10 presents the variations of arcing ratio in different total pressure cells. It is simply the ratio of total pressure values to the soil overburden pressure. As seen, the ratios from TPC-1, TPC-2, TPC-3, and TPC-5 range between 0.3 and 0.7. They correspond to favorable and normal conditions. The curve associate with TPC-4 and TPC-6 shows smaller values, and it can be attributed to the fact that their direction is no longer aligned with the horizon.
6. Summary
This paper reports the findings of instrumented health monitoring of an earth dam, and the subsequent stability assessment. Three types of instruments (i.e., ordinary Piezometers, Casagrande piezometers, and total pressure cells) were used in this study, and their data were collected for about 12 years. Analyzing the collected data indicates that there is a considerable pressure drop due to the presence of cut-off wall on the dam axis. The results of piezometers show that the drainage is efficient, and the water table in the body is adequate. In the Boostan Dam, the excess pore pressure is acquired from the electrical piezometers data and their fluctuations over time indicate a safe operation of dam with no uplift risk. Finally, the instrument shows a reasonable horizontal stresses. Overall, the condition of the case study dam is assessed to be normal during its first 15 years of operation. Although there is a limited drainage at the downstream of the dam seal wall, it does not seem to be an immediate threat to dam safety.
Author Contributions
Conceptualization, S.M.S.-K., M.M.; methodology, S.M.S.-K.; investigation, S.M.S.-K.; resources, S.M.S.-K.; data curation, S.M.S.-K.; writing–original draft preparation, S.M.S.-K., M.M.; writing–review and editing, M.A.H.-A., F.P.-A.; visualization, S.M.S.-K., M.A.H.-A., F.P.-A.; supervision, M.A.H.-A.; funding acquisition, M.A.H.-A. All authors have read and agreed to the published version of the manuscript.
Funding
This research received no external funding.
Conflicts of Interest
The authors declare no conflicts of interest.
References
- USACE. EM 1110-2-1908: Instrumentation of Embankment Dams and Levees; Technical Report; USACE: Washington, DC, USA, 1995. [Google Scholar]
- Ballard, R.F. The US Army Corps of engineers seismic strong-motion instrumentation program. In Strong Motion Instrumentation for Civil Engineering Structures; Springer: Berlin/Heidelberg, Germany, 2001; pp. 157–166. [Google Scholar]
- Taylor, P.W. Engineering and Design: Instrumentation for Safety Evaluations of Civil Works Projects; Technical Report; USACE: Washington, DC, USA, 1985. [Google Scholar]
- On Dams, U.S.S. Routine Instrumented and Visual Monitoring of Dams Based on Potential Failure Modes Analysis; Technical Report; U.S. Society on Dams: Denver, CO, USA, 2013. [Google Scholar]
- Dunnicliff, J. Geotechnical Instrumentation for Monitoring Field Performance; John Wiley & Sons: Hoboken, NJ, USA, 1993; pp. 97–108. [Google Scholar]
- Robertson, K. An Instrument to Monitor the Tilt of Large Structures; Technical Report; Army Engineer Topographic Labs: Fort Belvoir, VA, USA, 1983. [Google Scholar]
- US Department of the Interior, Bureau of Reclamation. Design Standards No. 13: Embankment Dams; Technical Report; US Department of the Interior, Bureau of Reclamation: Denver, CO, USA, 2014.
- Lindsey, J.; Edwards, D.; Keeter, A.; Payne, T.; Malloy, R. Instrumentation Automation for Concrete Structures; Report 1: Instrumentation Automation Techniques; Technical Report; Wyle Labs: Hampton, VA, USA, 1986. [Google Scholar]
- Currier, B.; Fenn, M.H. Repair, Evaluation, Maintenance, and Rehabilitation Research Program. Instrumentation Automation for Concrete Structures. Report. 3. Available Data Collection and Reduction Software; Technical Report; Wyle Labs: Hampton, VA, USA, 1987. [Google Scholar]
- O’Neil, E.F. IInstrumentation Automation for Concrete Structures. Report 4. Demonstration of Instrumentation Automation Techniques at Beaver Dam, Eureka Springs, Arkansas; Technical Report; Army Engineer Waterways Experiment Station Vicksburg Ms Structures Lab: Vicksburg, MS, USA, 1989. [Google Scholar]
- Bartholomew, C.L.; Murray, B.C. Embankment Dam Instrumentation Manual; US Department of the Interior, Bureau of Reclamation: Denver, CO, USA, 1987; pp. 71–83.
- ASCE Task Committee on Instrumentation and Monitoring Dam Performance. Guidelines for Instrumentation and Measurements for Monitoring Dam Performance; American Society of Civil Engineers: Reston, VA, USA, 2000. [Google Scholar]
- Li, X.; Li, Y.; Lu, X.; Wang, Y.; Zhang, H.; Zhang, P. An online anomaly recognition and early warning model for dam safety monitoring data. Struct. Health Monit. 2019, 1, 145–166. [Google Scholar] [CrossRef]
- Hariri-Ardebili, M.A. Risk, Reliability, Resilience (R3) and beyond in dam engineering: A state-of-the-art review. Int. J. Disaster Risk Reduct. 2018, 31, 806–831. [Google Scholar] [CrossRef]
- Ecorys, O. The Role of Market-Based Instruments in Achieving a Resource Efficient Economy. In Report for the European Commission, DG Environment; Ecorys, Cambridge Econometrics and COWI: Rotterdam, The Netherlands, 2011. [Google Scholar]
- Farias, M.M.d.; Cordão Neto, M.P. Advanced numerical simulation of collapsible earth dams. Can. Geotech. J. 2010, 47, 1351–1364. [Google Scholar] [CrossRef]
- Seyed-Kolbadi, S.; Sadoghi-Yazdi, J.; Hariri-Ardebili, M. An Improved Strength Reduction-Based Slope Stability Analysis. Geosciences 2019, 9, 55. [Google Scholar] [CrossRef] [Green Version]
- Guo, X.; Dias, D.; Pan, Q. Probabilistic stability analysis of an embankment dam considering soil spatial variability. Comput. Geotech. 2019, 113, 93–103. [Google Scholar] [CrossRef]
- Matsushima, K.; Mohri, Y.; Yamazaki, S.; Hori, T.; Ariyoshi, M.; Tatsuoka, F. Design of earth dams allowing temporary overtopping based on hydraulic failure experiments and flood analysis. In Geosynthetics in Civil and Environmental Engineering; Springer: Berlin/Heidelberg, Germany, 2008; Volume 1, pp. 757–762. [Google Scholar]
- Sui, W.; Zheng, G. An experimental investigation on slope stability under drawdown conditions using transparent soils. Bull. Eng. Geol. Environ. 2018, 77, 977–985. [Google Scholar] [CrossRef]
- Piqueras, J.M.; Pérez, E.S.; Menéndez-Pidal, I. Water seepage beneath dams on soluble evaporite deposits: A laboratory and field study (Caspe Dam, Spain). Bull. Eng. Geol. Environ. 2012, 71, 201–213. [Google Scholar] [CrossRef] [Green Version]
- Frémion, F.; Bordas, F.; Mourier, B.; Lenain, J.F.; Kestens, T.; Courtin-Nomade, A. Influence of dams on sediment continuity: A study case of a natural metallic contamination. Sci. Total. Environ. 2016, 547, 282–294. [Google Scholar] [CrossRef]
- Mizuno, M.; Hirose, T. Instrumentation and monitoring of dams and reservoirs. Water Storage Transp. Distrib. 2009, 1, 1–8. [Google Scholar]
- Charles, J.; Tedd, P.; Watts, K. The role of instrumentation and monitoring in safety procedures for embankment dams. Water Resour. Reserv. Eng. 1992, 1, 311–320. [Google Scholar]
- Majoros, M.; Sneed, H.M. The softest program test system. J. Syst. Softw. 1981, 2, 289–296. [Google Scholar] [CrossRef]
- Jansen, R.B. Advanced Dam Engineering for Design, Construction, and Rehabilitation; Springer Science & Business Media: Berlin/Heidelberg, Germany, 2012. [Google Scholar]
- Gikas, V.; Sakellariou, M. Settlement analysis of the Mornos earth dam (Greece): Evidence from numerical modeling and geodetic monitoring. Eng. Struct. 2008, 30, 3074–3081. [Google Scholar] [CrossRef]
- Zhu, P.; Leng, Y.; Zhou, Y.; Jiang, G. Safety inspection strategy for earth embankment dams using fully distributed sensing. Procedia Eng. 2011, 8, 520–526. [Google Scholar] [CrossRef] [Green Version]
- Masoumi, I.; Ahangari, K.; Noorzad, A. Integrated fuzzy decision approach for reliability improvement of dam instrumentation and monitoring. J. Struct. Integr. Maint. 2018, 3, 114–125. [Google Scholar] [CrossRef]
- Chugh, A.K. Stability assessment of a circular earth dam. Int. J. Numer. Anal. Methods Geomech. 2013, 37, 2833–2859. [Google Scholar] [CrossRef]
- ICOLD. Deterioration of Dams and Reservoirs; Laboratorio Nationai de Engenharia Civil, LNEC: Lisboa, Portugal, 1983; pp. 1–312. [Google Scholar]
- Shi, Z.M.; Wang, Y.Q.; Peng, M.; Chen, J.F.; Yuan, J. Characteristics of the landslide dams induced by the 2008 Wenchuan earthquake and dynamic behavior analysis using large-scale shaking table tests. Eng. Geol. 2015, 194, 25–37. [Google Scholar] [CrossRef]
- Rashidi, M.; Haeri, S.M. Evaluation of behaviors of earth and rockfill dams during construction and initial impounding using instrumentation data and numerical modeling. J. Rock Mech. Geotech. Eng. 2017, 9, 709–725. [Google Scholar] [CrossRef]
- Hui, S.; Charlebois, L.; Sun, C. Real-time monitoring for structural health, public safety, and risk management of mine tailings dams. Can. J. Earth Sci. 2018, 55, 221–229. [Google Scholar] [CrossRef] [Green Version]
- Masoumi, I.; Ahangari, K.; Noorzad, A. Optimal monitoring instruments selection using innovative decision support system framework. Smart Struct. Syst. 2018, 21, 123–137. [Google Scholar]
- Masoumi, I.; Naraghi, S.; Rashidi-nejad, F.; Masoumi, S. Application of fuzzy multi-attribute decision-making to select and to rank the post-mining land-use. Environ. Earth Sci. 2014, 72, 221–231. [Google Scholar] [CrossRef]
- Meixner, O. Fuzzy AHP group decision analysis and its application for the evaluation of energy sources. In Proceedings of the 10th International Symposium on the Analytic Hierarchy/Network Process, Pittsburgh, PA, USA, 29 July–1 August 2009; Volume 29, pp. 2–16. [Google Scholar]
- Wieland, M.; Kirchen, G. Long-term dam safety monitoring of Punt dal Gall arch dam in Switzerland. Front. Struct. Civ. Eng. 2012, 6, 76–83. [Google Scholar] [CrossRef]
- Li, F.; Wang, Z.; Liu, G.; Fu, C.; Wang, J. Hydrostatic seasonal state model for monitoring data analysis of concrete dams. Struct. Infrastruct. Eng. 2015, 11, 1616–1631. [Google Scholar] [CrossRef]
- Machan, G.; Bennett, V.G. Use of inclinometers for geotechnical instrumentation on transportation projects: State of the practice. Transp. Res. Circ. 2008, 1, 1–92. [Google Scholar]
- Zhao, J.; Jin, J.; Zhu, J.; Xu, J.; Hang, Q.; Chen, Y.; Han, D. Water resources risk assessment model based on the subjective and objective combination weighting methods. Water Resour. Manag. 2016, 30, 3027–3042. [Google Scholar] [CrossRef]
Figure 1.
Interconnection of risk management with dam health monitoring and instrumentation.

Figure 2.
Boostan Dam.

Figure 3.
Instrumentation map of Boostan Dam in Section #2.

Figure 4.
Sample of installed instruments in Boostan Dam; photos adapted from www.sisgeo.com.
Figure 4.
Sample of installed instruments in Boostan Dam; photos adapted from www.sisgeo.com.

Figure 5.
Recorded data by Casagrande piezometers at Section #2.

Figure 6.
Recorded data by vibration wire piezometers at section #2.

Figure 7.
Developing a hysteresis curve.

Figure 8.
Variation of in Section #2.

Figure 9.
Variation of total pressure in Section #4.

Figure 10.
Variation of arcing ratio in total pressure cells in section #4.


Table 1.
General characteristics of the Boostan Dam. PMF: probable maximum flood.
| Body Specification | Reservoir Specification | Design Specification | |||
|---|---|---|---|---|---|
| Dam type | Homogeneous Earthen | Reservoir volume | 5 Mm | PGA | 0.15 g |
| Dam height | 35 m | Flood control volume | 18 Mm | Spillway capacity | 785 m/s |
| Dam length | 642 m | Normal level area | 4.1 km | Spillway type | Ogee |
| Foundation width | 265 m | Normal level high | 96 m | Spillway length | 40 m |
| Crest width | 10 m | Agriculture water volume | 28 Mm | Flood design | PMF |
Table 2.
Characteristics of Piezometers and Casagrande Piezometer installed in Section #2 of Boostan Dam.
Table 2.
Characteristics of Piezometers and Casagrande Piezometer installed in Section #2 of Boostan Dam.
| Name | Distance from Axis | Elevation | Location | Situation |
|---|---|---|---|---|
| SP-5 | 45.00 | 96.5 | Upstream | Foundation |
| SP-8 | 7.75 | 50.0 | Upstream | Foundation |
| Sp-10 | 33.00 | 61.0 | Downstream | Foundation |
| SP-12 | 113.25 | 68.0 | Downstream | Foundation |
Table 3.
Characteristics of Vibrating Wire Piezometer installed in Section #2 of Boostan Dam.
| Name | Distance from Axis | Elevation | Location | Situation |
|---|---|---|---|---|
| EPF-1 | 65.00 | 60 | Upstream | Foundation |
| EPF-2 | 65.00 | 85 | Upstream | Dam Body |
| EPF-3 | 30.00 | 85 | Upstream | Dam Body |
| EPF-4 | 3.85 | 60 | Upstream | Foundation |
| EPF-5 | 3.85 | 60 | Downstream | Foundation |
| EPF-6 | 0.00 | 72 | Axis | Foundation |
Table 4.
Specifications of total pressure cells installed in Boostan Dam.
| Name | Elevation | Direction | Location | Section |
|---|---|---|---|---|
| TPC-1 | 78.6 | Vertical | Lower Discharge | # 1 |
| TPC-2 | 77.6 | Horizontal | Lower Discharge | # 2 |
| TPC-3 | 77.1 | Vertical | Lower Discharge | # 3 |
| TPC-4 | 76.8 | Horizontal | Lower Discharge | # 4 |
| TPC-5 | 77.0 | Vertical | Lower Discharge | # 5 |
| TPC-6 | 75.9 | Horizontal | Lower Discharge | # 6 |
© 2020 by the authors. Licensee MDPI, Basel, Switzerland. This article is an open access article distributed under the terms and conditions of the Creative Commons Attribution (CC BY) license (http://creativecommons.org/licenses/by/4.0/).
Share and Cite
MDPI and ACS Style
Seyed-Kolbadi, S.M.; Hariri-Ardebili, M.A.; Mirtaheri, M.; Pourkamali-Anaraki, F. Instrumented Health Monitoring of an Earth Dam. Infrastructures 2020, 5, 26. https://doi.org/10.3390/infrastructures5030026
AMA Style
Seyed-Kolbadi SM, Hariri-Ardebili MA, Mirtaheri M, Pourkamali-Anaraki F. Instrumented Health Monitoring of an Earth Dam. Infrastructures. 2020; 5(3):26. https://doi.org/10.3390/infrastructures5030026
Chicago/Turabian StyleSeyed-Kolbadi, S.M., M.A. Hariri-Ardebili, M. Mirtaheri, and F. Pourkamali-Anaraki. 2020. "Instrumented Health Monitoring of an Earth Dam" Infrastructures 5, no. 3: 26. https://doi.org/10.3390/infrastructures5030026