
Comprehensive Economic Impacts of Wild Pigs on Producers of Six Crops in the South-Eastern US and California

1
USDA/APHIS/WS National Wildlife Research Center, 4101 Laporte Avenue, Fort Collins, CO 80521, USA
2
Department of Economics, Colorado State University, Fort Collins, CO 80521, USA
3
Savannah River National Laboratory, Aiken, SC 29808, USA
*
Author to whom correspondence should be addressed.
Agriculture 2024, 14(1), 153; https://doi.org/10.3390/agriculture14010153
Submission received: 17 October 2023
/
Revised: 17 January 2024
/
Accepted: 18 January 2024
/
Published: 20 January 2024
(This article belongs to the Section Crop Protection, Diseases, Pests and Weeds)
Abstract
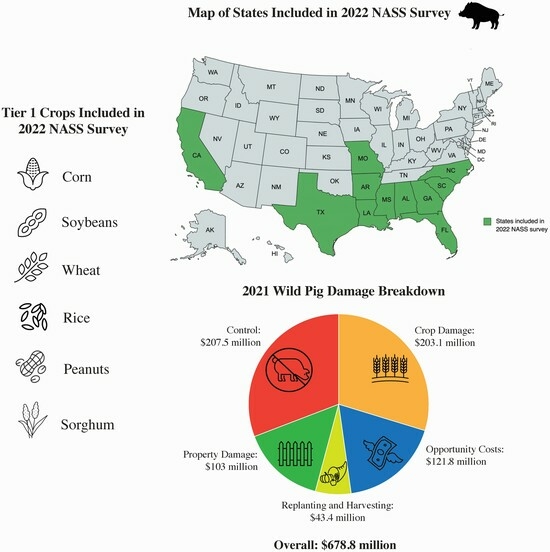
:Wild pigs (Sus scrofa) cause damage to agricultural crops in their native range as well as in the portions of the globe where they have been introduced. In the US, states with the highest introduced wild pig populations are Alabama, Arkansas, California, Florida, Georgia, Louisiana, Mississippi, Missouri, North Carolina, South Carolina, and Texas. The present study summarizes the first survey-based effort to value the full extent of wild pig damage to producers of six crops in these eleven US states. The survey was distributed by the USDA National Agricultural Statistical Service in the summer of 2022 to a sample of 11,495 producers of corn (Zea mays), soybeans (Glycine max), wheat (Triticum spp.), rice (Oryza sativa), peanuts (Arachis hypogaea), and sorghum (Sorghum bicolor) in these 11 states. Our findings suggest that the economic burden of wild pigs on producers of these crops is substantial and not limited to the direct and most identifiable categories of crop damage (i.e., production value lost due to depredation, trampling and rooting). We estimate that the annual cost to producers of these six crops in the surveyed states in 2021 was almost USD 700 million.
1. Introduction
Wild pigs (Sus scrofa) cause damage through depredation of crops, livestock and natural flora and fauna, habitat degradation, disease spread, property destruction, and vehicle collisions where they exist [1,2,3,4,5,6]. They are omnivorous and generally opportunistic in their food habits [4]. Wild pigs are listed as being among the 100 worst invasive alien species from around the world [7]. The term wild pig encompasses Eurasian wild boar, feral pigs (i.e., wild pigs solely of domestic ancestry), and hybrids between these two forms [4]. Since all three forms of wild S. scrofa exist in the US, the collective term wild pig will be used for the purposes of this study unless it is appropriate to use one of the more specific common names listed above.
Wild pigs are ecological generalists and occupy and exploit a wide variety of habitats on all of the continents except Antarctica [8], ranging from subarctic taiga to equatorial deserts [2]. Populations of these pigs in the US are most abundant and widespread in the southern tier of states and on the West Coast [4]. Introduced wild pigs have been present in these regions of the US since the 1500s and were recently estimated to collectively number approximately 6.5 million animals [9].
Several studies have been conducted in the native range that estimated the economic cost of wild pig damage to agricultural crops [10,11,12,13,14,15]. Similar studies have attempted to estimate crop damage at the state level in the US, but these studies focused on different scopes and contexts of economic damage using different estimation approaches, hindering comparisons across states (see [16]). Two multiple-state crop damage studies have also been published. For example, Anderson et al. [17] found that producers of the first tier of six high-value crops in 11 states suffered approximately USD 190 million in crop losses in 2014 due to wild pig damage. In addition, McKee et al. [18] found that producers of 6 different crops in 12 states lost an estimated USD 272 million in 2018 to wild pig damage. The estimates carried out by Anderson et al. [17] are a decade old, and while the authors in both studies acknowledged that total costs were likely much higher, both studies were limited to direct crop damage [17,18].
Other crop damage survey studies, while narrower in geographic scope, have reported a broader range of wild pig-related costs to agricultural producers [19]. The first objective of Carlisle et al. [19] was to identify and describe all categories of wild pig-related impacts or costs incurred by a sample of agricultural producers in Texas in 2018. They listed more than 20 categories of wild pig-related impacts and costs experienced by the surveyed producers. Most producers reported varying degrees of damage to fields due to wild pig rooting. The resulting unevenness of the ground contributed to additional labor and farm equipment fuel costs. Those producers who experienced rougher terrain at planting and/or harvest also identified additional wear and tear to their machinery. Further, more than half of the survey participants reported that the presence of wild pigs in their operation prevented them from growing a preferred crop or otherwise using their land for more profitable purposes. The most common lost opportunity was corn production. Some surveyed producers reported that, in the absence of wild pig impacts, they would have grown corn (or increased the corn acreage) instead of a less profitable and less desirable crop to wild pigs, such as wheat. Based on their study, Carlisle et al. [19] revealed a broader range of both direct and indirect impacts and costs associated with wild pig damage for agricultural producers than had been previously identified.
The objective of this study was to further investigate the extent of damage by wild pigs to crop production across multiple US states. Additionally, we wanted to revise the crop damage estimates published by Anderson et al. [17]. The survey instrument was modified from the version administered in 2015 to estimate perceived changes in wild pig populations and to account for specific categories identified in Carlisle et al. [19], which have not been included in previously published large-scale economic estimates of wild pig impacts on crop producers. These categories include the forgone profit due to not growing crops because of possible damage from wild pigs, additional time and expenses incurred while replanting or harvesting because of wild pigs or for wild pig management and damage repairs (including damage to a wide range of property and equipment items). The survey was designed to simultaneously capture information related to wild pig presence, crop damage, property damage, control methods, and hunting, but the focus of the present analysis is on comprehensive crop damage costs and property and control costs. As in 2015, the survey distribution targeted producers of corn (Zea mays), soybeans (Glycine max), wheat (Triticum spp.), rice (Oryza sativa), peanuts (Arachis hypogaea), and sorghum (Sorghum bicolor). The present study also focused on the same 11 states (i.e., Alabama, Arkansas, California, Florida, Georgia, Louisiana, Mississippi, Missouri, North Carolina, South Carolina, and Texas), which also have the most abundant and widespread introduced wild pig populations in the US.
2. Materials and Methods
All surveys were designed by researchers at the USDA’s National Wildlife Research Center and distributed by the USDA National Agricultural Statistical Service (NASS) to targeted producers of any of the six crops in the aforementioned 11 states with known wild pig populations. The survey sampling methodology is described in Appendix A.
For this study, we focused on five types of information collected by the survey. The first is the presence of wild pigs as it provides a general indication of the economic threat they pose in the area. We asked general questions regarding the presence and perceived change in wild pig populations in the producer’s county and on their operation (Figure A1 in Appendix B). We then used a series of questions to solicit information regarding potential lost profit due to not planting crops because of concerns over potential wild pig damage (Figure A2 in Appendix B). Producers of any of the six crops were then identified and could choose to respond for up to three of their highest-valued crops harvested on their operation in 2021. Self-reporting wildlife damages to crops is common because of its cost-effectiveness over a variety of production regions, and it has been shown to provide reliable estimates [20,21,22,23]. The structure of the questions enabled us to capture information from producers that experienced no crop damage from wild pigs so that we could use the survey results to extrapolate to the state level (Figure A3 in Appendix B). The methodology to estimate crop damage in percent was described by Anderson et al. [17]. Current production values for the selected crops and states were obtained from NASS Quick Stats by multiplying production amounts in bushels (for grain crops), pounds (for peanuts), or hundredweights (for rice) for the year 2017 (the most recent available census year at the time of writing) with sales price per unit from 2022. We also subset the data to counties where at least one producer reported wild pig presence in their operation and estimated the distribution of mean crop damage by county for each of the six studied crops across the subset of counties. The survey questionnaire also asked a detailed set of questions on 15 different property items to estimate their level of damage and the associated hours and money spent on repair (Figure A4 in Appendix B). Finally, we enquired about the entities performing wild pig control on the landowner’s property and the cost and effectiveness of the methods used (Figure A5 in Appendix B).
Wild pig damage was estimated at the state level accounting for differences in commodity production and producer response rates. To account for differences across commodities, NASS calculated a weighting score for each producer that accounts for statewide production of each commodity, as the inverse of a producer’s probability of selection (), adjusted to account for non-response by other producers. These producer-level weights were then adjusted for non-response to specific questions, allowing estimation of wild pig damage at the state level. NASS employs a disclosure limitation methodology to protect the private information of producers. The first criterion is a threshold rule, where each summarized estimate must be computed from at least three weighted farms. This means any time there are only one or two weighted operations, the value of that cell is categorically suppressed. The second criterion is a dominance rule; NASS uses different dominance rules in different circumstances. The (n, k) rule invokes a suppression when the top n producers account for k percent or more of the estimated total. In other words, a (2, 80) rule will suppress a cell when the top 2 producers represent 80 percent or more of that cell total. The p-percent rule requires sufficient protection so that the largest producer value cannot be approximated to within a range of p-percent. For example, a 20-percent rule will suppress a cell if revealing that total allows someone to estimate the top producer value to within plus or minus 20 percent. Federal statistical agencies do not publicly disclose the actual values of n, k, or p, as revealing them compromises the protection of the source. For these reasons, some categories of damages cannot be reported and are denoted with a “(D)”. In these cases, there may be positive loss in this category, and these values should not be interpreted as a zero or missing. For categories where the value of more than one state or crop type cannot be disclosed, the total may still contain the undisclosed values, and therefore be different from the sum of the reported values in that column. This also implies that the state-level estimates should be interpreted as lower bounds of the true damages.
3. Results
A total of 11,495 surveys in 11 states were mailed by NASS, with a follow-up with non-respondents by phone. The final response rate was 52.2%, for a total of 6002 responses including 1468 refusals, for an effective response rate of 39.4%. All the results presented are estimated at the population level.
3.1. Population
3.1.1. Wild Pig Presence in County in the Last Three Years
Florida had the highest percentage of producers reporting wild pigs in their county in the last three years (87%), followed by Texas and Louisiana (each at 84%), while Missouri had the lowest fraction of producers reporting wild pig presence in their county over the same period (28%) (Figure 1 and Table A1).
Among producers who reported wild pig presence in their county in the previous three years, Alabama, Arkansas, Georgia, Louisiana, Mississippi, and Texas had greater than 50% of producers reported that the wild pig populations in their county had somewhat or substantially increased during this period, with Louisiana the highest (83%) and Texas the second highest (70%, Figure 2, Table A2). The remaining states surveyed all reported fewer than 50% of producers reporting that wild pigs had increased in their county, with Missouri reporting the fewest (33%) and North Carolina the second-fewest (34%). Missouri also reported the greatest percentage of producers reporting that wild pigs decreased in population in their county (23%), while the remaining states all reported fewer than 10% of producers saying populations had decreased in their county.
3.1.2. Wild Pig Presence on Operation in the Last Three Years
Texas reported the highest percentage of producers with wild pigs in their operation in the last three years (73%) and Louisiana the second highest (65%), while North Carolina, Missouri, and California had the lowest fraction reporting wild pig presence on their operation over the same period at 9%, 12%, and 13%, respectively (Figure 3, Table A1).
Among producers who reported wild pig presence in their operation in the previous three years, all states surveyed except California, Missouri, and North Carolina had more than 50% of producers reporting that wild pig presence somewhat or substantially increased in their operation, with Louisiana reporting the highest increase (87%, Figure 4, Table A3). Missouri had the highest percentage of producers reporting a decrease of wild pigs in their operation (54%), with the rest of the states having much lower fractions of producers reporting a decrease over the same period (ranging from 13% in North Carolina to 0% in California).
3.2. Crops
Among the producers who harvested crops during their operation in 2021, the fraction of those who reported not planting or planting less of at least one crop due to possible damage from wild pigs is represented by the state in Figure 5 and Table A4. Overall, 13% of crop producers reported forgoing planting or planting less of their preferred crop because of wild pigs. This number jumps to 21% when restricted to crop producers with wild pigs in their county in the last three years and to 33% among crop producers reporting wild pig presence in their operation in 2021. The fraction is highest in Alabama, where 42% of such crop producers reported modifying their planting decisions because of wild pigs.
Table 1 summarizes, by state, the fraction of crop producers who lost profit from not growing their preferred crop(s) among those who modified their crop growing decision, and the aggregated profit lost. Seventy-five percent of these producers reported losing profit, for a total of USD 121.8 million over the surveyed region, with the highest amount lost incurred in Texas (USD 60.1 million).
Among crop producers who reported modifying their crop planting decision in 2021 because of possible damage from wild pigs, 53% selected corn as one of these crops, followed by sorghum (21%), peanut (20%), wheat (18%), soybeans (9%), and rice (2%). Nineteen percent selected another crop. Thirty-nine percent of crop producers reported not planting another crop in place of their preferred crop. Nineteen percent reverted to soybeans and 13% to wheat. Thirty-two percent chose another crop, which was overwhelmingly cotton (Figure 6).
The rest of this section is restricted to producers who planted at least one of the studied crops (i.e., corn, soybeans, wheat, rice, sorghum, and peanuts). Figure 7 displays the fraction of such producers, by state, reporting wild pig presence on any field, replanting because of wild pig damage, crop damage by wild pigs, and incurring additional costs at harvest because of wild pigs (Table A6). Across the survey region, about one third (32%) reported having wild pig presence on any field of the six crops, 9% replanted any of these crops because of damage caused by wild pigs, 23% reported crop damage by wild pigs during its growing season, and 15% incurred higher harvest costs because of wild pigs. Georgia reported the highest fractions for all these categories at 62%, 24%, 52%, and 39%, respectively.
Table 2 summarizes by state the additional time and expenses dedicated to replanting and harvesting because of wild pigs. Across the survey region, producers of the six crops spent an additional USD 17.5 million for replanting and USD 22.9 million for harvest because of wild pigs. Details of hours and expenses by crop and state are shown in Table A7, Table A8, Table A9 and Table A10 in Appendix C.
The results of the yield loss calculations for the six studied crops are presented in Table 3. Mean reported damage to corn was markedly higher in Georgia (4.79%) and Florida (3.34%) than in other states (next highest was Alabama with 2.13% damage), while reported soybean damage was substantially higher in Florida (5.93%) than in other states (next highest is Texas with 1.84%). Reported wheat damage was most severe in Georgia (2.85%), Louisiana (2.36%) and Texas (2.30%), and rice damage was most severe in Texas (8.40%). Reported sorghum damage was substantially higher in South Carolina (11.57%) than in other states (the next highest is Texas with 1.84%). Of all the state and crop combinations, the highest mean reported damage occurred in rice production in Texas (8.40%) and peanut production in Alabama (5.93%). Most of these findings are expected given what we know about wild pig behavior, distribution, and the geographic distribution of the production of these crops.
Estimates of production value lost to wild pigs, as calculated in Equation (5) in Anderson et al. [17] are presented in Table 4. For the selected crops and states that are reportable, an estimated USD 203.1 million in crop production was lost to wild pig damage in 2012. A comparison across crops shows that corn has the highest value of reported crop losses (USD 92.2 million), followed by peanuts (USD 38.5 million). However, given the total value of production in the 11 states of the different crops, peanut production suffers much larger monetary losses as a percentage of total production value. The results also indicate that Texas suffers substantially larger monetary losses than other states (USD 82.3 million; the next highest loss occurs in Georgia with USD 37.5 million). Figure 8 displays the distribution of the mean crop damage ratio across counties with wild pig presence. The average across mean ratios for the six studied crop damage across counties with wild pig presence is highest for sorghum, at 6.40%, followed by corn (4.00%), peanuts (2.80%), wheat (2.20%), soybeans (1.30%), and rice (1.30%).
3.3. Property
Among producers reporting wild pig presence on their property in the previous year, the fraction of responses (i.e., “Yes”, “Don’t Know”, or “No”) is shown in Table A8. Across the survey region, 60% of these respondents reported damage to fields and 37% to fences. The costliest items to repair in dollars were vehicles (USD 7110) and irrigation systems (164 h) in terms of time spent repairing. The total cost to repair the property was calculated for each state and is reported in Table 5. A total of USD 103 million USD was spent repairing property items across the survey region, with Texas incurring the highest cost (USD 51.4 million), followed by Arkansas at USD 10.1 million.
3.4. Control
Figure 9 and Table A12 display the fraction of producers with wild pigs on their property in the previous year reporting obtaining help from organizations, groups, other persons, or themselves to assist with reducing or preventing damage from wild pigs. Across the survey region, control is mainly carried out by hunters (57.3%) and the producer or someone living on the property (53.9%), and there appears to be a large variation by state. In Missouri, federal, state, or county agencies accomplished most of the control work (43.2%) while 40% reported no control on their property. Mississippi (7.8%) and Texas (7.6%) reported the highest fraction of intervention by a private company. North Carolina has the highest fraction of producers with wild pigs on their property reporting no control (45.2%).
The number of hours, expenses paid, and total cost for control by the state are displayed in Table 6. Across the survey region, control costs summed up to USD 207.5 million in 2021. The highest amount was incurred by Texas, at USD 72.2 million, followed by Georgia at USD 53.9 million.
4. Discussion
4.1. Population
Most statewide population estimates for wild pigs in 2019–2021 for the 11 states surveyed either increased or remained relatively stable (Table 7). Missouri, the only state with a decrease in the estimated population, also had the lowest percentages of producers reporting the pig presence in their county and on their operation. Further, California and North Carolina, which had the next lowest percentages of the producer-reported presence of wild pigs, had only stable numbers of wild pigs. Although the wild pig populations in Florida and Texas were reported to be stable during this time period, the populations of this invasive animal in those states are found both in high numbers and in most of the state (i.e., Florida—67 of 67 counties; Texas—253 of 254 counties) [24]. The remaining states that had increasing numbers of wild pigs (i.e., Alabama, Georgia, Louisiana, Mississippi, and South Carolina), as well as statewide high densities of wild pigs (>10 pigs/mi2, based on the population estimate and the area of the state), also had high percentages of producers reporting the presence of wild pigs in their county and on their operation.
Salassi et al. [25] found similar results to this study, reporting that in 2020, 47.5% of the survey respondents in Louisiana indicated that wild pigs were currently present on their land, and 51.3% reported that wild pig numbers had increased on their property over the past five years (Table 1—Section 3.2).
Among the 11 states included in the present study, Missouri is unique in establishing the Missouri Feral Hog Elimination Partnership. That enterprise is comprised of over 15 federal and state agencies, and agricultural and conservation NGOs all collaborating under the common goal of eliminating wild pigs from public and private lands throughout Missouri [26]. Given the recent reduction in the wild pig population in Missouri, this collaborative effort appears to be very successful.
4.2. Crop Damage
This study is related to a series of surveys designed to collect data regarding wild pig damage to these crops over time and covering the same region of impact [17]. Comparing these results to the Anderson et al. [17] survey suggests that Texas consistently and unsurprisingly remains the state most impacted by wild pigs. Georgia, however, has seen significant increases in losses to the surveyed crops from 2016–2022. Most of the increase in loss amounts for Georgia results from impacts to corn and peanuts reported in the state. The ranking of the next four states is relatively consistent between the two surveys providing support to the importance of documenting these impacts over time. Conducting these types of surveys over time allows for limited comparisons across time as Anderson et al. [17] did not report standard errors.
Directly comparing these results to those reported in other similar studies is difficult and limited. For example, Tanger et al. [27] reported that re-planting and re-discing comprised 41% of the total non-production losses to wild pig crop damage in Louisiana in 2013. While a direct comparison is impossible, our study found that excluding control costs, across all survey respondents, replanting costs comprise 4–5% of the total non-production costs associated with wild pig presence in this study. Similarly, in Louisiana, one study reported an overall agricultural commodity loss of over USD 66 million due to wild pigs while this study estimated total losses to Louisiana for only 6 crops of almost USD 17 million.
The impact of this damage has implications beyond the producer. Many of these crops are refined in the supply chain into other products (e.g., corn syrup, biofuel, rice milk) that add value to the economy during production. Reduced supply translates to reduced value added in the supply chain and less income for those industries linked to the production of these products [28]. While calculations of those impacts were outside the scope of this study, omission of these losses necessarily means that the estimates provided in this analysis are conservative.
4.3. Property
Wild pigs can cause a variety of types of property damage, most of which results from the foraging done by these animals [5]. In addition to directly damaging agricultural crops, pigs can damage infrastructure such as fences, irrigation ditches, roads, dikes, and other structures [29]. Wild pigs damage fencing by creating holes or crossings through these barriers. Which can result in the tearing of the fence netting or mesh, deforming the wire, and weakening both wires and posts within the fence structure [5]. This damage can allow livestock to escape, provide a potential access point for predators, and can result in costly repairs [30]. The economic impact of this damage has the potential to be significant in terms of fence repair costs and escaped livestock [31]. For example, in 2013, annual wild pig damage to farm fencing in Louisiana was estimated to cost USD 239,899 [27], which increased to USD 503,130 in 2020 [25]. Rooting and wallowing in agricultural fields creates holes that, if unnoticed, can damage farming equipment and pose potential hazards to equipment operators [30,32]. Tanger et al. [27] also reported that damage to farm equipment due to wild pigs in 2013 in Louisiana was USD 643,981 [Table 2, Section 3.2]. Rodriguez [33] estimated the annual statewide monetary loss of farm equipment and vehicles due to wild pig damage in South Carolina to be USD 24,812,067. In Louisiana, Tanger et al. [27] reported that 2% and 3% of the survey respondents reported wild pig damage to fences and farm equipment, respectively [Table 2, Section 3.2]; these percentages increased to 6.9% and 3.8% in 2020, respectively [25]. In the present study, vehicles, tractors, and farm equipment had the most expensive mean cost (i.e., USD 7110) of the various property items that were reported to sustain wild pig damage.
4.4. Control
Most wild pig control activities that are carried out on private lands are implemented by the property owner [25,33]. For example, in 2020, respondents in Louisiana reported that 3% used a contracted company and 6.2% used USDA Wildlife Services to control the wild pig numbers on their lands, the rest being done by the landowner [25]. In South Carolina, only 6.5% of the respondents in 2015 reported that they had sought professional help with wild pig control on their property [33]. Of those surveyed in Louisiana, only 11% viewed the use of wildlife service professionals for the control of populations as the best measure [25]. However, given the widespread nature of wild pig populations, Tian et al. [16] stated that they did not believe that control/management efforts made by individual landowners would be effective.
Most respondents indicated that they utilized more than one control measure [25,33]. In Louisiana, trapping and hunting/shooting were the most used measures of control, with 70.3% of respondents indicating they utilized trapping and 92.2% indicating they utilized hunting to control wild pigs [25]. In South Carolina, respondents reported that the most effective control measure for reducing the number of wild pigs was hunting with dogs, while the most effective exclusion method was electric fencing [33].
Controlling an invasive species like wild pigs can require substantial funding [16]. The results of the present study indicate that the cost of control in these 11 states is in the hundreds of millions of USD. In contrast, Rodriguez [33] reported that 69.7% of the respondents in South Carolina indicated that they had not incurred costs related to wild pig control/management on their property in the previous 12 months. Further, Saunders and Bryant [34] found that the effort required to reduce wild pig populations increased as the population neared zero.
In Europe, studies have shown that hunting was found to significantly reduce wild boar crop damage (e.g., [35,36]). However, wild pig hunting in the US is not practiced by large, organized, and repeated drive hunts or battues as it is in Europe. The smaller scale and often individual hunts for wild pigs in the US are not an effective control option for this species, often removing less than 23% of a wild pig population on an annual basis [37].
4.5. Limitations
There are limitations to the survey and its analysis. First, producers may not have accurate perceptions of damage, and their estimates of control costs could be biased. Such biases may be intentional or unintentional. Additionally, there may be a response bias in that responding producers may have been more likely to incur damage than non-respondents. While there are limitations associated with surveys, the use of consistent, widespread, repetitive surveys that occur on regular time intervals provides a unique and scientifically acceptable method to gather unique and highly valuable data that can be utilized to describe the pervasive economic impact of wild pigs [20]. Additionally, there are questions outside the scope of this analysis that contribute to the conservative nature of this study including assessing the costs of other control methods such as fencing. Producers can spend a considerable amount of money on electric and non-electric fencing in an attempt to exclude wild pigs from their crops. Control costs assessed in this study also do not include costs covered by various state and federal agencies and those costs may also be substantial. While these costs are not born directly by crop producers, they should be accounted for when estimating the social costs incurred because of wild pigs.
5. Conclusions
Our findings suggest that for the states included in this study, the burden inflicted by wild pigs on producers of the six studied crops is substantial and not limited to the direct and most identifiable category of crop damage. Overall annual damage (USD 678.8 million) can be expressed as the summation of crop damage (USD 203.1 million), opportunity costs—which are the forgone benefit that would have been derived from an option other than the one that was chosen—(USD 121.8 million), replanting costs (USD 17.5 million), additional costs at harvest (USD 25.9 million), property damage (USD 103 million), and control (USD 207.5 million). Examining control costs in relation to all other costs indicates that producers of these crops are expending over USD 200 million annually in an attempt to control wild pigs and reduce their impact. Even with this level of expenditure, however, producers are still suffering over USD 470 million in losses. Excluding control-related costs from the overall equation reveals that the second-largest impact to direct crop loss, producers identify significant impacts of wild pigs on other opportunities that they might have to produce. These opportunity costs are real costs to producers as they substitute away from growing their preferred crop to produce a crop that is less profitable but less susceptible to wild pig damage. Property damage is the third largest category after crop loss and opportunity costs when control costs are excluded. Property loss is the corresponding costs associated with wild pig damage to crops in that if pigs are damaging a crop, they are likely also damaging property to get to that crop in the case of fence damage, or damaging property in the process of damaging the crop, like rooting and wallowing. Rooting and wallowing can cause related damage to machinery and vehicles as well as degrade the quality of the agricultural commodity. Results of this study suggest that property damage is over half of crop losses, creating a persistent and expensive burden to producers.
This study builds on the growing body of literature related to wild pig damage to agricultural commodities, property, opportunity costs, replanting, harvest, and control costs. Importantly and unlike many studies that are simply a one-time study, this study is a consistent and repetitive expansion of an earlier study conducted on the same crops, in the same region of study, with many of the same questions. Although the study is based on responses provided by a random sample of producers, this type of recurring survey can provide information related to the evolution of wild pig presence in the region potentially making results temporally comparable. This may permit the assessment of the long-term impacts of management through comparisons related to the contraction or expansion of wild pig populations.
Author Contributions
Formal analysis, S.C.M.; writing—original draft preparation, S.C.M. and J.J.M.; writing—review and editing, S.A.S.; supervision, S.C.M. funding acquisition, S.A.S. All authors have read and agreed to the published version of the manuscript.
Funding
This research was supported by the U.S. Department of Agriculture, Animal and Plant Health Inspection Service and the National Feral Swine Program. Support for J.J.M. was provided by the U.S. Department of Energy to Battelle Savannah River Alliance under contract 89303321CEM000080.
Institutional Review Board Statement
This study was conducted in accordance with the Declaration of Helsinki. The research activity has been reviewed and determined to meet exempt review by the Institutional Review Board of Colorado State University under exempt §46.104(d)(2)(i), (2)(ii) of the 2018 Requirements (protocol code 3392 and date of approval 6 May 2022).
Data Availability Statement
Due to the NASS Confidentiality Pledge (https://www.nass.usda.gov/About_NASS/Confidentiality_Pledge/index.php, accessed on 2 September 2023), the data underlying this article cannot be shared publicly. Secure access to NASS data may be obtained by agreement and sworn status only; restrictions apply.
Conflicts of Interest
The authors declare no conflicts of interest.
Appendix A. Survey Sampling Methodology
The 2022 Feral Swine Sampling Frame—comprised all active operations in Alabama, Arkansas, California, Florida, Georgia, Louisiana, Mississippi, Missouri, North Carolina, South Carolina, and Texas on NASS’s List Frame that have positive control data for the following targeted crops:
a. Corn (cT320).
b. Soybeans (cT372).
c. Wheat (cT076).
d. Rice (cT365).
e. Peanuts (cT354).
f. Sorghum (cT342).
The sampling frame was grouped into low, medium and high feral swine density counties (the feral swine density by county data was obtained from APHIS-Wildlife Services) before a sample was selected using a Multivariate Probability Proportionate to Size (MPPS) sample design.
For a MPPS design, the probability of selection is:
where:
πi is the maximum probability of selection for farm operator i.
i is the farm operator;
h is the target commodity;
x is the value of target commodity h;
r is the power.
The target sample size for each state-strata targeted commodity is
where:
n is the sample size for target commodity h;
Nh is the target commodity population;
sh is the target commodity standard deviation;
fh is the target commodity coefficient of variation;
Th is the target commodity total.
A target commodity coefficient of variation of 30%, 40% and 60% for low, medium and high feral swine density strata was used to derive target sample sizes and a power of 0.75 was used to derive the maximum probability of selection. A sample is chosen by generating a uniform random number (RN), calculating the cumulative probability for unit i as Cumulativei = Cumulativei + 1 + πi, and selecting unit i if Cumulativei + 1 < RN + k < = Cumulativei for any k = 0, 1, 2,…n where n is the total number of units selected for the sample.
Appendix B
Figure A1.
Questions pertaining to wild pig populations.

Figure A2.
Questions pertaining to opportunity costs.

Figure A3.
Questions pertaining to the six study crops.

Figure A4.
Questions pertaining to property damage and the associated hours and money spent on repair.
Figure A4.
Questions pertaining to property damage and the associated hours and money spent on repair.

Figure A5.
Questions pertaining to control methods.

Appendix C

Table A1.
Pig presence in county and in operation by state over the last three years. Standard errors in parentheses.
Table A1.
Pig presence in county and in operation by state over the last three years. Standard errors in parentheses.
| State | In County | On Operation | ||||
|---|---|---|---|---|---|---|
| Yes | Don’t Know | No | Yes | Don’t Know | No | |
| Alabama | 0.633 | 0.108 | 0.259 | 0.384 | 0.007 | 0.609 |
| (0.053) | (0.026) | (0.054) | (0.043) | (0.003) | (0.044) | |
| Arkansas | 0.485 | 0.134 | 0.381 | 0.326 | 0.027 | 0.646 |
| (0.044) | (0.038) | (0.049) | (0.038) | (0.012) | (0.039) | |
| California | 0.335 | 0.124 | 0.541 | 0.102 | 0.026 | 0.873 |
| (0.033) | (0.018) | (0.034) | (0.015) | (0.009) | (0.018) | |
| Florida | 0.867 | 0.057 | 0.076 | 0.601 | 0.038 | 0.361 |
| (0.031) | (0.021) | (0.023) | (0.067) | (0.017) | (0.069) | |
| Georgia | 0.798 | 0.096 | 0.106 | 0.630 | 0.042 | 0.328 |
| (0.049) | (0.044) | (0.033) | (0.046) | (0.025) | (0.046) | |
| Louisiana | 0.835 | (D) | 0.137 | 0.651 | (D) | 0.341 |
| (0.042) | - | (0.039) | (0.059) | - | (0.058) | |
| Mississippi | 0.649 | 0.159 | 0.192 | 0.380 | (D) | 0.567 |
| (0.070) | (0.076) | (0.046) | (0.049) | - | (0.057) | |
| Missouri | 0.155 | 0.126 | 0.720 | 0.034 | 0.081 | 0.884 |
| (0.069) | (0.054) | (0.082) | (0.007) | (0.069) | (0.069) | |
| North Carolina | 0.319 | 0.144 | 0.537 | 0.073 | 0.018 | 0.909 |
| (0.037) | (0.034) | (0.042) | (0.015) | (0.007) | (0.016) | |
| South Carolina | 0.828 | 0.065 | 0.106 | 0.534 | 0.015 | 0.450 |
| (0.025) | (0.017) | (0.020) | (0.041) | (0.006) | (0.041) | |
| Texas | 0.836 | 0.040 | 0.124 | 0.731 | 0.004 | 0.265 |
| (0.021) | (0.012) | (0.018) | (0.028) | (0.002) | (0.028) | |
| Total | 0.566 | 0.098 | 0.336 | 0.387 | 0.029 | 0.584 |
| (0.018) | (0.013) | (0.019) | (0.014) | (0.012) | (0.017) | |
Table A2.
Pig population change in county by state (among producers who reported pig presence in county in the last 3 years). Standard errors in parentheses.
Table A2.
Pig population change in county by state (among producers who reported pig presence in county in the last 3 years). Standard errors in parentheses.
| State | Subst. Increased | Somewhat. Increased | No Real Change | Somewhat. Decreased | Subst. Decreased | Eliminated Completely | Don’t Know |
|---|---|---|---|---|---|---|---|
| Alabama | 0.478 | 0.169 | 0.184 | 0.039 | 0.015 | 0.000 | 0.115 |
| (0.064) | (0.034) | (0.054) | (0.011) | (0.006) | 0.000 | (0.039) | |
| Arkansas | 0.305 | 0.285 | 0.215 | 0.051 | (D) | 0.000 | 0.142 |
| (0.049) | (0.071) | (0.070) | (0.025) | - | 0.000 | (0.032) | |
| California | 0.127 | 0.131 | 0.259 | 0.034 | (D) | 0.000 | 0.434 |
| (0.033) | (0.032) | (0.060) | (0.015) | - | 0.000 | (0.067) | |
| Florida | 0.308 | 0.170 | 0.230 | 0.048 | 0.041 | 0.000 | 0.204 |
| 0.049 | 0.043 | 0.058 | 0.017 | 0.017 | 0.000 | (0.086) | |
| Georgia | 0.530 | 0.264 | 0.115 | 0.022 | (D) | (D) | 0.050 |
| (0.037) | (0.033) | (0.018) | (0.007) | - | - | (0.023) | |
| Louisiana | 0.547 | 0.283 | 0.087 | (D) | (D) | 0.000 | 0.048 |
| (0.071) | (0.055) | (0.045) | - | - | 0.000 | (0.016) | |
| Mississippi | 0.490 | 0.229 | 0.117 | 0.025 | 0.027 | (D) | 0.109 |
| (0.056) | (0.038) | (0.022) | (0.008) | (0.010) | - | (0.029) | |
| Missouri | (D) | 0.327 | 0.136 | 0.121 | 0.107 | (D) | 0.263 |
| - | (0.081) | (0.036) | (0.037) | (0.035) | - | (0.064) | |
| N. Carolina | 0.095 | 0.245 | 0.196 | (D) | 0.016 | (D) | 0.419 |
| (0.025) | (0.049) | (0.046) | - | (0.006) | - | (0.080) | |
| S. Carolina | 0.309 | 0.251 | 0.178 | 0.062 | (D) | 0.000 | 0.184 |
| (0.038) | (0.036) | (0.042) | (0.042) | - | 0.000 | (0.037) | |
| Texas | 0.425 | 0.272 | 0.186 | 0.023 | 0.013 | 0.000 | 0.188 |
| (0.037) | (0.034) | (0.030) | (0.007) | (0.008) | 0.000 | (0.019) | |
| Total | 0.331 | 0.248 | 0.178 | 0.034 | 0.020 | 0.002 | 0.000 |
| (0.017) | (0.016) | (0.015) | (0.005) | (0.004) | (0.001) | (0.021) |
Table A3.
Pig population change on operation by state (among producers who reported pig presence on operation in the last 3 years). Standard errors in parentheses.
Table A3.
Pig population change on operation by state (among producers who reported pig presence on operation in the last 3 years). Standard errors in parentheses.
| State | Subst. Increased | Somewhat. Increased | No Real Change | Somewhat. Decreased | Subst. Decreased | Eliminated Completely | Don’t Know |
|---|---|---|---|---|---|---|---|
| Alabama | 0.536 | 0.315 | 0.055 | 0.053 | (D) | 0.000 | (D) |
| (0.059) | (0.063) | (0.015) | (0.015) | - | 0.000 | - | |
| Arkansas | 0.299 | 0.298 | 0.272 | 0.037 | 0.087 | 0.000 | (D) |
| (0.052) | (0.073) | (0.073) | (0.014) | (0.046) | 0.000 | - | |
| California | 0.265 | 0.131 | 0.482 | 0.000 | (D) | 0.000 | (D) |
| (0.080) | (0.054) | (0.097) | 0.000 | - | 0.000 | - | |
| Florida | 0.413 | 0.188 | 0.293 | 0.046 | 0.044 | 0.000 | (D) |
| 0.057 | 0.055 | 0.070 | 0.016 | 0.018 | 0.000 | - | |
| Georgia | 0.580 | 0.199 | 0.154 | 0.034 | 0.014 | (D) | 0.019 |
| (0.037) | (0.028) | (0.027) | (0.011) | (0.007) | - | (0.007) | |
| Louisiana | 0.569 | 0.296 | 0.062 | 0.047 | (D) | 0.000 | (D) |
| (0.077) | (0.066) | (0.025) | (0.022) | - | 0.000 | - | |
| Mississippi | 0.411 | 0.291 | 0.157 | 0.088 | 0.029 | (D) | (D) |
| (0.045) | (0.044) | (0.032) | (0.030) | (0.011) | - | - | |
| Missouri | (D) | 0.145 | 0.108 | 0.287 | 0.255 | (D) | (D) |
| - | (0.064) | (0.044) | (0.092) | (0.095) | - | - | |
| N. Carolina | 0.171 | 0.245 | 0.316 | 0.072 | 0.059 | (D) | (D) |
| (0.058) | (0.059) | (0.073) | (0.040) | (0.027) | - | - | |
| S. Carolina | 0.337 | 0.297 | 0.222 | 0.022 | (D) | (D) | (D) |
| (0.048) | (0.050) | (0.056) | (0.008) | - | - | - | |
| Texas | 0.388 | 0.358 | 0.185 | 0.040 | 0.006 | 0.000 | 0.039 |
| (0.039) | (0.041) | (0.032) | (0.012) | (0.003) | 0.000 | (0.012) | |
| Total | 0.358 | 0.275 | 0.218 | 0.056 | 0.045 | 0.009 | 0.000 |
| (0.019) | (0.019) | (0.019) | (0.009) | (0.009) | (0.003) | (0.015) |
Table A4.
Fraction of crop producers reporting not planting a crop, or planting less of a crop, due to possible damage from wild pigs in 2021. Standard errors in parentheses.
Table A4.
Fraction of crop producers reporting not planting a crop, or planting less of a crop, due to possible damage from wild pigs in 2021. Standard errors in parentheses.
| State | All | Wild Pigs in County in Last 3 Years | Wild Pigs on Operation in Last 3 Years | Wild Pigs on Operation in Previous Year |
|---|---|---|---|---|
| Alabama | 0.196 | 0.295 | 0.399 | 0.418 |
| (0.029) | (0.042) | (0.045) | (0.050) | |
| Arkansas | 0.092 | 0.192 | 0.284 | 0.348 |
| (0.008) | (0.046) | (0.064) | (0.075) | |
| California | 0.020 | 0.053 | 0.183 | 0.187 |
| (0.008) | (0.025) | (0.080) | (0.082) | |
| Florida | 0.189 | 0.211 | 0.335 | 0.338 |
| (0.041) | (0.047) | (0.056) | (0.056) | |
| Georgia | 0.245 | 0.289 | 0.344 | 0.353 |
| (0.030) | (0.032) | (0.037) | (0.040) | |
| Louisiana | 0.142 | 0.169 | 0.216 | 0.220 |
| (0.040) | (0.048) | (0.063) | (0.076) | |
| Mississippi | 0.121 | 0.189 | 0.319 | 0.339 |
| (0.024) | (0.034) | (0.046) | (0.053) | |
| Missouri | 0.005 | (D) | 0.114 | (D) |
| (0.002) | - | (0.058) | - | |
| North Carolina | 0.015 | 0.032 | 0.132 | 0.183 |
| (0.004) | (0.010) | (0.042) | (0.063) | |
| South Carolina | 0.198 | 0.233 | 0.316 | 0.381 |
| (0.032) | (0.039) | (0.057) | (0.063) | |
| Texas | 0.246 | 0.282 | 0.328 | 0.347 |
| (0.030) | (0.035) | (0.039) | (0.039) | |
| Total | 0.126 | 0.213 | 0.308 | 0.332 |
| (0.009) | (0.015) | (0.020) | (0.021) |
Table A5.
Crop that was not planted or less planted. Standard errors in parentheses.
| Crop | Not Planted or Planted Less of | Replacement |
|---|---|---|
| Corn | 0.533 | 0.076 |
| (0.041) | (0.016) | |
| Soybeans | 0.087 | 0.189 |
| (0.017) | (0.029) | |
| Wheat | 0.181 | 0.132 |
| (0.042) | (0.028) | |
| Rice | 0.019 | 0.010 |
| (0.006) | (0.005) | |
| Sorghum | 0.212 | 0.076 |
| (0.032) | (0.027) | |
| Peanuts | 0.196 | 0.018 |
| (0.024) | (0.004) | |
| Other | 0.193 | 0.318 |
| (0.045) | (0.035) | |
| No other | 0.385 | |
| (0.041) |
Table A6.
Fraction of producers of the studied crops responding “yes” to the following questions. Standard errors in parentheses.
Table A6.
Fraction of producers of the studied crops responding “yes” to the following questions. Standard errors in parentheses.
| State | Were Wild Pigs Present on Any Field of This Crop? | Did You Replant Any of This Crop Because of Damage Caused by Wild Pigs? | Was This Crop Damaged by Wild Pigs during Its Growing Season? | Did the Presence of Wild Pigs Make This Crop More Costly to Harvest? |
|---|---|---|---|---|
| Alabama | 0.383 | 0.152 | 0.319 | 0.214 |
| (0.044) | (0.024) | (0.039) | (0.029) | |
| Arkansas | 0.234 | 0.058 | 0.141 | 0.087 |
| (0.038) | (0.013) | (0.024) | (0.018) | |
| California | 0.038 | (D) | 0.024 | (D) |
| (0.014) | - | (0.012) | - | |
| Florida | 0.501 | 0.195 | 0.376 | 0.308 |
| (0.068) | (0.040) | (0.059) | (0.052) | |
| Georgia | 0.624 | 0.239 | 0.520 | 0.386 |
| (0.057) | (0.033) | (0.053) | (0.048) | |
| Louisiana | 0.551 | 0.170 | 0.249 | 0.212 |
| (0.070) | (0.036) | (0.046) | (0.050) | |
| Mississippi | 0.386 | 0.182 | 0.280 | 0.169 |
| (0.036) | (0.027) | (0.031) | (0.027) | |
| Missouri | 0.014 | (D) | 0.010 | 0.007 |
| (0.005) | - | (0.004) | (0.003) | |
| North Carolina | 0.052 | 0.020 | 0.036 | 0.019 |
| (0.014) | (0.010) | (0.009) | (0.005) | |
| South Carolina | 0.448 | 0.116 | 0.333 | 0.263 |
| (0.050) | (0.023) | (0.045) | (0.040) | |
| Texas | 0.599 | 0.095 | 0.454 | 0.254 |
| (0.042) | (0.013) | (0.042) | (0.035) | |
| Total | 0.317 | 0.086 | 0.230 | 0.150 |
| (0.016) | (0.006) | (0.013) | (0.010) |
Table A7.
Additional hours spent replanting because of wild pigs in 2021, by state. Standard errors in parentheses.
Table A7.
Additional hours spent replanting because of wild pigs in 2021, by state. Standard errors in parentheses.
| State | Corn | Soybeans | Wheat | Rice | Sorghum | Peanuts |
|---|---|---|---|---|---|---|
| Alabama | 1149 | 433 | 129 | - | - | 6434 |
| (489) | (303) | (127) | - | - | (3684) | |
| Arkansas | 1182 | 599 | - | 449 | - | - |
| (424) | (344) | - | (441) | - | - | |
| California | 122 | - | - | - | - | - |
| (120) | - | - | - | - | - | |
| Florida | 126 | 4 | 141 | - | - | 1436 |
| (87) | (4) | (141) | - | - | (356) | |
| Georgia | 8268 | 828 | 257 | - | - | 11,409 |
| (2572) | (347) | (203) | - | - | (4057) | |
| Louisiana | 2159 | 2065 | 262 | 111 | 356 | - |
| (497) | (552) | (261) | (110) | (304) | - | |
| Mississippi | 5992 | 10,389 | - | - | - | 64 |
| (1971) | (5383) | - | - | - | (64) | |
| Missouri | - | 276 | - | - | - | - |
| - | (268) | - | - | - | - | |
| North Carolina | 200 | 72 | - | - | - | 111 |
| (91) | (39) | - | - | - | (87) | |
| South Carolina | 1743 | 616 | 53 | (D) | - | 262 |
| (450) | (234) | (52) | - | - | (144) | |
| Texas | 16,526 | 174 | 8670 | 1058 | 1083 | 665 |
| (7499) | (134) | (4642) | (891) | (594) | (338) |
Table A8.
Additional expenses (in USD) spent replanting because of wild pigs in 2021, by state. Standard errors in parentheses.
Table A8.
Additional expenses (in USD) spent replanting because of wild pigs in 2021, by state. Standard errors in parentheses.
| State | Corn | Soybeans | Wheat | Rice | Sorghum | Peanuts |
|---|---|---|---|---|---|---|
| Alabama | 223,215 | 168,299 | 6428 | - | - | 544,056 |
| (89,615) | (108,676) | (6368) | - | - | (191,856) | |
| Arkansas | 693,882 | 180,053 | - | 168,490 | - | - |
| (268,428) | (102,889) | - | (165,222) | - | - | |
| California | 48,611 | - | - | - | - | - |
| (47,939) | - | - | - | - | - | |
| Florida | 30,518 | 183 | 17,655 | - | - | 432,812 |
| (21,394) | (181) | (17,602) | - | - | (117,976) | |
| Georgia | 1,695,480 | 58,700 | 21,530 | - | - | 4,033,674 |
| (595,995) | (47,154) | (19,625) | - | - | (1,309,735) | |
| Louisiana | 1,342,538 | 441,279 | 17,444 | 553 | 31,077 | - |
| (376,898) | (137,172) | (17,409) | (551) | (30,997) | - | |
| Mississippi | 1,234,573 | 1,055,551 | - | - | - | 530 |
| (357,998) | (366,009) | - | - | - | (529) | |
| Missouri | - | 55,230 | - | - | - | - |
| - | (53,558) | - | - | - | - | |
| N. Carolina | 25,855 | 25,467 | - | - | - | 3066 |
| (14,480) | (12,492) | - | - | - | (2650) | |
| S. Carolina | 361,648 | 68,495 | 5269 | (D) | - | 74,113 |
| (100,106) | (28,815) | (5174) | - | - | (39,919) | |
| Texas | 1,745,965 | 8400 | 712,813 | 330,964 | 76,416 | 95,402 |
| (425,609) | (5038) | (319,868) | (239,833) | (45,022) | (50,329) |
Table A9.
Additional hours spent harvesting because of wild pigs in 2021, by state. Standard errors in parentheses.
Table A9.
Additional hours spent harvesting because of wild pigs in 2021, by state. Standard errors in parentheses.
| State | Corn | Soybeans | Wheat | Rice | Sorghum | Peanuts |
|---|---|---|---|---|---|---|
| Alabama | 1789 | 1096 | 211 | - | 17 | |
| (568) | (891) | (96) | - | (17) | (22,798) | |
| Arkansas | 735 | 983 | 1287 | 1311 | 85 | - |
| (231) | (460) | (876) | (629) | (67) | - | |
| California | - | - | 286 | - | - | - |
| - | - | (259) | - | - | - | |
| Florida | 1410 | 254 | 141 | - | - | 1316 |
| (626) | (172) | (141) | - | - | (319) | |
| Georgia | 15,266 | 1144 | 1563 | (D) | 83 | 20,168 |
| (4535) | (543) | (469) | - | (72) | (8341) | |
| Louisiana | 2115 | 1752 | 427 | 1918 | 83 | - |
| (730) | (944) | (418) | (1426) | (83) | - | |
| Mississippi | 3476 | 1947 | 809 | 430 | 19 | - |
| (1793) | (745) | (761) | (353) | (19) | - | |
| Missouri | 565 | 402 | - | - | - | - |
| (546) | (349) | - | - | - | - | |
| N. Carolina | 1136 | 773 | 307 | - | - | 100 |
| (782) | (512) | (242) | - | - | (70) | |
| S. Carolina | 3796 | 1122 | 723 | (D) | 222 | 446 |
| (854) | (362) | (385) | - | (125) | (139) | |
| Texas | 23,492 | 308 | 18,306 | 3397 | 5699 | 31,510 |
| (8723) | (160) | (10,922) | (1773) | (2631) | (31,283) |
Table A10.
Additional expenses (in USD) spent harvesting because of wild pigs in 2021, by state. Standard errors in parentheses.
Table A10.
Additional expenses (in USD) spent harvesting because of wild pigs in 2021, by state. Standard errors in parentheses.
| State | Corn | Soybeans | Wheat | Rice | Sorghum | Peanuts |
|---|---|---|---|---|---|---|
| Alabama | 253,106 | 89,881 | 29,677 | - | - | 188,820 |
| (99,209) | (61,057) | (16,122) | - | - | (56,989) | |
| Arkansas | 272,848 | 248,919 | 41,562 | 404,155 | 6702 | - |
| (97,465) | (123,235) | (36,521) | (226,528) | (6685) | - | |
| California | - | - | 48,374 | - | - | - |
| - | - | (47,796) | - | - | - | |
| Florida | 262,238 | 113,425 | 17,655 | - | - | 1,035,366 |
| (119,485) | (64,697) | (17,602) | - | - | (786,959) | |
| Georgia | 4,393,213 | 160,737 | 183,678 | (D) | 4478 | 1,920,292 |
| (1,917,008) | (80,782) | (59,118) | - | (4,465) | (523,762) | |
| Louisiana | 898,904 | 600,493 | 26,305 | 372,900 | 139 | - |
| (377,137) | (347,071) | (26,114) | (345,565) | (138) | - | |
| Mississippi | 861,713 | 719,834 | 10,158 | 54,718 | 11,676 | 26,517 |
| (376,410) | (282,221) | (7192) | (39,030) | (11,657) | (26,471) | |
| Missouri | 84,408 | 70,986 | - | - | - | - |
| (81,900) | (54,767) | - | - | - | - | |
| N. Carolina | 2,304,342 | 54,726 | 12,969 | - | - | 8104 |
| (2,163,558) | (30,286) | (11,665) | - | - | (5881) | |
| S. Carolina | 462,042 | 307,405 | 134,502 | (D) | 31,141 | 83,585 |
| (139,988) | (147,454) | (77,989) | - | (21,514) | (28,734) | |
| Texas | 1,946,916 | 106,013 | 1,342,121 | 1,535,662 | 1,034,524 | 95,402 |
| (534,358) | (45,181) | (377,874) | (913,669) | (596,814) | (63,781) |
Table A11.
Damage to individual property items. Standard errors in parentheses. Columns 2–4 display the fraction of producers reporting wild pig presence in the previous year answering “Yes”, “Don’t Know”, or “No” for each property item. Columns 5 and 6 display, respectively, the average number of hours and cost spent (in USD) repairing these items among producers responding “Yes” to the corresponding property items.
| Yes | Don’t Know | No | Mean Hours | Mean Cost (S) | |
|---|---|---|---|---|---|
| Buildings | 0.026 | 0.032 | 0.942 | 29.8 | 2810 |
| (0.007) | (0.012) | (0.014) | (16.1) | (1658) | |
| Fencing | 0.373 | 0.023 | 0.604 | 149.8 | 2382 |
| (0.024) | (0.004) | (0.024) | (92.3) | (3) | |
| Field | 0.600 | 0.039 | 0.361 | 54.7 | 1362 |
| (0.024) | (0.012) | (0.024) | (18.8) | (149) | |
| Other Crop | 0.157 | 0.082 | 0.761 | 21.4 | 1526 |
| (0.015) | (0.017) | (0.021) | (6.9) | (388) | |
| Irrigation | 0.082 | 0.027 | 0.891 | 164.2 | 2277 |
| (0.012) | (0.005) | (0.013) | (111.7) | (624) | |
| Vehicle | 0.087 | 0.021 | 0.892 | 65.1 | 7110 |
| (0.016) | (0.004) | (0.016) | (43.1) | (3460) | |
| Residential | 0.056 | 0.020 | 0.924 | 11.1 | 511 |
| (0.012) | (0.006) | (0.013) | (6.9) | (245) | |
| Road | 0.162 | 0.019 | 0.819 | 10.8 | 738 |
| (0.015) | (0.003) | (0.016) | (1.3) | (94) | |
| Feed | 0.180 | 0.025 | 0.795 | 22.1 | 2320 |
| (0.019) | (0.011) | (0.021) | (7.8) | (466) | |
| Fecal | 0.138 | 0.172 | 0.691 | 3.6 | 320 |
| (0.018) | (0.016) | (0.022) | (1.5) | (147) | |
| Water source | 0.163 | 0.097 | 0.740 | 5.2 | 456 |
| (0.017) | (0.014) | (0.021) | (1.0) | (105) | |
| Terraces | 0.246 | 0.089 | 0.665 | 8.8 | 605 |
| (0.019) | (0.014) | (0.022) | (1.6) | (100) | |
| Wildlife Habitat | 0.160 | 0.140 | 0.700 | 8.9 | 2 |
| (0.015) | (0.017) | (0.021) | (2.7) | (14) | |
| Topsoil Erosion | 0.257 | 0.095 | 0.647 | 19.7 | 1573 |
| (0.020) | (0.016) | (0.023) | (5.6) | (553) | |
| Fecal Contam. Crops | 0.067 | 0.135 | 0.798 | 1.9 | 270 |
| (0.011) | (0.016) | (0.018) | (0.6) | (117) | |
| Other | 0.059 | 0.113 | 0.828 | 8.5 | 1027 |
| (0.011) | (0.017) | (0.019) | (3.276) | (401) |
Table A12.
Fraction of producers with wild pigs on their property in the previous year reporting obtaining help from organizations, groups, other persons, or themselves to assist with reducing or preventing damage from wild pigs. Standard errors in parentheses.
Table A12.
Fraction of producers with wild pigs on their property in the previous year reporting obtaining help from organizations, groups, other persons, or themselves to assist with reducing or preventing damage from wild pigs. Standard errors in parentheses.
| State | Federal, State, or County Agency | University Outreach Services | Private Company | Hunters (Not Including Yourself) | Yourself (or Someone Living on Your Property) | None |
|---|---|---|---|---|---|---|
| Alabama | 0.191 | 0.034 | 0.032 | 0.526 | 0.547 | 0.229 |
| (0.041) | (0.012) | (0.012) | (0.054) | (0.056) | (0.048) | |
| Arkansas | 0.332 | (D) | 0.000 | 0.475 | 0.531 | 0.276 |
| (0.071) | - | 0.000 | (0.068) | (0.066) | (0.058) | |
| California | (D) | 0.000 | (D) | 0.348 | 0.554 | 0.351 |
| - | 0.000 | - | (0.080) | (0.087) | (0.086) | |
| Florida | (D) | 0.000 | (D) | 0.425 | 0.491 | 0.347 |
| - | 0.000 | - | (0.063) | (0.068) | (0.073) | |
| Georgia | 0.065 | 0.012 | 0.016 | 0.666 | 0.545 | 0.224 |
| (0.017) | (0.006) | (0.005) | (0.050) | (0.051) | (0.051) | |
| Louisiana | 0.172 | (D) | 0.005 | 0.592 | 0.533 | 0.184 |
| (0.054) | - | (0.005) | (0.098) | (0.111) | (0.075) | |
| Mississippi | 0.137 | (D) | 0.078 | 0.507 | 0.573 | 0.296 |
| (0.034) | - | (0.025) | (0.055) | (0.054) | (0.051) | |
| Missouri | 0.432 | 0.000 | 0.000 | (D) | 0.301 | 0.400 |
| (0.130) | 0.000 | 0.000 | - | (0.111) | (0.129) | |
| North Carolina | (D) | 0.009 | (D) | 0.435 | 0.285 | 0.452 |
| - | (0.009) | - | (0.095) | (0.074) | (0.108) | |
| South Carolina | 0.083 | 0.022 | (D) | 0.674 | 0.610 | 0.157 |
| (0.019) | (0.008) | - | (0.067) | (0.064) | (0.044) | |
| Texas | 0.045 | 0.010 | 0.076 | 0.587 | 0.545 | 0.226 |
| (0.008) | (0.006) | (0.018) | (0.040) | (0.040) | (0.033) | |
| Total | 0.090 | 0.011 | 0.049 | 0.573 | 0.539 | 0.237 |
| (0.009) | (0.003) | (0.009) | (0.024) | (0.024) | (0.020) |
Table A13.
Number of hours spent in 2021 on property with wild pig presence to reduce or prevent damage by wild pigs, by state and method. Standard errors in parentheses.
Table A13.
Number of hours spent in 2021 on property with wild pig presence to reduce or prevent damage by wild pigs, by state and method. Standard errors in parentheses.
| State | Shouting on Sight | Hunting with Dogs | Hunting without Dogs | Aerial Hunting | Trapping | Other |
|---|---|---|---|---|---|---|
| Alabama | 66,742 | 13,885 | 86,392 | 5248 | 52,489 | - |
| (34,386) | (5265) | (56,385) | (4985) | (15,934) | - | |
| Arkansas | 34,583 | 32,959 | 33,151 | 27,960 | 34,332 | 23,441 |
| (11,658) | (20,636) | (17,095) | (19,399) | (16,661) | (22,928) | |
| California | 7304 | 3203 | 4492 | - | 1138 | - |
| (2855) | (3193) | (2293) | - | (780) | - | |
| Florida | 20,239 | 26,517 | 31,723 | 610 | 23,544 | 106,009 |
| (4252) | (9822) | (8844) | (578) | (6202) | (96,972) | |
| Georgia | 224,413 | 175,934 | 237,748 | 146,230 | 171,615 | 281,192 |
| (35,891) | (75,331) | (57,697) | (94,814) | (28,698) | (218,679) | |
| Louisiana | 47,346 | 11,487 | 32,728 | 1915 | 45,588 | - |
| (13,169) | (3523) | (8831) | (1121) | (13,977) | - | |
| Mississippi | 54,877 | 72,635 | 49,510 | 52,076 | 149,709 | 106,144 |
| (11,151) | (42,856) | (13,825) | (37,129) | (96,775) | (67,571) | |
| Missouri | 3617 | - | 3898 | - | 1390 | 61,922 |
| (1690) | - | (3772) | - | (990) | (61,327) | |
| N. Carolina | 5567 | 7525 | 3949 | - | 13,528 | - |
| (1,940) | (3471) | (1726) | - | (9843) | - | |
| S. Carolina | 79,775 | 24,997 | 74,929 | 11,934 | 45,587 | 19,384 |
| (27,439) | (6434) | (34,244) | (8918) | (15,085) | (11,641) | |
| Texas | 453,739 | 408,655 | 419,942 | 111,115 | 378,192 | 318,065 |
| (113,841) | (114,610) | (169,141) | (65,798) | (88,380) | (157,954) | |
| Total | 998,201 | 777,795 | 978,462 | 357,091 | 917,112 | 916,157 |
Table A14.
Amount (in USD) spent in 2021 on property with wild pig presence to reduce or prevent damage by wild pigs, by state and method. Standard errors in parentheses.
Table A14.
Amount (in USD) spent in 2021 on property with wild pig presence to reduce or prevent damage by wild pigs, by state and method. Standard errors in parentheses.
| State | Shouting on Sight | Hunting with Dogs | Hunting without Dogs | Aerial Hunting | Trapping | Other |
|---|---|---|---|---|---|---|
| Alabama | 948,054 | 81,194 | 538,545 | - | 1,890,758 | 155,014 |
| (215,652) | (81,194) | (150,587) | - | (500,216) | (143,494) | |
| Arkansas | 827,460 | 288,800 | - | 676,338 | - | 140,643 |
| (244,125) | - | (398,018) | - | (849,625) | - | |
| California | 109,545 | 191,604 | 68,266 | - | 52,557 | 411,208 |
| (44,432) | (191,604) | (32,354) | - | (51,727) | (404,710) | |
| Florida | 13,720,137 | 189,976 | 898,313 | 30,707 | 1,032,904 | 4,652,323 |
| (12,172,498) | (189,976) | (279,506) | (28,904) | (365,766) | (2,952,480) | |
| Georgia | 6,062,422 | 589,747 | 4,437,536 | 6,523,258 | 7,285,686 | 8,939,669 |
| (846,720) | (589,747) | (799,537) | (3,514,666) | (1,735,686) | (1,686,530) | |
| Louisiana | 787,970 | 186,059 | 430,354 | 105,615 | 963,719 | - |
| (226,904) | (186,059) | (129,365) | (73,015) | (215,999) | - | |
| Mississippi | 1,600,155 | 158,030 | 924,363 | 792,986 | 1,584,500 | 3,660,808 |
| (369,821) | (158,030) | (343,899) | (458,670) | (420,101) | (3,376,688) | |
| Missouri | 127,088 | - | 19,668 | - | 2434 | 1,238,438 |
| (116,833) | - | (12,733) | - | (2411) | (1,226,540) | |
| N. Carolina | 151,739 | 203,233 | 412,554 | - | 509,738 | - |
| (68,202) | (102,800) | (232,572) | - | (482,574) | - | |
| S. Carolina | 1,621,214 | 608,267 | 1,496,982 | 378,235 | 942,739 | 2,817,310 |
| (696,669) | (240,039) | (961,572) | (365,466) | (248,076) | (1,910,934) | |
| Texas | 7,195,859 | 5,531,802 | 6,845,674 | 5,325,809 | 7,309,737 | 6,091,471 |
| (1,748,155) | (1,459,325) | (3,029,989) | (1,014,621) | (1,440,613) | (2,683,279) | |
| Total | 33,151,642 | 10,940,065 | 17,151,607 | 13,832,949 | 23,968,693 | 28,106,885 |
References
- Tisdell, C.A. Wild Pigs: Environmental Pest or Economic Resource? Pergamon Press: New York, NY, USA, 1982. [Google Scholar]
- Briedermann, L. Schwarzwild; VEB Deutscher Landwirtschaftsverlag: Berlin, Germany, 1986. [Google Scholar]
- Heptner, V.G.; Nasimovich, A.A.; Bannikov, A.G.; Hoffmann, R.S. Mammals of the Soviet Union; Smithsonian Institution Libraries and National Science Foundation: Washington, DC, USA, 1988; Volume 1. [Google Scholar]
- VerCauteren, K.C.; Beasley, J.C.; Ditchkoff, S.S.; Mayer, J.J.; Roloff, G.J.; Strickland, B.K. (Eds.) Invasive Wild Pigs in North America: Ecology, Impacts, and Management; CRC Press: Boca Raton, FL, USA, 2020. [Google Scholar]
- Mayer, J.J. Overview of Wild Pig Damage. In Wild Pigs: Biology, Damage, Control Techniques and Management; SRNL-RP-2009-00869; Mayer, J.J., Brisbin, I.L., Jr., Eds.; Savannah River National Laboratory: Aiken, SC, USA, 2009; pp. 221–246. [Google Scholar]
- Strickland, B.K.; Smith, M.D.; Smith, A.L. Wild pig damage to resources. In Invasive Wild Pigs in North America: Ecology, Impacts, and Management; Vercauteren, K.C., Beasley, J.C., Ditchkoff, S.S., Mayer, J.J., Roloff, G.J., Strickland, B.K., Eds.; CRC Press: Boca Raton, FL, USA; Taylor & Francis Group: Boca Raton, FL, USA, 2020; pp. 143–168. [Google Scholar]
- Lowe, S.; Browne, M.; Boudjelas, S.; De Poorter, M. 100 of the World’s Worst Invasive Alien Species: A Selection from the Global Invasive Species Database; Invasive Species Specialist Group, Species Survival Commission, World Conservation Union (IUCN): Auckland, New Zealand, 2000. [Google Scholar]
- Keuling, O.; Podgórski, T.; Monaco, A.; Melletti, M.; Merta, D.; Albrycht, M.; Genov, P.V.; Gethöffer, F.; Vetter, S.G.; Jori, F. Eurasian wild boar Sus scrofa (Linnaeus, 1758). In Ecology, Evolution and Management of Wild Pigs and Peccaries: Implications for Conservation; Melletti, M., Meijaard, E., Eds.; Cambridge University Press: Cambridge, UK, 2018; pp. 202–233. [Google Scholar]
- Lewis, J.S.; Corn, J.L.; Mayer, J.J.; Jordan, T.R.; Farnsworth, M.L.; Burdett, C.L.; VerCauteren, K.C.; Sweeney, S.J.; Miller, R.S. Historical, current, and potential population size estimates of invasive wild pigs (Sus scrofa) in the United States. Biol. Invasions 2019, 21, 2373–2384. [Google Scholar] [CrossRef]
- Brooks, J.E.; Ahmad, E.; Hussain, I.; Khan, M.H. The agricultural importance of the wild boar (Sus scrofa L.) in Pakistan. Trop. Pest Manag. 2008, 35, 278–281. [Google Scholar] [CrossRef]
- Lindblom, S. Distribution of Wild Boar (Sus scrofa) Damage and Harvest Loss in Crop Fields. Master’s Thesis, Swedish University of Agricultural Sciences, Uppsala, Sweden, 2010. [Google Scholar]
- Amici, A.; Serrani, F.; Rossi, C.M.; Primi, R. Increase in crop damage caused by wild boar (Sus scrofa L.): The “refuge effect”. Agron. Sustain. Dev. 2012, 32, 683–692. [Google Scholar] [CrossRef]
- Schön, T. The Cost of Having Wild Boar: Damage to Agriculture in South-Southeast Sweden. Master’s Thesis, Swedish University of Agricultural Sciences, Umeå, Sweden, 2013. [Google Scholar]
- Lombardini, M.; Meriggi, A.; Fozzi, A. Factors influencing wild boar damage to agricultural crops in Sardinia (Italy). Curr. Zool. 2016, 63, 507–514. [Google Scholar] [CrossRef] [PubMed]
- Khattak, R.H.; Teng, L.; Mehmood, T.; Ahmad, S.; Liu, Z. Impacts of the wild boar (Sus scrofa) on the livelihood of rural communities in Pakistan and understanding public attitudes towards wild boars. Animals 2022, 12, 3381. [Google Scholar] [CrossRef] [PubMed]
- Tian, N.; Gan, J.; Holley, G. Assessing feral swine damage in the western gulf region of Arkansas, Louisiana, and Texas. Biol. Invasions 2023, 25, 1527–1540. [Google Scholar] [CrossRef]
- Anderson, A.; Slootmaker, C.; Harper, E.; Holderieath, J.; Shwiff, S.A. Economic estimates of feral swine damage and control in 11 US states. Crop Prot. 2016, 89, 89–94. [Google Scholar] [CrossRef]
- McKee, S.; Anderson, A.; Carlisle, K.; Shwiff, S.A. Economic estimates of invasive wild pig damage to crops in 12 US states. Crop Prot. 2020, 132, 105105. [Google Scholar] [CrossRef]
- Carlisle, K.; Didero, N.M.; McKee, S.; Elser, J.; Shwiff, S.A. Towards a more comprehensive understanding of wild pig (Sus scrofa) impacts on agricultural producers: Insights from a Texas case study. Crop Prot. 2021, 150, 105793. [Google Scholar] [CrossRef]
- Wywialowski, A.P. Agricultural producers’ perceptions of wildlife-caused losses. Wildl. Soc. Bull. 1994, 22, 370–382. [Google Scholar]
- Conover, M.R. Resolving Human-Wildlife Conflicts: The Science of Wildlife Damage Management; CRC Press: Boca Raton, FL, USA, 2001. [Google Scholar]
- Tzilkowski, W.M.; Brittingham, M.C.; Lovallo, M.J. Wildlife damage to corn in Pennsylvania: Farmer and on-the-ground estimates. J. Wildl. Manag. 2002, 66, 678–682. [Google Scholar] [CrossRef]
- Johnson-Nistler, C.M.; Knight, J.E.; Cash, S.D. Considerations related to Richardson’s ground squirrel (Spermophilus richardsonii) control in Montana. Agron. J. 2005, 97, 1460–1464. [Google Scholar] [CrossRef]
- USDA (U.S. Department of Agriculture). History of Feral Swine in the Americas. Maps: Feral Swine Populations by County. U.S. Department of Agriculture, Animal and Plant Health Inspection Service. 2023. Available online: https://www.aphis.usda.gov/aphis/resources/pests-diseases/feral-swine/sa-fs-history (accessed on 2 September 2023).
- Salassi, M.; Cater, M.; Gentry, G. Economic IMPACT of Feral Swine Damage to Agricultural Lands in Louisiana; RR125; LSU AgCenter, Louisiana State University: Baton Rouge, LA, USA, 2022. [Google Scholar]
- MDC (Missouri Department of Conservation). 2021 Missouri Feral Hog Report; Missouri Department of Conservation: Columbus, MO, USA, 2022.
- Tanger, S.M.; Guidry, K.; Nui, H.; Richard, C.; Abreu, M. Dollar Estimates of Feral Hog Damage to Agriculture in Louisiana; Research Information Sheet 113. Agricultural Economics and Agribusiness, LSU AgCenter, Louisiana State University: Baton Rouge, LA, USA, 2015. [Google Scholar]
- Shwiff, S.A.; Ernest, K.L.; Degroot, S.L.; Anderson, A.M.; Shwiff, S.S. Chapter 12. The Economic Impact of Blackbird Damage to Crops. In Ecology and Management of Blackbirds (Icteridae) in North America; CRC Press: Boca Raton, FL, USA, 2017; p. 207. [Google Scholar]
- West, B.C.; Cooper, A.L.; Armstrong, J.B. Managing wild pigs: A technical guide. Hum. Wildl. Interact. Monogr. 2009, 1, 1–54. [Google Scholar]
- Mapston, M.E. Feral Hogs in Texas; Document No. B-6149 5-04. Wildlife Services, Texas Cooperative Extension; Texas A&M University: College Station, TX, USA, 2004. [Google Scholar]
- Beach, R. Depredation problems involving feral hogs. In Feral Swine: A Compendium for Resource Managers; Hanselka, C.W., Cadenhead, J.F., Eds.; Texas Agricultural Extension Service: Kerrville, TX, USA, 1993; pp. 67–75. [Google Scholar]
- Nunley, G. Wildlife Services. In Proceedings of the Feral Swine Symposium, Fort Worth, TX, USA, 2–3 June 1999; p. 19. [Google Scholar]
- Rodriguez, S.L. Understanding Perceptions of the Impact of Feral Hogs on Private Lands in South Carolina: A Report for USDA Natural Resource Conservation Service and the South Carolina Farm Bureau; Clemson University: Clemson, SC, USA, 2016. [Google Scholar]
- Saunders, G.; Bryant, H. The evaluation of a feral pig eradication program during a simulated exotic disease outbreak. Aust. Wildl. Res. 1988, 15, 73–81. [Google Scholar] [CrossRef]
- Geisser, H.; Reyer, H.-U. Efficacy of hunting, feeding, and fencing to reduce crop damage by wild boars. J. Wildl. Manag. 2004, 68, 939–946. [Google Scholar] [CrossRef]
- Giménez-Anaya, A.; Herrero, J.; García-Serrano, A.; Garcíagonzález, R.; Prada, C. Wild boar battues reduce crop damages in a protected area. Folia Zool. 2016, 65, 214–220. [Google Scholar] [CrossRef]
- Mayer, J.J. Estimation of the Number of Wild Pigs Found in the United States; SRNS–STI–2014–00292; Savannah River Nuclear Solutions, LLC, Savannah River Site: Aiken, SC, USA, 2014. [Google Scholar]
Figure 1.
Fraction of producers reporting wild pig presence in county in the last three years.

Figure 2.
Fraction of producers with wild pig presence in county in the last three years, by state and level of change reported (“eliminated completely” not represented because the share was either zero or subject to disclosure rule).
Figure 2.
Fraction of producers with wild pig presence in county in the last three years, by state and level of change reported (“eliminated completely” not represented because the share was either zero or subject to disclosure rule).

Figure 3.
Fraction of producers reporting wild pig presence on operation in the last three years.

Figure 4.
Fraction of producers with wild pig presence on operation in the last three years, by state and level of change reported (“eliminated completely” not represented because the share was either zero or subject to disclosure rule).
Figure 4.
Fraction of producers with wild pig presence on operation in the last three years, by state and level of change reported (“eliminated completely” not represented because the share was either zero or subject to disclosure rule).

Figure 5.
Fraction of crop producers reporting changing their crop planting decision in 2021, by sub-group of crop producers based on reported wild pig presence.
Figure 5.
Fraction of crop producers reporting changing their crop planting decision in 2021, by sub-group of crop producers based on reported wild pig presence.

Figure 6.
In red: crop not planted or planted less of in 2021 because of wild pigs. In green: crop grown instead.
Figure 6.
In red: crop not planted or planted less of in 2021 because of wild pigs. In green: crop grown instead.

Figure 7.
Fraction of producers of any of the six studied crops reporting wild pig presence on any field (red), replanting because of wild pig damage (yellow), crop damage by wild pigs (blue), and incurring additional costs at harvest because of wild pigs (green).
Figure 7.
Fraction of producers of any of the six studied crops reporting wild pig presence on any field (red), replanting because of wild pig damage (yellow), crop damage by wild pigs (blue), and incurring additional costs at harvest because of wild pigs (green).

Figure 8.
Distribution of mean crop damage ratio across counties with wild pig presence.

Figure 9.
Fraction of producers with wild pig presence in county in the last three years, by state and level of change reported (“University Outreach Services” not represented because the share was either zero or subject to disclosure rule). Totals by state can sum to more than 100%.
Figure 9.
Fraction of producers with wild pig presence in county in the last three years, by state and level of change reported (“University Outreach Services” not represented because the share was either zero or subject to disclosure rule). Totals by state can sum to more than 100%.

Table 1.
Fraction of producers reporting having lost profit among those who responded having forgone planting their preferred crop and aggregated profit lost. Standard errors of the percentages are shown in parentheses.
Table 1.
Fraction of producers reporting having lost profit among those who responded having forgone planting their preferred crop and aggregated profit lost. Standard errors of the percentages are shown in parentheses.
| State | Percent of Producers | Lost Profit (in USD) | ||
|---|---|---|---|---|
| Yes | Don’t Know | No | ||
| Alabama | 0.743 | 0.078 | 0.179 | 6,933,718 |
| (0.082) | (0.033) | (0.082) | (926,957) | |
| Arkansas | 0.552 | (D) | 0.370 | 5,265,996 |
| (0.150) | - | (0.160) | (1,132,637) | |
| California | (D) | 0.000 | (D) | (D) |
| - | 0.000 | - | - | |
| Florida | 0.734 | (D) | (D) | 3,497,868 |
| (0.097) | - | - | (967,157) | |
| Georgia | 0.743 | 0.131 | 0.127 | 16,998,240 |
| (0.058) | (0.036) | (0.054) | (2,099,421) | |
| Louisiana | 0.887 | (D) | (D) | 9,922,290 |
| (0.059) | - | - | (2,261,822) | |
| Mississippi | 0.697 | 0.080 | 0.224 | 9,840,681 |
| (0.094) | (0.034) | (0.095) | (2,159,329) | |
| Missouri | (D) | 0.000 | (D) | (D) |
| - | 0.000 | - | - | |
| North Carolina | 0.496 | (D) | 0.476 | 1,431,930 |
| (0.132) | - | (0.135) | (583,963) | |
| South Carolina | 0.787 | 0.060 | 0.154 | 5,332,667 |
| (0.067) | (0.034) | (0.060) | (888,833) | |
| Texas | 0.765 | 0.153 | 0.083 | 60,126,576 |
| (0.050) | (0.046) | (0.020) | (9,806,642) | |
| Total | 0.745 | 0.118 | 0.138 | 121,814,963 |
| (0.030) | (0.023) | (0.021) | (10,796,792) | |
Table 2.
Estimates of additional time and expenses incurred at replant and harvest because of wild pigs in 2021, by state. The second and fifth columns display, respectively, the total number of additional hours by state spent replanting and harvesting due to wild pigs. The third and sixth columns display, respectively, the total additional expenses for replanting and harvest. Columns four and seven aggregate the two preceding columns accounting for a USD 16.24 hourly rate (hourly mean wage agricultural workers in support activities for crop production, https://www.bls.gov/oes/current/oes452099.htm (accessed on 20 June 2023)).
| State | Replant | Harvest | ||||
|---|---|---|---|---|---|---|
| Hours | Expenses (USD) | Total Cost (USD) | Hours | Expenses (USD) | Total Cost (USD) | |
| Alabama | 8144 | 941,997 | 1,074,258 | 32,032 | 561,484 | 1,081,682 |
| Arkansas | 2231 | 1,042,424 | 1,078,659 | 4400 | 974,186 | 1,045,642 |
| California | 122 | 48,611 | 50,584 | 286 | 48,374 | 53,024 |
| Florida | 1707 | 481,168 | 508,886 | 3120 | 1,428,683 | 1,479,350 |
| Georgia | 20,762 | 5,809,384 | 6,146,558 | 38,224 | 6,662,399 | 7,283,164 |
| Louisiana | 4952 | 1,832,891 | 1,913,312 | 6295 | 1,898,741 | 2,000,974 |
| Mississippi | 16,446 | 2,290,654 | 2,557,730 | 6681 | 1,684,616 | 1,793,122 |
| Missouri | 276 | 55,230 | 59,715 | 966 | 155,394 | 171,087 |
| N. Carolina | 382 | 54,388 | 60,594 | 2316 | 2,380,141 | 2,417,751 |
| S. Carolina | 2673 | 509,525 | 552,937 | 6309 | 1,018,675 | 1,121,137 |
| Texas | 28,177 | 3,028,794 | 3,486,390 | 82,711 | 6,060,639 | 7,403,872 |
| Total | 85,872 | 16,095,065 | 17,489,623 | 183,342 | 22,873,332 | 25,850,806 |
Table 3.
Estimated percent loss of the six studied crops to wild pigs in 2021 by state.
| State | Corn | Soybeans | Wheat | Rice | Sorghum | Peanuts |
|---|---|---|---|---|---|---|
| Alabama | 2.13% | 0.45% | 0.64% | 0.00% | 2.09% | 5.93% |
| Arkansas | 0.50% | 0.22% | 0.44% | 0.06% | 0.09% | 0.00% |
| California | 0.08% | 0.00% | 0.00% | 0.00% | 0.00% | 0.00% |
| Florida | 3.34% | 5.93% | (D) | 0.00% | (D) | 1.77% |
| Georgia | 4.79% | 1.72% | 2.85% | (D) | 4.60% | 2.09% |
| Louisiana | 1.35% | 0.44% | 2.36% | 0.91% | 7.43% | (D) |
| Mississippi | 1.73% | 0.31% | 0.43% | 0.27% | (D) | 3.33% |
| Missouri | 0.00% | 0.01% | 0.00% | 0.00% | (D) | (D) |
| North Carolina | 0.18% | 0.16% | 0.04% | 0.00% | 0.00% | 0.22% |
| South Carolina | 1.94% | 0.51% | 1.03% | NA | 11.57% | 1.21% |
| Texas | 1.97% | 1.84% | 2.30% | 8.40% | 1.05% | 0.79% |
Table 4.
Estimate of crop production lost to wild pigs statewide in 2022 (in USD).
| State | Corn | Soybeans | Wheat | Rice | Sorghum | Peanuts | Total |
|---|---|---|---|---|---|---|---|
| Alabama | 5,696,889 | 1,020,547 | 464,167 | - | 18,450 | 11,304,171 | 18,504,225 |
| Arkansas | 3,716,372 | 5,814,927 | 282,582 | 815,914 | 3768 | - | 10,633,562 |
| California | 84,777 | - | 6601 | - | - | - | 91,378 |
| Florida | 1,341,495 | 462,281 | (D) | - | (D) | 2,976,654 | 4,780,430 |
| Georgia | 15,261,240 | 1,545,512 | 884,779 | (D) | 197,461 | 19,617,780 | 37,506,772 |
| Louisiana | 8,344,264 | 4,358,593 | 127,460 | 4,348,746 | 658,077 | (D) | 17,837,139 |
| Mississippi | 11,199,535 | 5,216,330 | 61,075 | 400,027 | (D) | 1,518,186 | 18,395,154 |
| Missouri | 171,538 | 267,062 | - | - | (D) | (D) | 438,600 |
| North Carolina | 1,419,486 | 1,604,568 | 81,164 | - | - | 264,040 | 3,369,259 |
| South Carolina | 5,949,621 | 1,063,670 | 385,514 | - | 425,959 | 1,474,639 | 9,299,403 |
| Texas | 39,041,489 | 1,882,508 | 15,673,896 | 17,005,865 | 7,322,944 | 1,360,196 | 82,286,897 |
| Total | 92,226,706 | 23,235,997 | 17,967,239 | 22,570,552 | 8,626,659 | 38,515,667 | 203,142,819 |
Table 5.
Total Property repair cost by state due to wild pig damage. Standard errors of the repair costs given in parentheses. The second column displays the total number of hours by state spent repairing each property item damaged by wild pigs. The third column displays the total payments for repair. The last column aggregates the two last columns accounting for a USD 16.24 hourly rate (hourly mean wage agricultural workers in support activities for crop production, https://www.bls.gov/oes/current/oes452099.htm (accessed on 20 June 2023)).
| State | Total Hours | Total Payments | Total Repair Costs |
|---|---|---|---|
| Alabama | 26,525 | 2,278,963 | 2,709,726 |
| (4417) | (459,194) | ||
| Arkansas | 18,110 | 9,852,141 | 10,146,248 |
| (3298) | (5,405,848) | ||
| California | 14,648 | 2,155,798 | 2,393,674 |
| (4045) | (1,160,193) | ||
| Florida | 154,788 | 2,237,760 | 4,751,515 |
| (114,794) | (614,784) | ||
| Georgia | 283,063 | 12,646,987 | 17,243,925 |
| (154,173) | (5,958,331) | ||
| Louisiana | 28,474 | 1,536,884 | 1,999,306 |
| (8174) | (342,523) | ||
| Mississippi | 30,633 | 6,703,409 | 7,200,883 |
| (8515) | (2,435,177) | ||
| Missouri | 4710 | 713,509 | 790,001 |
| (2245) | (398,297) | ||
| North Carolina | 29,241 | 781,022 | 1,255,891 |
| (25,610) | (359,292) | ||
| South Carolina | 40,782 | 2,460,839 | 3,123,138 |
| (12,492) | (516,898) | ||
| Texas | 1,352,694 | 29,383,097 | 51,350,855 |
| (571,694) | (4,981,871) | ||
| Total | 1,983,667 | 70,750,409 | 102,965,161 |
| (603,974) | (9,903,592) |
Table 6.
Total hours, expenses (in USD), and cost (in USD) incurred for wild pig control by state in 2021. The second column displays the total number of hours by state spent using control methods to reduce or prevent damage from wild pigs. The third column displays the total payments for these methods. The last column aggregates the two last columns accounting for a USD 16.24 hourly rate (hourly mean wage agricultural workers in support activities for crop production, https://www.bls.gov/oes/current/oes452099.htm (accessed on 20 June 2023)).
| State | Total Hours | Total Expenses | Total Control Costs |
|---|---|---|---|
| Alabama | 224,756 | 3,613,565 | 7,263,598 |
| Arkansas | 186,426 | 1,933,241 | 4,960,792 |
| California | 16,137 | 833,180 | 1,095,251 |
| Florida | 208,642 | 20,524,360 | 23,912,701 |
| Georgia | 1,237,132 | 33,838,318 | 53,929,343 |
| Louisiana | 139,064 | 2,473,717 | 4,732,122 |
| Mississippi | 484,951 | 8,720,842 | 16,596,442 |
| Missouri | 70,827 | 1,387,628 | 2,537,859 |
| North Carolina | 30,569 | 1,277,264 | 1,773,703 |
| South Carolina | 256,606 | 7,864,747 | 12,032,028 |
| Texas | 2,089,708 | 38,300,352 | 72,237,208 |
| Total | 4,944,818 | 127,151,841 | 207,455,692 |
Table 7.
Statewide wild pig population estimates for the 11 states surveyed in 2019–2021 (in thousands).
Table 7.
Statewide wild pig population estimates for the 11 states surveyed in 2019–2021 (in thousands).
| State | Statewide Population Estimate a | ||
|---|---|---|---|
| 2019 | 2020 | 2021 | |
| Alabama | 467.7 [59.0–603.7] | 549.1 [68.5–700.9] | 549.1 [68.5–700.9] |
| Arkansas | 610.1 [66.7–780.9] | 647.3 [70.3–828.0] | 652.1 [70.8–834.0] |
| California | 599.8 [18.7–914.7] | 599.8 [18.7–914.7] | 599.8 [18.7–914.5] |
| Florida | 811.7 [94.8–1030.1] | 812.0 [94.9–1030.6] | 812.0 [94.9–1030.6] |
| Georgia | 410.1 [50.0–738.7] | 994.1 [117.4–1242.3] | 995.0 [117.5–1243.6] |
| Louisiana | 568.1 [67.3–717.7] | 603.3 [71.5–762.3] | 603.3 [71.5–762.4] |
| Mississippi | 374.3 [47.4–488.8] | 387.0 [48.8–504.4] | 428.8 [53.5–554.9] |
| Missouri | 151.1 [14.9–201.7] | 111.5 [11.1–151.3] | 92.0 [9.2–126.2] |
| North Carolina | 164.0 [19.3–218.0] | 166.9 [19.7–222.0] | 168.0 [19.8–223.6] |
| South Carolina | 111.1 [13.7–151.2] | 124.3 [15.4–168.3] | 124.4 [15.4–168.4] |
| Texas | 2941.2 [270.7–3888.9] | 2941.2 [270.7–3888.9] | 2941.2 [270.7–3889.0] |
a Wild pig population by state over the study period was generated using methods described in described in Lewis et al. [9] by R. S. Miller (unpublished data).
Disclaimer/Publisher’s Note: The statements, opinions and data contained in all publications are solely those of the individual author(s) and contributor(s) and not of MDPI and/or the editor(s). MDPI and/or the editor(s) disclaim responsibility for any injury to people or property resulting from any ideas, methods, instructions or products referred to in the content. |
© 2024 by the authors. Licensee MDPI, Basel, Switzerland. This article is an open access article distributed under the terms and conditions of the Creative Commons Attribution (CC BY) license (https://creativecommons.org/licenses/by/4.0/).
Share and Cite
MDPI and ACS Style
McKee, S.C.; Mayer, J.J.; Shwiff, S.A. Comprehensive Economic Impacts of Wild Pigs on Producers of Six Crops in the South-Eastern US and California. Agriculture 2024, 14, 153. https://doi.org/10.3390/agriculture14010153
AMA Style
McKee SC, Mayer JJ, Shwiff SA. Comprehensive Economic Impacts of Wild Pigs on Producers of Six Crops in the South-Eastern US and California. Agriculture. 2024; 14(1):153. https://doi.org/10.3390/agriculture14010153
Chicago/Turabian StyleMcKee, Sophie C., John J. Mayer, and Stephanie A. Shwiff. 2024. "Comprehensive Economic Impacts of Wild Pigs on Producers of Six Crops in the South-Eastern US and California" Agriculture 14, no. 1: 153. https://doi.org/10.3390/agriculture14010153
Note that from the first issue of 2016, this journal uses article numbers instead of page numbers. See further details here.