
Ultimate Bearing Capacity Analysis of Pile Caps with New Socket Connections


1
School of Urban Construction and Safety Engineering, Shanghai Institute of Technology, Shanghai 201418, China
2
China Railway 22TH Bureau Group 3RD Engineering Corporation Limited, Xiamen 361000, China
3
Shanghai Urban Construction Design Research Institute (Group) Co., Ltd., Shanghai 200125, China
*
Author to whom correspondence should be addressed.
Buildings 2022, 12(11), 2034; https://doi.org/10.3390/buildings12112034
Submission received: 9 October 2022
/
Revised: 5 November 2022
/
Accepted: 15 November 2022
/
Published: 21 November 2022
(This article belongs to the Special Issue Improvement Technology on Building Seismic Toughness)
Abstract
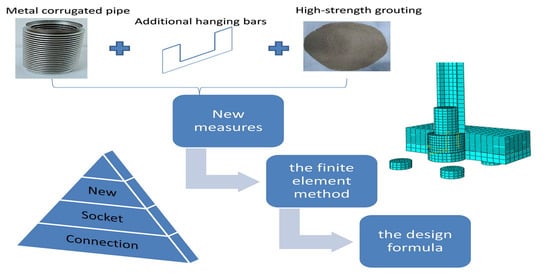
:Socket connection need a groove reserved in the cap to accommodate a bridge pier, which greatly weaken the vertical bearing capacity of the cap. The conventional treatment measure is to increase the thickness of the cap, and the corresponding cost will increase. The measures to enhance the vertical bearing capacity of socket caps without increasing the thickness of the cap were discussed in this paper, including a rough interface at the bottom of the pier, additional hanging bars, high-strength grouting material in the seam, and large-diameter metal corrugated pipes, etc. Based on a previous test, the finite element analysis of the vertical bearing capacity of pile caps with new socket connections was carried out. The analysis parameters included the construction method, steel bar diameter in the bottom of the cap, socket depth, thickness of the bottom plate, pile length, and friction coefficient, etc. The bearing capacity M–N relation of the full-scale model was also analyzed. Research indicated the vertical bearing capacity of the cap is mainly provided by rough interfaces, the bottom plate, and the additional hanging bars, and the contribution of the three parts was about 40%, 34%, and 26%; the vertical bearing capacity was proportional to the areas of steel bars on the cap and the thickness of the bottom plate, and was inversely proportional to the length of the pile. To obtain the vertical bearing capacity of the overall cast-in-place plan for the socket cap, the thickness of the cap needs to be increased by 27%. At last, a design formula for the calculation of the vertical bearing capacity was proposed.
1. Introduction
The precast assembly technology of bridge piers is the current development direction of bridge engineering because of its advantages of rapid construction, reducing construction risks for workers, and reducing on-site labor [1], etc. There are many types of connections between the pier and the pile cap, such as grout sleeve, prestressing strands, and metal bellows [2,3]. Socket connections show good application prospects among them [4]. Due to the low material strength and lack of structural strengthening measures, the traditional embedding length requirement is longer in socket connections; the thickness of the pile cap is also larger, which leads to an increase in the cost and limits application occasions [5]. With the further study of socket connections, the method of using a high-strength grouting material, large-diameter metal bellows, rough interfaces with shear keys, and anti-punching steel reinforcement at the bottom of the groove is proposed [6]. Then, under certain conditions, the minimum socket depth can be achieved in the hollow pier and cap with the socket connection [7,8]. This is the best solution in terms of vertical bearing capacity, horizontal bearing capacity, cap thickness, and cost, etc.
Regarding the application of socket connections, there are many precedents at home and abroad. In the 1950s, the piers and columns of many railway bridge piers adopted socket connections in China. The Beijing Jishuitan Bridge Test Project, which was completed in 1992, is a highway precast bridge pier project completed earlier in China. In 2013, the interstate bridge of the SR520 highway in Washington State, USA adopted the socket connection technology [4]. The states of Minnesota and Louisiana in the United States have standardized the design of socket connections for pile foundations caps [2]. In 2016, one of the ramp bridges of the second north section of the Shanghai Jiamin Elevated Bridge also adopted a socket connection structure. The Huaihe River Bridge and the Zhongpaihe Bridge in Anhui Province, the eastern extension of the Jiangbei Expressway in Hubei Province, and a highway bridge in Shandong Province also use socket structures. In 2019, the socket precast pier connection technology was adopted for the viaduct project of the Beijing–Xiong’An Expressway. There are many other cases of socket connections for precast columns and foundations, which can be found in other countries [2].
At present, many scholars have carried out many research works on socket connection structures [8,9,10,11,12], such as Osanai Y. (1996) [13], Canha R. (2009) [14], Mohebbi A. and Saiidi M. (2018) [15,16], Wang Z.Q. (2019) [17], Cheng Z. (2021) [18,19], and Zhang G. (2021) [20]. Research on socket connections has been focused on whether the mechanical properties of socket bridge piers are similar to those of integral cast-in-place bridge piers, and the reasonable embedded depth of the cap, but there are few studies on the thickness of the bottom plate in the socket connection [5]. Chan T. K. studied the behavior of pre-cast reinforced concrete pile caps and the ultimate load-carrying capacity with three specimens. The research showed that the current design equations for conventionally cast in situ construction can be used to predict the failure loads of the pre-cast units, although the predictions may be conservative in certain cases [21]. Cheng Z. experimentally evaluated the side shear strength of preformed socket connections with various connection parameters. The test results showed that the side shear mechanism in the preformed socket connections could provide significant resistance, facilitating transfer of large vertical loads [22].
The force mechanism of the pile cap is relatively complicated. The thickness of pile cap in socket connections is usually determined by the embedded depth of the column and the thickness of the bottom plate. This paper studied the thickness of the cushion cap through finite element analysis based on the improved socket connection proposed, established the finite element model correctly through experiments, and then discussed the influence of different factors on the vertical bearing capacity of the socket structure. Finally, a formula for calculating the vertical bearing capacity of bearing structure was proposed, which can be available for reference at the time of specification preparation.
2. Analysis of Influencing Factors on Socket Connections
2.1. Structure Detail and Composition
In traditional socket-type structures, the precast pier body is directly inserted into the reserved hole of the foundation, and a certain thickness of mortar is laid at the bottom. There are no steel bars connected between the bridge pier and the foundation. The foundation can be cast-in-place or precast. The advantage of this connection structure is that the construction process is simple and the amount of on-site work is limited [4], as shown in Figure 1.
Compared with the cast-in-place pier, the socket-type bridge cap does not meet the equivalent design, while the bridge pier completely meets the equivalent design. Its construction technology requirements are not high, and the social recognition is high, but its scope of application is narrow. It is generally considered that it is only suitable for connections between the column and the pile cap, and not suitable for other occasions. From the perspective of overall force transmission, this method weakens the vertical bearing capacity of the cap, and the damaged part may be transferred from the pier to the cap. Therefore, appropriate measures should be taken to ensure that damage only occurs in the plastic hinge area of the pier. If there are construction defects, this will have little impact on safety, and there is no safety risk in the normal operation stage. However, under extreme loads the safety factor of vertical bearing capacity will be reduced. For various precast assembly technologies, as long as the materials are qualified and the construction and design meet the design standards, it should be considered a suitable assembly solution. The most appropriate assembly scheme for each part is recommended in Table 1 below.
With the improvement of the requirements of modern precast structures, the traditional socket connections cannot meet engineering needs anymore, so an improved socket structure needs to be proposed. To improve the bearing capacity of the cap, the side of the socket in contact with the pier can be used as a breakthrough. By adding trapezoidal shear keys on the side contact surface and using the shear keys to provide shear force, the resisting moment of the contact part can be increased, thereby reducing the socket’s depth, as shown in Figure 2. At the same time, an anti-punch hanging bar is added inside the cap to increase the vertical punching-shear bearing capacity of the cap. It should be noted that U-shaped steel bars are reserved at the bottom of the groove of the cap, and after the core-filled concrete is poured in the pipe pier, an effective constraint will be formed between the bottom of the groove and the bottom of the pier. This constraint applies only to the structural connection between hollow piers and socket caps, and this type of structure cannot be used for solid piers. The existence of this structure makes the socket depth of hollow piers shorter than that of solid piers of the same diameter. This structure is related to the flexural capacity of bridge piers under horizontal loads. The details can be found in reference [6].
2.2. Full-Scale Bridge Piers
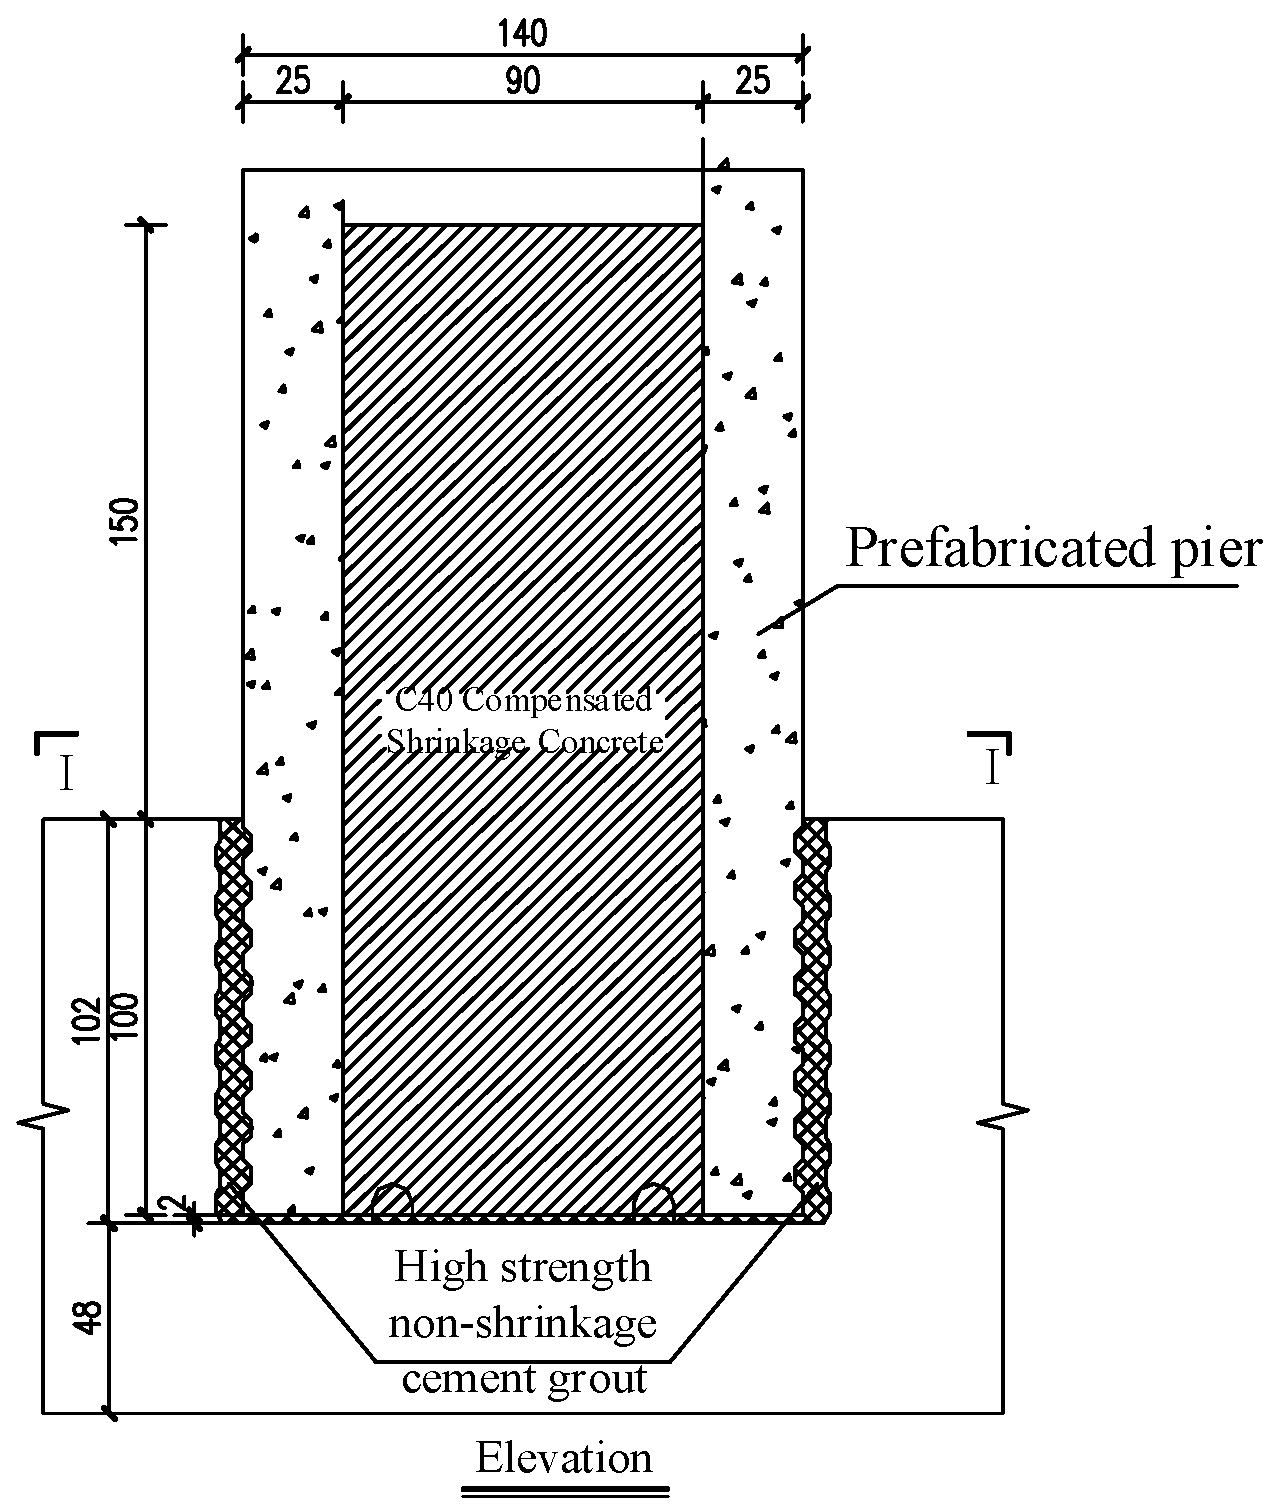
According to the abovementioned improvement ideas, the new socket design scheme of the centrifugal pipe pier, as shown in Figure 3 and Figure 4, is finally proposed. According to the existing results, the ratio of the socket depth of the pile cap to the diameter of the pier was 0.7. The ratio of socket depth to base plate thickness was 2:1. The height of the cap was 1.5 m, the socket depth was 1 m, and the thickness of the bottom plate was 0.5 m. The insertion end of the pipe pier adopted rough interfaces, and the groove of the cap was made of a large-diameter corrugated pipe to form a groove, which could form a restraint effect on the caulking concrete. Anti-punch hanging bars were set at the bottom of the groove of the cap to enhance the shear resistance. The diameter of the reinforcing bars of the bottom plate was 25 mm, the diameter of the other bars was 16 mm, and the spacing between the bars was 100 mm. The pier was poured with C70 (C70 means the standard compressive strength of the concrete is 70 MPa) concrete and filled with C40 concrete. The longitudinal steel bars were HRB400 (HRB400 means hot-rolled ribbed bars with yield strengths of 400 MPa) steel bars, where 36 steel bars had a diameter of 28 mm in the outer ring and 18 steel bars had a diameter of 16 mm in the inner ring, and HPB300 (HPB300 indicates hot-rolled plain steel bars with yield strengths of 300 MPa.) spiral stirrups had a spacing of 100 mm.
2.3. Model Specimens
During the experimental study, the similarity ratio was 1:2. The diameter of the steel bar of the model cap and the base plate of the cap was 18 mm; the diameter of the other bars was 12 mm, as shown in Figure 5. To meet the requirements of the length of the longitudinal reinforcement, the bottom of the pier was provided with a perforated plug welding of the steel plate with the longitudinal reinforcement of the pier.
The specimens were poured with C70 concrete and filled with C40 concrete. The longitudinal steel bars were HRB400 steel bars, where 18 steel bars had a diameter of 20 mm in the outer ring and 9 steel bars had a diameter of 10 mm in the inner ring, and HPB300 spiral stirrups had a spacing of 100 mm. The main reinforcement of the pier column and the steel end plate adopts perforated plug welding, the size of the steel end plate was the same as the section of the pier column, the thickness was 10 mm, and Q235 (Q235 indicates a steel plate with a yield strength of 235 MPa) steel was used. The structure diagram of the scaled pier column is shown in Figure 6.
3. Experimental Research
3.1. Specimen Design
In the whole research plan, seven specimens were included, and the research parameters included the depth of bearing insertion, the thickness of the base plate, and the construction method [7]. The focus of the paper was the vertical bearing capacity analysis of precast assembled piers; only specimen S7 was used, as shown in Table 2. Specimen S7 is a precast pier and bearing platform specimen. The caps under the pier column were hollowed out, no bottom plate was provided, temporary supports were set under the caps, and high-strength non-shrinkage cement grouting material was poured. This study focused on the bearing capacity under vertical load, so only the test results of specimen S7 are introduced.
Model construction and assembly were divided into three stages, which are the production of steel cages for pipe piers, the centrifugal forming of pipe piers, and the prefabrication and assembly of the caps. Some construction photos are shown in Figure 7.
3.2. The Test Loading Device and the Loading Process
Test loading equipment was a 10,000 kN electro-hydraulic servo multifunctional structural test system, as shown in Figure 8. The vertical loading capacity was 10,000 kN in compression and 3000 kN in tension. The maximum stroke was ±300 mm. The horizontal loading capacity was 1500 kN, and the maximum stroke was ±400 mm. The test force measurement range and indication accuracy were 4%–100%, and the displacement resolution was 0.01 mm. Specimen S7 was subjected to axial force by means of the force control and the loading rate was 50 kN/min. The specimen was loaded in axial pressure only and slowly increased until it was damaged. The load increment was about 500 kN, and it was necessary to hold the load and observe the cracks and damage process at each load step. Because of the limitation of the test loading capacity, the maximum loading capacity of the testing machine was 10,000 kN. When the central loading was used, the specimen was not damaged when it reached 10,000 kN, so eccentric loading was applied after unloading in order to obtain the damage pattern of the precast piers. At eccentric distances of 5 cm and 10 cm, the specimens were not damaged. Until the eccentricity of the specimen reached 12.5 cm, the pier was damaged.
3.3. Test Results
The specimen was subjected to axial compression loading. When the central compression axial pressure was loaded to 4500 kN, a micro-crack was found on the surface of the grouting material on the top surface of the bearing platform, and the crack width was 0.033 mm. When it was loaded to 10,000 kN, the maximum crack width of the grout was 0.08 mm. When the eccentric distance to the south side was changed to 5 cm, the bias loading was carried out. No cracks were found before the loading reached 3000 kN. When the load was 3500 kN, the original crack width of the grouting material was 0.04 mm; when the load was 7500 kN, the width of the first crack was 0.06 mm and the second crack appeared with a width of 0.024 mm. When it was loaded to 10,000 kN, the width of the first crack was 0.07 mm and the width of the second crack was 0.034 mm. Since the limit of the testing machine was reached, the eccentric distance was changed to 10 cm for bias loading. When the loading reached 3500 kN, the width of the first crack was 0.052 mm and the width of the second crack was 0.029 mm. When it was loaded to 10,000 kN, the width of the first crack was 0.072 mm and the width of the second crack was 0.046 mm. Then, the eccentric distance was changed to 12.5 cm for bias loading, and the loading reached 3500 kN; the width of the first crack was 0.06 mm and the width of the second crack was 0.04 mm. Continuing to load, horizontal cracks appeared on the tension side in the south, and vertical cracks appeared on the compression side in the north. When it reached about 9000 kN, there was an explosion, and a large piece of concrete on the compression side at the junction of the north side of the top of the pipe pier and the loading head peeled off, the concrete splashed, and the bearing capacity decreased. One longitudinal bar on the east side buckled, causing three stirrups to break; one longitudinal bar on the east side of the west side buckled, causing two stirrups to break. This shows that under eccentric compression, the unfilled hollow pipe pier becomes the weak link of the precast pipe pier. The damage mode is shown in Figure 9.
After the experiment, it was found that four cracks appeared in the grouting material, which was approximately evenly distributed along the circumference. A ring-shaped crack appeared between the corrugated pipe and the cap concrete, indicating that the grouting material and the pipe pier formed a whole. Under different loading conditions, the crack width was larger under eccentric loading. There were two to three cracks on the east and west sides and one crack on the north and south sides, developing from bottom to top. The distribution of cracks is shown in Figure 10.
Figure 11 shows the vertical load–displacement relationship of specimen S7 with different eccentricity. It can be seen that as the eccentric distance increased, the stiffness of the load–displacement curve increased at first. At the maximum eccentric distance, the load–displacement curve suddenly dropped, showing the characteristic of brittle failure.
4. Finite Element Analysis of Specimens
4.1. Establishment and Verification of Model
Taking the 1:2 specimen model as the object, finite element analysis was carried out on the pile cap of different structures and designs, and the influence of different factors on the vertical bearing capacity of the socket connection was analyzed. The concrete material was simulated by the plastic damage constitutive model. Using 3D element modeling, the precast pipe piers were modeled by partitions. The ideal elastic–plastic model was used for the anchoring end and the bottom of the cap, and the damage–plastic model was used for the splicing surface, as shown in Figure 12.
The materials used in the model in this paper were mainly concrete and steel bars. The concrete adopted the C3D8R unit and the steel bar adopted the T3D2 unit. The details are shown in Table 3. The number of elements was 10366 and the number of nodes was 14939. The software used was ABAQUS.
The interaction part of the model adopted a Tie (binding) constraint and built-in steel bars. Metal bellows and the concrete surface at the joint were friction-treated. We set the coefficient of friction to 0.6 [23]. The socket part of the pipe pier was set with a width of 70 mm isometric annular shear keys to simulate the helical shear keys on the surface of the metal bellows and fix four piles. The steel bars were built-in and set as truss units. The first analysis step was set as a force-loading step and the second step was set as a displacement-loading step, and the displacement amplitude was added step by step. When the horizontal force was loaded, the vertical axial force was applied to simulate the dead load, and then the horizontal displacement was added until the specimen failed.
The load–displacement curve obtained by vertical loading is shown in Figure 13. It can be seen that the initial stiffness calculated by the finite element was nearly the same as the test results. The experimental results showed a high capacity with brittle failure, whereas the finite element model showed moderate capacity with ductile behavior, because there was a sudden concrete failure in the top of the pier in the experiment. As the focus of this paper was the ultimate bearing capacity of the pile cap, it can be safely suggested that the vertical bearing capacity calculated by the finite element method is reliable.
It can be seen from the comparison of the above simulation results and test results that the established finite element model has a good simulation effect on the load–displacement curve of the precast socket-type pier. The finite element model can quantitatively simulate the whole process of precast socket-type piers under vertical and horizontal loads. The ultimate vertical bearing capacity of precast socket-type piers is related to the different configuration measures, the reinforcement of the cap, the depth of the socket, the thickness of the base plate of the cap, and the length of the pile, etc. The following parametric analysis of these influencing factors was carried out.
4.2. Parametric Analysis
4.2.1. Different Configuration Measures
To explore the influence of different connection methods of components on the vertical bearing capacity and the contribution of different parts to the overall bearing capacity, a comparison model with only shear keys and only the bottom plate was added. Model diagrams for different connection structures are shown in Figure 14 below. A summary and comparison chart of the vertical bearing capacity of the three comparison models is shown in Figure 15.
It can be seen from Figure 15 that the specimen with shear keys, U-shaped steel, and a base plate had the largest vertical bearing capacity, followed by the model with only shear keys, and the ultimate bearing capacity of the base plate-only model was the smallest. Each part of the structure in the whole is listed as shown in Table 4. It can be seen that the vertical bearing capacity of the pile cap was mainly provided by the shear key, the bottom plate, and the U-shaped steel bar, and the contributions of the three parts were 40%, 34%, and 26%, respectively.
4.2.2. The Influence of the Cap Reinforcement
The steel reinforcement inside the cap plays an important role in the vertical bearing capacity of the entire component and is one of the main parts of the vertical bearing capacity contribution. The main factors affecting the vertical bearing capacity of the steel cap are the grade of the steel bar, the reinforcement ratio, and the location. This section mainly studies the effect of reinforcement ratio and U-shaped punching shear reinforcement on the vertical bearing capacity of the cap.
For different reinforcement ratios, there is no need to change the model in the finite element analysis; rather, we can just modify the diameter of the reinforcement material when assigning material properties, and then assign the material to the reinforcement section. The original diameter of the steel bar was 18 mm. For reference analysis, models with steel bar diameters of 8 mm, 16 mm, 20 mm, 25 mm, and no steel bar were created respectively. The finite element analysis results are shown in Figure 16. It can be seen that as the reinforcement ratio increased, the vertical bearing capacity also increased, showing a positive correlation. Specimens with low reinforcement ratios reached the plastic stage earlier than those with high reinforcement ratios. The bearing capacity of the specimens with diameters less than 20 mm appeared to decrease after reaching the maximum bearing capacity. The vertical bearing capacity of the model with a diameter of 8 mm and no steel bar had the largest and most obvious decrease, indicating that the steel bar has a great effect on the vertical bearing capacity. When the longitudinal reinforcement bar of the pile cap was increased from 18 mm to 25 mm, there was a 20% increase in the vertical bearing capacity. It can be seen that increasing the steel bar diameter of the cap is an effective method to improve the vertical bearing capacity of the cap.
4.2.3. The Effect of Socket Depth
The socket depth is the most important part of the structure of the socket precast component, and the socket depth affects the horizontal and vertical bearing capacity of the entire structure to a large extent. In the vertical behavior, the socket depth will affect the bottom plate thickness of the bearing plinth. In the case of a certain height of the platform, the greater the socket depth, the smaller the thickness of the reserved bottom plate, and the corresponding vertical bearing capacity will also be greatly reduced. On the horizontal structure, when bearing lateral horizontal force, the smaller the socket depth is, the greater the lateral displacement of the corresponding pier column that is likely to occur. The lateral bearing capacity is poor, and the structure is more prone to damage. The research on socket depth has been focused on the influence on the horizontal bearing capacity, but there is less research on the influence on the vertical bearing capacity. To study the vertical bearing capacity, a set of specimens with different values of socket depth was designed. This group of specimens had the same bottom plate thickness, and the socket depth was the only variable, which was 0.5D, 0.7D, and 1.5D, respectively. The base plate thickness was 0.36D. The pile cap height was 0.86D, 1.07D, and 1.86D according to the arrangement of socket depth from large to small.
It can be seen from Figure 17 that when the bottom plate thicknesses were the same, the socket depth had a certain influence on the bearing capacity of the component. As the socket depth increased, the vertical bearing capacity of the cap increased. When the socket depth was small, the growth trend of the ultimate bearing capacity was more obvious. When the socket depth was greater than 1.0D, the increase was relatively small. As far as the ultimate bearing capacity is concerned, the bearing depth of 1.5D is twice that of 0.7D, but its limit value was only about 11% larger than that of 0.7D, and the increase was not large. This shows that when the thickness of the pile cap reaches a certain level, the failure mode of the structure will change from the punching failure of the pile cap to the compression failure of the bridge pier, so the final vertical bearing capacity calculated will not increase all the time.
4.2.4. The Influence of the Thickness of the Base Plate
The precast pier column and the cap were connected by the hollow part in the middle of the cap, and then high-strength grouting material was poured to strengthen the connection wholeness. Under the action of vertical force, in addition to the vertical reaction force generated by the shear key inside the hollow and the U-shaped punching-resistant steel bar inside the cap, there was also a part of the vertical force provided by the base plate at the bottom of the cap which was in contact with the pier column. To explore the influence of different base plate thicknesses on the vertical bearing capacity of components, a total of five finite element models with different plate thicknesses were added, which were 15 cm, 20 cm, 25 cm, 35 cm, and 45 cm. The pile cap heights were 65 cm, 70 cm, 75 cm, 80 cm, and 85 cm in sequence according to the thickness of the bottom plate.
It can be seen from the Figure 18 that as the thickness of the bottom plate increased, the overall vertical bearing capacity increased. As the thickness of the bottom plate increased, the displacement corresponding to the ultimate load also increased. When the thickness of the bottom plate was 45 cm, there was only a slight descending section after reaching the limit. It is not difficult to see that the greater the thickness of the base plate, the greater the punching shear resistance provided, and the vertical bearing capacity also increases. When the plate thickness increased from 25 cm to 45 cm, there was a 21% increase in the vertical bearing capacity.
To explore the thickness of the base plate, the precast components can be compared with the cast-in-place components, as shown in Figure 19. The pier part of the base plate was included in the finite element analysis. If the mechanical properties of the socket-type cap were completely equal to the cast-in-place result, the thickness of the bottom plate needed to be increased to 450 mm. At this time, the steel strain of the base plate of the two caps was nearly the same as the deformation of the center of the cap.
4.2.5. The Effect of Pile Length
The pile cap is an important part of the socket-connected precast pier. As a component directly connected to the ground, the pile is a vertical force-transmitting component that transmits the force on the superstructure to the ground. The length of the pile reflects the restraint at the bottom of the cap. The shorter the pile length is, the more likely the bottom of the cap is to be consolidated at the position of the pile. The longer the pile length is, the closer the cap bottom is to the hinge at the position of the pile. To explore the influence of the pile length on the vertical bearing capacity of the members, on the basis of the S2 specimen, only the pile length of the specimen was changed, and other conditions remained unchanged; pile lengths of 0.2 m, 0.5 m, 1.5 m, and 2.5 m were analyzed by the finite element method. The results are summarized in Figure 20. It can be seen that with the increase of the pile length, the vertical bearing capacity of the member gradually decreased. Regardless of the length of the pile, its bearing capacity curve was relatively flat and had better performance. When considering the flexible deformation of the pile, the vertical bearing capacity of the pile cap decreased. In the case analyzed in this paper, when the pile length increased from 0.2 m to 2.5 m, the vertical bearing capacity decreased by 12%. Next, it is necessary to carry out the vertical bearing capacity analysis considering the combined action of piles and soil in detail.
4.2.6. Influence of Friction Coefficient
The coefficient of friction is a property of the interaction between different materials. Different materials, different grades of concrete, and rebar interactions will have different coefficients of friction. The choice of the basic friction coefficient of 0.6 in this paper is based on the information provided by the previous literature and the consideration of the safety of the vertical bearing capacity. To explore whether different friction coefficients will affect the results of finite element analysis, finite element models with friction coefficients of 0.4, 0.8, 1, and 1.2 were assigned for simulation analysis. Figure 21 shows the vertical displacement–load diagram of each friction coefficient obtained by vertical displacement loading on the basis of specimen S2, only changing the friction coefficient of the material interaction.
It can be seen from the above analysis that the increase of the friction coefficient increased the vertical bearing capacity of the structure and the selection of different friction coefficients had a certain impact on the vertical bearing capacity. The larger the friction coefficient is, the greater the vertical bearing capacity is. With the increase of the friction coefficient, the increase degree of the vertical bearing capacity decreased significantly. The final finite element analysis results of the two friction coefficients of 1.0 and 1.2 are not significantly different. The exact value of friction coefficient needs to be determined by future experimental research.
5. Analysis of Full-Scale Bridge Piers
5.1. Finite Element Modeling and Analysis
To explore the behavior of the original socket connection, a full-scale cast-in-place model and a precast model were established respectively, and vertical displacement loading was performed to obtain the displacement and load curves.
The displacement–load curve of the finite element results is drawn in Figure 22, and the vertical load limit values of full-scale and precast piers are listed in Table 5 below. It can be seen that the vertical bearing capacity of the full-scale member was about 4 times that of the scaled model, which is in line with the theoretical calculation and proved the correctness and accuracy of the model. The results of the finite element analysis can simulate the actual engineering situation well.
5.2. Bending Moment and Axial Force Correlation Analysis
To further study the factors affecting the mechanical properties of the full-scale model, parameter analysis of axial compression was performed. In practical engineering applications, the pile part of the cushion cap needs to be inserted deep into the ground to ensure the stability of this component, and the pile length is larger than the full-scale model mentioned above. To make the model closer to the actual project, a full-scale model with a pile length of 5 m was added. First, the model was subjected to vertical displacement loading to obtain the maximum vertical load N of the model, and then horizontal displacement loading was applied to the components with 0.1, 0.2, 0.3, 0.4, and 0.5 times the limit of the axial load N to obtain the horizontal bearing load; 0.1 N is 0.1 times the limit axial force N. Taking the length of the bridge pier as the moment lever arm, the ultimate bending moment that the member can bear in the plastic hinge region can be obtained. The full-scale precast model was equally magnified according to the experimental model (Figure 4) with a scale of 1:2, as was the full-scale cast-in-situ model.
In addition, a full-scale model with a bottom plate thickness of 0.8 m was added. The model was established to explore the effect of the bottom plate thickness on the horizontal load.
The maximum horizontal load force was extracted from the horizontal displacement load curve under different axial loads. Taking the height of the bridge pier as the lever arm, M–N correlation diagrams of different models were made. Assuming that the cracking load is the load corresponding to the reinforcement stress of 200 MPa in the pier, the relationship between the horizontal cracking load and the axial force is also shown in Figure 23.
It can be seen that when the axial pressure ratio was small, with the increase of the axial pressure, the horizontal bearing capacity of the pier increased, and the corresponding bending moment also increased, showing a positive correlation. When the axial pressure reached about 0.4, there was a situation where the maximum horizontal load occurred. When continuing to increase the axial pressure, the bending moment did not increase but decreased. This is because as the axial pressure continued to increase, the phenomenon of bias pressure appeared under the combined action of the horizontal load, and the corresponding second-order effect was produced on the pier column, which reduced the bearing capacity.
Under the abovementioned conditions, the vertical ultimate bearing capacity was not much different when the bottom plate thickness was 0.5 m and 0.8 m, respectively. This is related to the failure form of the bridge pier mentioned above. Therefore, based on the abovementioned full-scale model, a cap-only loading model was added to carry out by vertical displacement loading. When the thickness of the bottom plate increased, the vertical bearing capacity of the precast cap also increased accordingly. When the thickness of the base plate increased from 0.5 m to 0.8 m, there was a 20% increase in the vertical bearing capacity.
To explore the vertical bearing capacity gap between the prototype cast-in-place pier scheme and the precast pier scheme, the prototype cast-in-place pier with a height of 1.5 m and a pile length of 5 m was vertically loaded, and the results are shown in Figure 24. It can be seen that the vertical bearing capacity of the precast scheme with a base plate thickness of 0.5 m was 72% of that of the prototype cast-in-place scheme. When the thickness of the bottom plate was increased to 0.8 m, that is, the height of the cap was 1.8 m and the bearing capacity of the precast cap was about 87% of that of the cast-in-place cap. The vertical bearing capacity of the two was relatively closer. At the same time, considering the cost factor, it is finally suggested that the thickness of the base plate of the full-scale precast bridge pier scheme should be 0.8 m, that is, the total height of the precast cap is 1.8 m.
6. The Derivation of Formula
6.1. Force Model Analysis
It is assumed that the vertical bearing capacity of the cap is mainly composed of three parts: the bending of the bottom plate, the shear key of the side wall, and the suspension of the hanging bars. According to the improved socket structure proposed in this paper, the overall force layout of the components is shown in Figure 2, including side shear keys, hanging bars, and bottom bars. The composition of the vertical bearing capacity of specific components is shown in Figure 25.
Shear keys provide vertical loads on the one hand and bending resistance on the other. The two are superimposed together to participate in resisting external loads, so when calculating the vertical bearing capacity, only part of the shear keys is considered to participate. In the process of vertical loading, half of all shear keys was assumed in the paper.
6.2. Design Formula
Referring to the existing punching design formula in China, the following design formula is proposed.
In the formula, is the safety factor; is the design value of maximum punching force for socket connection; is the dimension effect coefficient for the height of the bottom plate of the socket connection. When ≤ 300 mm, βh is 1.0 h; when ≥ 800 mm, βh is 0.85 h. In between, βh takes the value by straight line insertion; is the design value of tensile strength of concrete axial center of bottom plate of the socket connection; Um is the perimeter of the cross-sectional area of the broken blank cone at a distance of from the pier bottom (top) action surface of the retaining socket member; is the distance from the bottom of the pier to the main reinforcement of the bottom plate of the socket connection; is the design value of tensile strength of vertical U-shaped steel bar around the socket connection; is the total cross-sectional area of the vertical U-shaped reinforcement around the socket connection; is the shear force value provided by the shear key [24,25].
In the formula, is the concrete compressive strength grade; is the specimen pier diameter; is the shear key area angle value and is suggested to take .
6.3. Formula Validation
The scaled model and full-scale model studied in this paper were calculated using the abovementioned formulas. The concrete of cap was C40, the design value of axial tensile strength , socket depth = 0.5 m, the thickness of the bottom plate was 0.15, 0.2, 0.25, 0.35, and 0.45 m, respectively, protective layer thickness c = 30 mm, allowable shear stress of concrete was 1.35 MPa. The remaining correlation coefficients were taken according to the requirements of the abovementioned formula. We substituted the data into the abovementioned formula for calculation, and summarized all calculation results as shown in Table 6. In practical engineering use, to ensure the safety of use, the cracking load and the development of cracks are usually used as the standard for normal operation, and the crack width of 0.2 mm is usually used as the standard. It was assumed that the maximum stress of the tensile reinforcement shall not exceed 200 MPa. Therefore, the stress–load diagram of the steel bar at the maximum stress of the steel bar in the finite element model was selected, and the vertical load data with a stress of 200 MPa was extracted as the design value, which is summarized in the following table. This result can fully reserve the safe bearing capacity space to achieve the purpose of ensuring the safety of use.
From the comparison of the results in the above table, it can be seen that the design load of the model was taken as the cracking value of the finite element load. The calculated values of the existing formula and the design formula proposed in this paper were all smaller than the value of the finite element model, which further shows the reliability of the model and the correctness of the design formula in this paper. The multiples of the safety factor were all greater than 1, indicating the reliability of the calculated value of the formula. By comparing the formula value and safety factor, it shows that the design formula proposed in this paper can be well applied.
7. Conclusions
- The use of rough interfaces at the bottom of the pier, U-shaped hanging bars in the bottom groove, high-strength grouting material in the seam, and large-diameter metal corrugated pipes are effective measures to enhance the vertical bearing capacity of the socket cap. Compared with the tradition socket type, the improved socket type can improve the vertical bearing capacity of the cap and can be used for occasions with high vertical bearing capacity requirements.
- In the case of a certain height of the platform, the greater the depth of the socket, the smaller the thickness of the bottom plate. Similarly, the smaller the socket depth, the greater the thickness of the bottom plate. Therefore, there is a negative correlation between the socket depth and the bottom plate thickness, that is, one increases and the other decreases. The purpose of the research is to find a socket depth that can maximize the bearing capacity of the components and reduce the cost under the condition that the height of the cap is fixed. Therefore, it is necessary to select an optimal socket depth according to the force characteristics to meet these two conditions.
- The vertical bearing capacity of the pile cap is mainly provided by shear keys, the bottom plate, and the U-shaped steel bar. The contribution of the three parts is about 40%, 34%, and 26%, respectively.
- The vertical bearing capacity of the pile cap increased with the increase of the diameter of the hanging bars and the longitudinal bars of the bottom plate. With the increase of socket depth, the flexural bearing capacity of the pier increased. When the plate thickness was increased from 25 cm to 45 cm, there was a 21% increase in the vertical bearing capacity. When the thickness of the bottom plate increased to a certain extent, the vertical bearing capacity of the pile cap was greater than that of bridge piers. The vertical bearing capacity of the pile cap was not a weak link. When considering the flexible deformation of the pile, the vertical bearing capacity of the pile cap decreased. When the equivalent pile length increased from 0.2 m to 2.5 m, there was a 12% increase in the vertical bearing capacity.
- When the thickness of the base plate of the cap was 0.8 m and the total height was 1.8 m, the vertical bearing capacity of the precast cap was about 87% of that of the cast-in-place cap. Considering the cost factor, it is finally recommended to select 0.8 m for the thickness of the base plate of the full-scale precast bridge pier scheme in the case.
- This paper proposed an estimation formula for the vertical bearing capacity of the socket cap, which has a certain safety factor and can be used for design reference. Additional experimental research is needed to verify the accuracy of the finite element analysis results and formula calculation in this paper.
Author Contributions
Conceptualization, J.G. and X.Y.; methodology, J.G. and L.L.; formal analysis, L.L.; funding acquisition, S.L.; validation, S.L. and X.Y.; writing—original draft, J.G. and L.L.; writing—review and editing, S.L. and X.Y. All authors have read and agreed to the published version of the manuscript.
Funding
This research was funded by China Railway 22TH Bureau Group 3RD Engineering Corporation Limited, grant number CR2203-S2-SX308-JS-2021-009; and funded by Shanghai Institute of Technology, grant number ZQ2021-28; and also funded by Shanghai Science and Technology Commission, grant number 2100240100.
Institutional Review Board Statement
Not applicable.
Informed Consent Statement
Not applicable.
Data Availability Statement
Not applicable.
Acknowledgments
Authors would like to acknowledge the finical support provided from China Railway 22TH Bureau Group 3RD Engineering Corporation Limited and Shanghai Urban Construction Design Research Institute (Group) Co., Ltd.
Conflicts of Interest
All authors declare no conflict of interest.
References
- Zhang, Q.; Alam, M.S. State-of-the-art review of seismic-resistant precast bridge columns. J. Bridge Eng. 2020, 25, 03120001. [Google Scholar] [CrossRef]
- Culmo, M.P.; Marsh, L.; Stanton, J. NCHRP Web-Only Document 242: Recommended AASHTO Guide Specifications for ABC Design and Construction; The National Academies Press: Washington, DC, USA, 2018. [Google Scholar]
- Wang, Z.; Qu, H.; Li, T.; Wei, H.; Wang, H.; Duan, H.; Jiang, H. Quasi-static cyclic tests of precast bridge columns with different connection details for high seismic zones. Eng. Struct. 2018, 158, 13–27. [Google Scholar] [CrossRef]
- Khaleghi, B.; Schultz, E.; Seguirant, S.; Marsh, L.; Haraldsson, O.; Eberhard, M.; Stanton, J. Accelerated bridge construction in Washington State: From research to practice. PCI J. 2012, 57, 34–49. [Google Scholar] [CrossRef]
- Han, Y.; Liu, Z.H.; Wang, L.L. Test for influence of socket connection structure on dynamic response of prefabricated pier under vehicle collision. KSCE J. Civ. Eng. 2022, 26, 1188–1202. [Google Scholar] [CrossRef]
- Zeng, Z.; Xu, Y.; Wang, Z.G. Experimental study of the axial bearing capacity of prefabricated pier-cap with socket connection. In Proceedings of the 9th Asia-Pacific Young Researchers and Graduates Symposium, Shanghai, China, 22–25 December 2019. [Google Scholar]
- Xu, Y.; Zeng, Z.; Wan, Z.G. Experimental studies of embedment length of precast bridge pier with socket connection to pile cap. Eng. Struct. 2021, 233, 111906. [Google Scholar] [CrossRef]
- Sadeghian, P.; Fam, A. Bond-slip analytical formulation toward optimal embedment of concrete-filled circular FRP tubes into concrete footings. J. Eng. Mech. 2010, 136, 524–533. [Google Scholar] [CrossRef]
- Kurama, Y.C.; Sritharan, S.; Fleischman, R.B.; Restrepo, J.I.; Henry, R.S.; Cleland, N.M.; Ghosh, S.K.; Bonelli, P. Seismic-resistant precast concrete structures: State of the art. J. Struct. Eng. 2018, 144, 03118001. [Google Scholar] [CrossRef] [Green Version]
- Azizinamini, A. Accelerated bridge construction. J. Bridge Eng. 2020, 25, 02020002. [Google Scholar] [CrossRef]
- Marsh, M.L.; Wernli, M.; Garrett, B.E. NCHRP Report 698: Application of Accelerated Bridge Construction Connections in Moderate-to-High Seismic Regions; The national Academies Press: Washington, DC, USA, 2011. [Google Scholar]
- Haraldsson, O.; Janes, T.; Eberhard, M.; Stanton, J. Seismic Resistance of Socket Connection between Footing and Precast Column. J. Bridge Eng. 2013, 18, 910–919. [Google Scholar] [CrossRef]
- Osanai, Y.; Watanabe, F.; Okamoto, S. Stress transfer mechanism of socket base connections with precast concrete columns. ACI Struct. J. 1996, 93, 266–276. [Google Scholar]
- Canha, R.M.F.; Borja Jaguaribe, K., Jr.; de Cresce EI Debs, A.L.H.; El Debs, M.K. Analysis of the behavior of transverse walls of socket base connections. Eng. Struct. 2009, 31, 788–798. [Google Scholar] [CrossRef]
- Mohebbi, A.; Saiidi, M.S.; Itani, A.M. Shake table studies and analysis of a precast two-column bent with advanced materials and pocket connections. J. Bridge Eng. 2018, 23, 04018046. [Google Scholar] [CrossRef]
- Mohebbi, A.; Saiidi, M.S.; Itani, A. Development and Seismic Evaluation of Pier Systems w/Pocket Connections, CFRP Tendons, and ECC/UHPC Columns; Center for Civil Engineering Earthquake Research, Department of Civil and Environmental Engineering, University of Nevada: Reno, Nevada, 2017. [Google Scholar]
- Wang, Z.Q.; Li, T.T.; Qu, H.Y.; Wei, H.; Li, Y. Seismic performance of precast bridge columns with socket and pocket connections based on quasi-static cyclic tests: Experimental and numerical study. J. Bridge Eng. 2019, 24, 04019105. [Google Scholar] [CrossRef]
- Cheng, Z.; Liu, D.; Li, S.; Wang, J.; Zhang, J. Performance characterization and design recommendations of socket connections for precast columns. Eng. Struct. 2021, 242, 112537. [Google Scholar] [CrossRef]
- Cheng, Z.; Sritharan, S. Outdoor test of a prefabricated column-pile cap-pile system under combined vertical and lateral loads. J. Bridge Eng. 2020, 25, 04020052. [Google Scholar] [CrossRef]
- Zhang, G.D.; Han, Q.; Xu, K.; Du, X.; He, W. Experimental investigation of seismic behavior of UHPC-filled socket precast bridge column-foundation connection with shear keys. Eng. Struct. 2021, 228, 111527. [Google Scholar] [CrossRef]
- Chan, T.K.; Poh, C.K. Behaviour of precast reinforced concrete pile caps. Constr. Build. Mater. 2000, 14, 73–78. [Google Scholar] [CrossRef]
- Cheng, Z.; Sritharan, S. Side shear strength of preformed socket connections suitable for vertical precast members. J. Bridge Eng. 2019, 24, 04019025. [Google Scholar] [CrossRef]
- AASHTO GSCB INTERIM-2003. Guide Specifications for Design and Construction of Segmental Concrete Bridges (Revision 2); American Association of State Highway Transportation Officials: Washington, DC, USA, 1999. [Google Scholar]
- Lai, L. Analysis on Mechanicl Charteristics of Improved Socket Type Bridge Pier and Caps; Shanghai Institute of Technology, Academic Degree of Master of Engineering: Shanghai, China, 2022. [Google Scholar]
- Li, J. Shear Behavior and Continuous Rigid-Frame System of Precast Segmental Bridges in the Fourth Nanjing Yangtze River Bridge; Southeast University, Academic Degree of Master of Engineering: Nanjin, China, 2010. [Google Scholar]
Figure 1.
Traditional socket type.

Figure 2.
Improved socket type.

Figure 3.
Concrete pier and column structure.

Figure 4.
Reinforcement diagram of the full-scale bridge pier. (a) Pier section; (b) cap reinforcement.
Figure 4.
Reinforcement diagram of the full-scale bridge pier. (a) Pier section; (b) cap reinforcement.

Figure 5.
Diameter distribution diagram of the bottom.

Figure 6.
Structure diagram of the scaled pier.

Figure 7.
The model construction process. (a) Bridge pier reinforcement cage; (b) pier shear key; (c) cap steel cage; (d) model test piece.
Figure 7.
The model construction process. (a) Bridge pier reinforcement cage; (b) pier shear key; (c) cap steel cage; (d) model test piece.


Figure 8.
Loading device. (a) Loading schematic; (b) loading photo.

Figure 9.
Top pier concrete spalling area of specimen S7.

Figure 10.
The distribution of cracks on the bottom and side of the cap.

Figure 11.
Vertical load–displacement relationship of S7 specimen under different eccentricity.

Figure 12.
Finite element model of the improved socket connection. (a) Precast member; (b) sectional view of the model.
Figure 12.
Finite element model of the improved socket connection. (a) Precast member; (b) sectional view of the model.

Figure 13.
Comparison of the vertical bearing capacity.

Figure 14.
Diagrams of different structural models. (a) Shear key only; (b) bottom plate; (c) bottom plate + shear key.
Figure 14.
Diagrams of different structural models. (a) Shear key only; (b) bottom plate; (c) bottom plate + shear key.

Figure 15.
The contribution of different configuration measures.

Figure 16.
Comparison of different reinforcement ratios.

Figure 17.
The influence of socket depth.

Figure 18.
Comparison of different base plate thicknesses.

Figure 19.
Comparison of the vertical bearing capacity between cast-in-situ and precast bottom plates.
Figure 19.
Comparison of the vertical bearing capacity between cast-in-situ and precast bottom plates.

Figure 20.
Comparison of different pile lengths.

Figure 21.
Comparison of different friction coefficients.

Figure 22.
Displacement–load comparison diagram of full-scale socket connection.

Figure 23.
Summary of the M−N diagram. (a) Bottom plate thickness is 0.5 m; (b) bottom plate thickness is 0.8 m.
Figure 23.
Summary of the M−N diagram. (a) Bottom plate thickness is 0.5 m; (b) bottom plate thickness is 0.8 m.

Figure 24.
Comparison of different base plate thicknesses.

Figure 25.
Components of vertical bearing capacity. (a) Bottom plate bending; (b) side wall shear key; (c) hanging bar suspension.
Figure 25.
Components of vertical bearing capacity. (a) Bottom plate bending; (b) side wall shear key; (c) hanging bar suspension.


Table 1.
Proposed solution of the assembly scheme.
| Position | Assembly Method | Reason |
|---|---|---|
| Bridge piers and caps | Socket type or grout sleeve | The construction requirements are the highest in the unfavorable stress parts such as compression, bending, shear, and torsion, so the pier and cushion cap must be rigidly connected |
| Bridge piers and bent cap | Sleeve or Bellows | It has strong adaptability to construction defects, and the defective structure will not collapse because the connection between the pier and the bent cap can be rigid, semi-rigid, or even hinged |
| Piers and piers | Sleeve | Meet shear and compression requirements |
| Bent caps and caps | Prestressed | There is prestress in the bent cap, and the prestressed type can make full use of the original advantages |
Table 2.
Specimen description.
| Specimen | Pouring Method | Platform Height/mm | Socket Depth/D | Connection Method | Bottom Plate Thickness/mm |
|---|---|---|---|---|---|
| S1 | cast-in-place | 750 | none | ||
| S2 | prefabricated components | 750 | 0.7 | shear key | 250 |
| S7 | 750 | 0.7 | shear key | 0 | |
Table 3.
Material properties of the structural model.
| Name | Material Grade | Young’s Modulus | Yield Stress | Tensile Stress | Plastic Strain |
|---|---|---|---|---|---|
| /GPa | /MPa | /MPa | |||
| Concrete | C40 | 32.5 | none | ||
| C70 | 39.2 | ||||
| Steel | HRB300 | 200 | 300 | 450 | 0.09 |
| HRB400 | 200 | 400 | 540 | 0.09 | |
Table 4.
Contribution rate of different structures.
| U-Shaped Rebar | Shear Key | Bottom Plate | Sum | |
|---|---|---|---|---|
| Peak load/kN | 2446 | 3859 | 3238 | 9543 |
| Proportion | 26% | 40% | 34% | 100% |
Table 5.
Summary of the vertical bearing capacity (kN).
| Type of Cap | Full-Scale | Reduced Scale1:2 |
|---|---|---|
| Cast-in-place cap | 39,534 | 9752 |
| Precast cap | 28,673 | 7456 |
Table 6.
Summary of calculation results.
| Calculation Formula | Bottom Plate Thickness/mm | Design Formula Calculated Value/kN | Finite Element Simulation Value/kN (Cracking Load) | Safety Multiple |
|---|---|---|---|---|
| Specification for Design of Concrete Structures of the scaled model | 150 | 678 | 2860 | 1.26–4.22 |
| 200 | 971 | 2976 | ||
| 250 | 1265 | 3163 | ||
| 350 | 1855 | 3054 | ||
| 450 | 2453 | 3091 | ||
| Design formula of scaled model | 150 | 1809 | 2860 | 1.33–1.6 |
| 200 | 1894 | 2976 | ||
| 250 | 1979 | 3163 | ||
| 350 | 2149 | 3054 | ||
| 450 | 2322 | 3091 | ||
| Full-scale model Design formula | 500 | 7026 | 7962 | 1.13 |
Publisher’s Note: MDPI stays neutral with regard to jurisdictional claims in published maps and institutional affiliations. |
© 2022 by the authors. Licensee MDPI, Basel, Switzerland. This article is an open access article distributed under the terms and conditions of the Creative Commons Attribution (CC BY) license (https://creativecommons.org/licenses/by/4.0/).
Share and Cite
MDPI and ACS Style
Ge, J.; Lai, L.; Liu, S.; Yan, X. Ultimate Bearing Capacity Analysis of Pile Caps with New Socket Connections. Buildings 2022, 12, 2034. https://doi.org/10.3390/buildings12112034
AMA Style
Ge J, Lai L, Liu S, Yan X. Ultimate Bearing Capacity Analysis of Pile Caps with New Socket Connections. Buildings. 2022; 12(11):2034. https://doi.org/10.3390/buildings12112034
Chicago/Turabian StyleGe, Jiping, Luqi Lai, Side Liu, and Xingfei Yan. 2022. "Ultimate Bearing Capacity Analysis of Pile Caps with New Socket Connections" Buildings 12, no. 11: 2034. https://doi.org/10.3390/buildings12112034
Note that from the first issue of 2016, this journal uses article numbers instead of page numbers. See further details here.