Article

Seasonal Controls of Seawater CO2 Systems in Subtropical Coral Reefs: A Case Study from the Eastern Coast of Shenzhen, China

1
Shenzhen International Graduate School, Tsinghua University, Shenzhen 518055, China
2
Shenzhen Research Institute, Guangdong Ocean University, Binhai 2 Road, Shenzhen 518120, China
3
College of Fisheries, Guangdong Ocean University, Zhanjiang 524088, China
4
College of Food Science and Technology, Guangdong Ocean University, Zhanjiang 524088, China
*
Authors to whom correspondence should be addressed.
Water 2023, 15(23), 4124; https://doi.org/10.3390/w15234124
Submission received: 6 November 2023 / Revised: 22 November 2023 / Accepted: 26 November 2023 / Published: 28 November 2023
(This article belongs to the Section Water and Climate Change)

Abstract

:
In situ field investigations coupled with coral culture experiments were carried out in the coral reef waters of the eastern coast of Shenzhen, Da’ao Bay (DAB), Dalu Bay (DLB), and Yangmeikeng Sea Area (YMKSA) to study the dynamics of the carbon dioxide (CO2) system in seawater and its controlling factors. The results indicated that the CO2 parameters were highly variable over a range of spatiotemporal scales, forced by various physical and biochemical processes. Comprehensively, DAB acted as a sink for atmospheric CO2 with exchange flux of –1.51 ± 0.31 to 0.27 ± 0.50 mmol C m−2 d−1, while DLB and YMKSA acted as a CO2 source with exchange fluxes of –0.42 ± 0.36 to 1.69 ± 0.74 mmol C m−2 d−1 and –0.58 ± 0.48 to 1.69 ± 0.41 mmol C m−2 d−1, respectively. The biological process and mixing effect could be the most important factor for the seasonal variation in total alkalinity (TA). In terms of dissolved inorganic carbon (DIC), in addition to biological process and mixing, its seasonal variation was affected by air–sea exchange and coral metabolism to some extent. Different from the former, the other CO2 parameters, total scale pH (pHT), partial pressure of CO2 (pCO2), and aragonite saturation state (ΩA), were mainly controlled by a combination of the temperature change, biochemical processes, air–sea exchange, and coral metabolism, while water mixing has little effect on them. In addition, our results indicated that coral communities could significantly increase the DIC/TA ratio by reducing the TA concentration and increasing the DIC in the reef waters, which may promote the acidification of local seawater and need attention.

1. Introduction

Affected by human activities and global changes, the concentration of carbon dioxide (CO2) in the atmosphere increased from 280 ppm before the Industrial Revolution to 420 ppm in 2023 [1]. If it continues to grow at this rate, atmospheric CO2 concentrations are expected to double by the end of the 21st century, which will pose a serious threat to normal human activity [1]. How to effectively alleviate and control the continuous increase in atmospheric CO2 is a major issue of concern for scientists and the relevant authorities.
The ocean accounts for 70% of the global surface area and can absorb about 30% of the CO2 emitted by humans each year, so it plays an important role in adjusting the atmospheric CO2 concentration [2]. However, this capture of atmospheric CO2 significantly affects the chemical properties of the marine CO2 system, and the result is a phenomenon called ocean acidification (OA) [3]. The consequence of OA is an increase in the partial pressure of seawater CO2 (pCO2) and a reduction in the pH, aragonite saturation state (ΩA), and CO2 buffering capacity by increasing the dissolved inorganic carbon (DIC) and hydrogen ion concentration in seawater [4], which has been found to potential impacts on marine calcifiers, e.g., hermatypic corals and calcifying algae [5,6,7,8,9,10].
In general, the dynamics of CO2 systems in the ocean are mainly controlled by biogeochemical processes, e.g., photosynthesis, respiration and calcification, and temperature changes [11,12,13]. For instance, the photosynthesis of phytoplankton can absorb CO2 from the atmosphere, thereby reducing the DIC concentration in seawater, while biological respiration and calcification processes can release CO2 into the water column and increase the DIC concentration in seawater. Furthermore, temperature changes can significantly affect the dynamic of the CO2 system through thermodynamic effects and the regulation of biological metabolic activities, such as photosynthesis and respiration [14,15]. In recent years, many studies have confirmed the dominant role that temperature changes play in the CO2 system in seawater, especially regarding the control of pH and pCO2 [16,17].
Compared with the ocean, the geochemical behavior of the CO2 system in coastal water is more complex [18,19]. In addition to the impact of climate change, the dynamic of the coastal CO2 system is also significantly affected by terrestrial input (such as nutrients and organic matter) and human activities, resulting in large spatial and seasonal variations in the carbonate system [20,21,22]. For example, previous studies have shown a potential link between eutrophication and OA, e.g., the North Yellow Sea [23] and Northern South China Sea [24]. This is because excess nutrient input can promote the reproduction of phytoplankton and subsequent aerobic decomposition of algae-derived organic matter in the water column, which may be the main reason for OA [25]. Thus, coastal OA and hypoxia usually occur simultaneously [26].
In addition, the focus on coastal coral reef habitats, the metabolic activities of corals, and reef organisms may also have an important effect on the seawater CO2 system because of the formation of biological calcium carbonate and respiration [27,28]. Generally, coral calcification absorbs total alkalinity (TA) and DIC at a ratio of 2:1 from seawater, resulting in an increase in the pCO2 and a decrease in the pH and ΩA of the seawater, and vice versa [29]. Although extensive studies have been carried out, the dynamics and driving factors of the CO2 system are currently uncertain and vary between different reefs, because the above processes are affected by the superposition of various factors, such as the coral and reef species, temperature, salinity, and dissolved oxygen (DO) [9,30,31]. Hence, there is a need to understand when and where the seawater CO2 system will reach certain conditions within different coral reef habitats, as well as the specific mechanisms leading to these conditions.
The eastern coast of Shenzhen (ECSZ) is a typical subtropical coral habitat in the South China Sea. In recent years, the coral reef system in this region has undergone significant degradation due to global warming and coastal human activities, such as aquaculture activities, port construction, and coastal tourism activities. Previous studies have shown that corals covering in the ECSZ and adjacent Daya Bay declined from an average of >70% in the 1980s to below 30% after 2000 [32,33]. OA is likely to be a potentially important cause of coral reef degradation. Therefore, it is necessary to accurately evaluate the mechanism of OA by understanding the dynamics of the seawater CO2 system in detail. However, it remains tremendously challenging to make satisfactory progress towards this goal. For that, the biogeochemical process of the seawater CO2 system (TA, DIC, pCO2, ΩA, and pH) in the ECSZ, including Da’ao Bay (DAB), Dalu Bay (DLB), and the Yangmeikeng sea area (YMKSA), were investigated through a field investigation and indoor culture experiments of coral metabolism in November 2022 (autumn), February 2023 (winter), May 2023 (spring), and August 2023 (summer). The main purpose of this study was to (1) determine the spatiotemporal variations in the seawater CO2 system and its main control processes in subtropical coral reefs; and (2) quantify the contribution of each process (temperature change, water mixing, air–sea exchange of CO2, coral metabolism, and other biological processes) to the seasonal variation in the CO2 system.

2. Materials and Methods

2.1. Study Area

The ECSZ, located in the northern part of the South China Sea, is dominated by typical subtropical monsoons, with an annual rainfall of 1900–2214 mm. Affected by the monsoons, there are obvious dry and wet seasons in the survey area. The dry season is from November to March of the following year, and the wet season (accounts for 90% of the annual rainfall) is from April to October. The water depths in most areas are <15 m, averaging around 10 m (Figure 1). The tide in the study area is an irregular, semi-diurnal tide, with the highest tide level being 1.72 m and the lowest tide level being −0.58 m. There are no large rivers flowing into the sea along the coast, only a stream (Yangmei River, YMR) discharging into YMKSA (Figure 1). Thus, terrestrial materials such as nutrients and organic matter from inland are mainly transported to the study area through tidal action, coastal currents, and groundwater, rather than runoff input.
In addition, fringing coral reefs develop in the study area, and the coral community is dominated by Acropora pruinose (A. pruinose), Porites lutea (P. lutea), Favia favus (F. favus), Acropora digitifera (A. digitifera), and Platygyra carnosus (P. carnosus), respectively. The coral coverage is generally low and patchy, varying annually between 25 and 40% (mean, 35%). In this study, we selected three contrasting coral reefs around the Dapeng Peninsula coastline, i.e., DAB, DLB, and YMKSA, with the reef areas of 19.3, 6.3, and 92.6 hectares, for investigation (Figure 1). Among them, DAB and YMKSA are significantly affected by human activities, e.g., coastal tourism activities, harbor construction, and nuclear power plants [34,35]. In comparison, DLB (located on the southern edge of the Dapeng Peninsula) is less affected by human activities, and the hydrodynamic conditions there are strong due to the influence of the coastal current, especially in the autumn and winter.

2.2. Sampling and Analyses

Four cruises were conducted in the DAB, DLB, and YMKSA in November 2022 (autumn), February 2023 (winter), May 2023 (spring), and August 2023 (summer), respectively. A total of 51 stations were set up in the study area, and the same station positions were visited each season, where both surface and bottom water samples were collected using a Niskin sampler. At the same time, we collected the dominant coral species and brought them back to the laboratory for culture experiments to explore the effects of coral metabolism on seawater carbonate in different seasons.
Temperature, salinity, DO, and chlorophyll a (Chl a) were measured in the field by a YSI EXO2 multiparameter (YSI company, Yellow Springs, OH, USA), and the corresponding precisions were ±0.01 °C, ±0.01, ±0.1 μmol L−1, and ±0.01 μg L−1, respectively. The preservation and determination of carbonate samples were carried out according to the ‘Guide to Best Practices for Ocean CO2 Measurements’ [36]. Briefly, the total scale pH (pHT) was measured using a pH meter (Thermo Electron Co., Waltham, MA, USA), against 2-amino-2-hydroxy-1,3-propanediol as the pHT buffer, at a precision of ±0.01 pH unit. The TA was determined by a METTLER TOLEDO Easyplus Titration device (ET18, Zürich, Switzerland) with the precision of ±3 µmol kg−1.
The remaining other CO2 parameters were calculated using the CO2SYS program [26,37]. Specifically, the DIC was calculated from the data of TA, pHT, temperature, and salinity. In order to further verify the reliability of the calculated data, some seawater samples (n = 30) were selected during the investigation period to measure the DIC concentration (DICMea), using the Apollo SciTech DIC analyzer (AS-C3, Apollo SciTech Inc., Newark, DE, USA; precision of ±2 µmol kg−1), and compared with the calculated DIC (DICCal). The results showed that the calculated results were basically consistent with the measured results of the DIC (<10 μmol L−1; Supplementary Figure S1), indicating that the calculated DIC data in this study were reliable. In addition, the pCO2 and ΩA at in situ (pCO2@in situ, and ΩA@in situ) and average temperature of 24.8 °C (pCO[email protected]°C and Ω[email protected]°C) were calculated from TA, DIC, temperature, and salinity, using CO2SYS program.

2.3. Incubation Experiments of Coral Metabolism

During the survey period of each season, the dominant species of coral (A. pruinose, P. lutea, F. favus, A. digitifera, and P. carnosus) were collected in the study area and immediately transported to the running-seawater aquarium facilities. After an acclimatization period of 10 days, the scleractinian corals were used for the incubation experiment. Specifically, the target corals were transferred to incubators containing 8 L of filtered seawater (experimental group). In addition, one incubator with only filtered seawater was selected as the control group. Three parallel experiments were set up in each group. All incubators were sealed and cultured without headspace for 48 h (with 12 h light–12 h dark cycle). The temperature (24, 18, 25, and 30 °C in four seasons) and light conditions (110, 105, 115, and 110 μmol m−2 s−1) of the incubation experiments were consistent with the site conditions to the maximum extent. The salinity of the seawater in the four culture experiments was 32.6 (autumn), 32.6 (winter), 33.0 (spring), and 32.3 (summer), respectively. Furthermore, the initial content of DO in all culture experiments was 250 μmol L−1. The TA and DIC concentration in the seawaters were determined at 0, 24, and 48 h during the experiments. The release fluxes (RFs) of the TA and DIC by coral metabolism in different seasons were calculated as follows:
RF (i) = (kik0) × 24 × V × ρ/S
where i is the TA or DIC; ki and k0 are the linear regression slopes of TA or DIC (μmol kg−1) vs. time (h) in the experimental sample and control groups, respectively; V (L) is the experimental seawater volume; ρ (kg m−3) is the density of seawater; and S (cm−2) is the surface area of the experimental coral and was obtained via the aluminum foil method [38].

2.4. Estimation of CO2 Fluxes

The air–sea flux of CO2, FCO2 (mmol m−2 d−1), was obtained by the difference between the partial pressure of CO2 on the sea surface (pCO2S) and atmosphere (pCO2A):
FCO2 = k × K0 × (pCO2SpCO2A)
where K0 and k (cm h−1) are the solubility coefficient and gas transfer velocity of CO2, respectively. In this study, 417.4 µatm (November 2022), 420.3 µatm (February 2023), 424.0 µatm (May 2023), and 419.7 µatm (August 2023) (ftp://aftp.cmdl.noaa.gov/products/trends/co2/co2_annmean_gl.txt, accessed on 10 September 2023) [1] were used as pCO2A. Moreover, k was obtained according to the revised equation of Wanninkhof [39] in Sweeney et al. [40] as follows:
k = 0.27 × u102 × (Sc/660)−0.5
where Sc is the Schmidt number [39], and u10 is the wind speed at a height of 10 m height (monthly averaged wind speed there), as obtained from the South China Sea and Adjacent Seas Data Center [41].

2.5. Budget Model to Distinguish Controlling Processes of CO2 System

Based on the mass budget model proposed by Xue et al. [42,43], the contribution of each process (temperature change, water mixing, air–sea exchange of CO2, coral metabolism, and other biological processes) to the seasonal net variation in the seawater CO2 system was calculated. The specific calculation process is shown in Supplementary Material Section S1.1.

2.6. Statistical Analysis

Seasonal and spatial differences (between the DAB, DLB and YMKSA) in biogeochemical characteristics were analyzed using a one–way analysis of variance test (ANOVA) with SPSS Statistics software (version 22). The threshold value for statistical significance was taken as p < 0.05.

3. Results

3.1. Hydrological Features

Figure 2 shows the seasonal variation characteristics, namely seawater temperature, salinity, DO, and Chl a content, of the study areas (DAB, DLB, and YMKSA) for the four periods surveyed. Temperature presented a large seasonal variation, with the lowest value of 18.0 ± 0.1 °C (mean ± SD) in February 2023 (winter) and maximum value of 34.5 °C in August 2023 (summer) (Figure 2a). Regionally, there was no significant difference between DAB, DLB, and YMKSA (p > 0.05). As for salinity, its values varied from 31.8 ± 0.8 to 33.1 ± 0.1 and exhibited small fluctuations (Figure 2b). Significant differences in salinity between DAB, DLB, and YMKSA were observed during most of the survey periods (p < 0.05). Spatially, the horizontal distribution of temperature and salinity in the DAB, DLB, and YMKSA was not obvious in the dry season (Supplementary Figures S2–S4). In contrast, temperature (salinity) showed a significant gradient decrease (increase) from the nearshore to offshore areas in the rainy season, especially in August 2023 (Supplementary Figures S1–S4), thus indicating the input of terrestrial fresh water.
During the study period, the DO ranged from 92.4 ± 25.6 μmol L−1 to 287.2 ± 11.4 μmol L−1 (Figure 1), with the AOU values from 120.1 ± 25.9 μmol kg−1 to −62.3 ± 11.1 μmol kg−1. From November 2022 to August 2023, the DO in seawater decreased gradually (Figure 2c). In the summertime (August 2023), the bottom DO of the study area, especially in the DAB, was located at the edge of low oxygen, i.e., 93.8 μmol L−1 [44], which posed a potential threat to the normal metabolism of benthic organisms. As can be seen in Supplementary Figure S5, there was no statistically significant difference between the sites in DO in the DAB; however, its values in the DLB increased from the nearshore area to the offshore area, except for in November 2022 (Supplementary Figure S6). In the YMKSA, there was no statistically significant difference in DO among the sites in the dry season (November and February), while the DO increased from the nearshore zone to the offshore area in May 2023, which was opposite to the distribution of surface DO in August 2023. Furthermore, it is worth noting that the relatively low DO concentrations in August 2023 appeared right in the coral reef area, especially in the YMKSA, indicating a higher biological oxygen consumption process in the reef area.
The surface Chl a exhibited a marked variation, 0.46 ± 0.23 μg L−1 to 9.45 ± 3.44 μg L−1, with the highest (May 2023) and lowest values (February 2023) all observed in the YMKSA (Figure 2d). The seasonal variations in Chl a in the DAB, DLB, and YMKSA were different. For instance, the Chl a in the DLB gradually increased from November 2022 to August 2023, while its highest values in the DAB and YMKSA were all observed in May 2023 (Figure 2d). Spatially, the Chl a was generally higher in the nearshore zone than it was in the offshore zone in the DAB, DLB, and YMKSA in May 2023, which was opposite to the distribution in other seasons (Supplementary Figures S5–S7). In addition, the Chl a was >10 μg L−1 in most of the coastal stations in May 2023 of the YMKSA, indicting the occurrence of a bloom [42].

3.2. Spatiotemporal Variations in Marine CO2 System

3.2.1. TA and DIC

The concentration of TA and DIC in the study areas (DAB, DLB, and YMKSA) varied considerably among the seasons (p < 0.05). As shown in Figure 3, the highest TA and DIC values, 2225.3 ± 5.9 µmol kg−1 and 2008.1 ± 9.6 µmol kg−1, respectively, were all recorded in February 2023 for the DLB, while the lowest values of 2160.0 ± 39.1 µmol kg−1 and 1984.8 ± 88.8 µmol kg−1, respectively, were all found in August 2023 for the YMKSA (Figure 3a,b). There were significant differences (p < 0.05) in the concentrations of TA and DIC between different regions (DAB, DLB, and YMKSA) during the survey periods, except for in May 2023. For instance, the values of TA and surface DIC in the YMKSA were significantly lower than those in the DAB and DLB, especially in August 2023 (Figure 3a,b).
Spatially, during the autumn survey, the relatively low TA values were mainly distributed in the nearshore area of the DAB, which contrasted with the distribution of DIC. In other seasons, the spatial distribution of TA and DIC was not obvious; it was mainly has a patchy distribution (Supplementary Figure S8). In the DLB, the TA and DIC showed an increasing trend from the nearshore area to the offshore area in November 2022 and May 2023 (except for individual cases), while it was the reverse situation in August 2023; however, the TA and DIC showed a patchy distribution in February 2023 (Supplementary Figure S9). Similarly, the lower TA values mainly appeared in the inshore place in November 2022, May 2023, and August 2023 of YMKSA, which was contrary to the distribution pattern in February 2023 (Supplementary Figure S10). In terms of the DIC, its distributions in the surface water were higher in the nearshore zone than they were in the offshore zone, except in November 2022 (Supplementary Figure S10). On the contrary, the bottom DIC values in the inshore place were significantly lower than they were in the offshore zone in May 2023 and August 2023; meanwhile, no obvious distribution was found in other seasons (Supplementary Figure S10).

3.2.2. pHT@in situ and ΩA@in situ

As shown in Figure 3c, the average pHT@in situ values of the DAB, DLB, and YMKSA sites exhibited clear seasonal variations, with the highest value, 8.19 ± 0.02, being observed in the surface water in February 2023 of the DLB and the lowest value, 7.95 ± 0.12, being observed in the bottom water in August 2023 of the YMKSA, which was opposite to the change in DIC (Figure 3). For different areas, the bottom pHT@in situ of the YMKSA was significantly lower than that of the DAB and DLB in February 2022, May 2023, and August 2023 (p < 0.05). Contrary to the DIC, the bottom pHT@in situ was generally lower than that of the surface water (p < 0.05); a difference of up to 0.22 pH units in the YMKSA occurred in August 2023 (Figure 3c).
The ΩA@in situ values ranged from 2.14 ± 0.55 to 3.62 ± 0.16, with the highest and lowest values all observed in August 2023 for the DAB (surface water) and YMKSA (bottom water) (Figure 3c). Regionally, the bottom ΩA@in situ in the YMKSA was generally lower than that in the DAB and DLB, especially in August 2023 (Figure 3c). Similarly, the ΩA@in situ value for the bottom water was significantly lower than that for the surface water; a difference up to 1.21 Ω occurred in August 2023 in the YMKSA (Figure 2c).
The spatial distributions of pHT@in situ and ΩA@in situ are shown in Supplementary Figures S8–S13. During the investigation period, the lower values of pHT@in situ and ΩA@in situ were mainly distributed in the nearshore areas of the DAB, DLB, and YMKSA. In addition, during the survey period of November 2022 and August 2023, we clearly found that the values of pHT@in situ and ΩA@in situ in the coral reef area were significantly lower than those outside the reef area, especially in the bottom water (except for individual), thus indicating a potential link between coral reefs and OA to a certain extent. Similar results have been found in other coral reef areas, e.g., Dongsha Atoll (northern South China Sea) [45]. In addition, previous studies have shown that marine calcified organisms require the ΩA value to be >1.5 for optimal growth [19]. Thus, ~40% of the YMKSA in the bottom water may not be suitable for the growth of calcified organisms.

3.2.3. pCO2@in situ and FCO2

In the surface water, the mean pCO2@in situ values of the study area varied from 294.1 ± 30.1 µatm to 519.9 ± 45.0 µatm; its spatiotemporal variation was opposite to that of pHT@in situ and ΩA@in situ (Figure 3). The corresponding values of FCO2, shown in Supplementary Figure S14, varied from –1.69 ± 0.41 mmol C m−2 d−1 to 1.70 ± 0.74 mmol C m−2 d−1. The DAB could absorb CO2 from the atmosphere in November 2022, February 2023, and August 2023, with absorption fluxes of 1.51 ± 0.31 mmol C m−2 d−1, 0.48 ± 0.28 mmol C m−2 d−1, and 0.23 ± 0.99 mmol C m−2 d−1, respectively. However, during the survey of May 2023, DAB was a source of CO2, with an average release flux of 0.27 ± 0.50 mmol C m−2 d−1. As for DLB, this region was a sink of CO2 in November 2022 (−1.03 ± 0.08 mmol C m−2 d−1) and February 2023 (−0.49 ± 0.31 mmol C m−2 d−1), but it was a source of CO2 in May 2022 (0.42 ± 0.36 mmol C m−2 d−1) and August 2023 (1.69 ± 0.74 mmol C m−2 d−1). However, the YMKSA was a source of CO2 in February 2023 (0.29 ± 0.17 mmol C m−2 d−1) and May 2023 (0.58 ± 0.48 mmol C m−2 d−1) but a sink of CO2 in November 2022 (−1.69 ± 0.41 mmol C m−2 d−1) and August 2023 (−0.21 ± 1.00 mmol C m−2 d−1) (Supplementary Figure S14).
As for the bottom pCO2@in situ, its values ranged from 313.6 ± 25.9 µatm in November 2022 (DAB) to 767.6 ± 218.7 µatm in August 2023 (YMKSA). As shown in Figure 3d, the values for the bottom pCO2@in situ in the DAB, DLB and YMKSA were significantly higher than those in the surface water in August 2023 (up to 360 µatm), which may significantly promote the source properties of CO2 in the survey area, especially when the hydrodynamic conditions are strong [26]. As shown in Supplementary Figures S11–S13, the spatial distributions of pCO2@in situ in the bottom water were opposite to those of the pHT@in situ and ΩA@in situ during the investigation period.

3.3. Coral Metabolic Process

During the culture experiment period, all the target corals did not show bleaching or death, and they were well adapted to the indoor system environment. The release/absorption fluxes of TA and DIC by dominant corals in the study area (i.e., A. pruinose, P. lutea, F. favus, A. digitifera, and P. carnosus) were obtained via indoor culture experiments. The results showed that the daily fluxes of TA absorbed by corals ranged from 0.06 ± 0.01 μmol cm−2 to 0.77 ± 0.19 μmol cm−2 during the investigation period, with the highest and lowest values occurring in F. favus (August 2023) and P. lutea (May 2023), respectively (Figure 4a). In addition, the daily flux of the DIC released by corals ranged from 2.08 ± 0.61 μmol cm−2 in May 2023 (A. digitifera) to 10.86 ± 12.46 μmol cm−2 in November 2022 (A. digitifera).
Compared with other studies, the TA absorption flux by corals in this study was almost the same as that of Favites complanata (F. complanata) (0.38 ± 1.26 μmol cm−2) by Guo et al. [46], but it was significantly lower than that of the A. digitifera (27.12 ± 2.33 μmol cm−2), Acropora formosa (A. formosa) (16.60 ± 0.70 μmol cm−2), and Siderastrea siderea (S. siderea) (54.0 μmol cm−2) by Kuffner et al. [47], Nishida et al. [48], and Chan et al. [49]. In addition, the DIC release flux of corals in this study was significantly higher than that of the Galaxea fascicularis (G. fascicularis) (0.53 μmol cm−2) and slightly lower than that of Acropora hyacinthus (A. hyacinthus) 13.82 μmol cm−2 by Zhao et al. [50]. In fact, due to differences in the metabolism of corals under indoor and outdoor conditions, the calculated DIC release (and TA absorption) results may deviate from the actual situation, but this does not fundamentally affect its applicability in this study.

4. Discussion

4.1. Comparison of CO2 Parameters with Other Reefs around the World

Table 1 shows the concentration characteristics of seawater CO2 parameters (TA, DIC, pHT, pCO2, and ΩA) in the ECSZ (DAB, DLB, and YMKSA) and other coral reef areas in the world. In comparison, the results of CO2 parameters in the study area were comparable to those of most other reefs listed in Table 1. For instance, the TA concentration there was comparable to that in the Coral Reef Lagoon Kaneohe Bay [51], coast of Iriomote Island [52], and Dongshan coral habitat [31], but it was significantly lower than that in the Pedra da Risca do Meio Coral Reef [30], Luhuitou fringing reef [53], and Yongxing Island [54]. As for the DIC, its concentration was comparable to that in the Great Barrier Reef [55], Big Vicki’s Reef [56], Palfrey Reef [56], Coral Reef Lagoon Kaneohe Bay [51], and Dongshan coral habitat [31], but it was significantly higher than that in the reef flat in Northeastern Brazil [52]. For other CO2 parameters, e.g., pHT, pCO2, and ΩA, their values were also comparable to most of the coral reef areas listed in Table 1. In addition, as mentioned above, the seawater CO2 parameters in the ECSZ showed obvious seasonal variations and regional differences (DAB, DLB, and YMKSA), which were comprehensively forced by the physical and biogeochemical processes, such as temperature changes, water mixing, air–sea exchange, and biological metabolism, which are described in the following sections.

4.2. Factors Controlling the Variability of Seawater CO2 Parameters

4.2.1. Temperature

Temperature is usually an important factor affecting the carbonate system in seawater. On the one hand, a temperature change can affect the solubility of CO2 in seawater and the dissociation equilibrium of carbonate; that is, the solubility of CO2 decreases with the increase in temperature. On the other hand, temperature can affect the metabolic activities of organisms, thereby regulating the inorganic carbon dynamic in seawater [17,60]). As can be seen in Figure 5, unlike for the surface pHT and bottom ΩA, temperature showed a significant linear relationship with pHT, pCO2, and ΩA, with all data considered (n = 192), confirming the dominant role of seasonal changes in temperature on these CO2 parameters (especially the pHT and pCO2). Similar results have been found in other survey sites, such as the Patos Lagoon [61], Gulf of Mexico [62], Aransas Ship Channel [63], East China Sea [64], Northern South China Sea [65], and Pearl River Estuary [66]. Furthermore, based on the above linear relationship (i.e., temperature vs. CO2 parameters), the seasonal variation in temperature, i.e., 17.9–34.5 °C, can be estimated to explain 11.6% (43.4%), 17.9% (44.4%), and 55.6% (3.3%) of the changes in pHT, pCO2, and ΩA of the surface (bottom) waters. Thus, temperature was an important factor controlling the seasonal variation in these CO2 parameters.
For different regions (DAB, DLB, and YMKSA), the response of the CO2 systems to seasonal temperature changes was different (Figure 5), which may be caused by the enhancement or canceling out of physical processes and biological processes [63]. As shown in Figure 5, temperature was significantly correlated with pHT, pCO2, and surface ΩA (p < 0.001) in the DLB, and temperature changes can reveal 49.1–72.5% variations in those CO2 parameters, suggesting the important control role of temperature. Different from that, there was no significant correlation between temperature and most CO2 parameters in the DAB and YMKSA (many results deviate from their overall trajectory); temperature only showed a significant correlation with the bottom pHT and pCO2 and the surface ΩA (p < 0.001 or p < 0.05), but the significance was relatively weak, especially in the YMKSA (p < 0.05), indicating the control effect of other factors besides temperature, e.g., biological processes and air–sea exchange of CO2 [67].

4.2.2. Water Mixing

The water-mixing process can alter the concentration of TA and DIC in seawater, in turn, affecting the geochemical behavior of the CO2 system [61,68,69]. Since salinity changes can effectively indicate the mixing process of different waters, the effect of water mixing on the carbonate system can be quantitatively (semi-quantitatively) revealed by fitting the relationship between the salinity and CO2 parameters. As shown in Figure 6, taking all the data into account (n = 192), salinity showed a significant positive correlation with the surface TA (y = 44.6x + 724, p < 0.001, Figure 6a), surface DIC (y = 80.5x − 713.2 724, p < 0.001, Figure 6c), and bottom DIC (y = 33.4x + 858.0, p < 0.01, Figure 6c), indicating the significant effects of water mixing (dilution effect). According to the linear relationship between them, it can be estimated that the salinity changes in the surface (29.6–33.5) and bottom water (28.8–33.8) can explain 47.9%, 86.5%, and 58.1% of the changes in the surface TA, surface DIC, and surface DIC, respectively. However, no significant correlation between salinity and TA was observed in the bottom water, which may be related to biological calcification in the study area [27]. As mentioned above, the bottom TA concentration in the reef area was significantly higher than that in the outer area of the reef area, especially in the YMKSA (Supplementary Figure S10), thus indicating the significant effect of coral calcification, which was also confirmed in other studies [70,71,72]. For other CO2 parameters (pHT°C24.8°C, pCO[email protected]°C, and Ω[email protected]°C), similarly, they showed a significant linear relationship with salinity in the surface and bottom water (p < 0.001; Supplementary Figure S15), and the salinity change could reveal 29.2–70.5% of their variation. The above results indicated that the freshwater dilution may have an effect on the seasonal variation in the seawater CO2 system. However, considering the low seasonal variation in salinity (amplitude of variation < 1.5), we believe that dilution may have a limited contribution to the change in the inorganic carbon system.
As for the different study areas (i.e., DAB, DLB, and YNKSA), however, we only found that the salinity in YMKSA showed a significant positive correlation with the carbonate parameters (except for the bottom TA) (p < 0.001; Figure 6 and Supplementary Figure S15), thus indicating the important influence of water mixing (dilution effect), which can explain 64.4–169.2% of the seasonal amplitude of carbonate parameters (TA, DIC, pHT, pCO2, and ΩA) in water. However, focusing on DAB and DLB, no significant correlation was found except for the relationship between salinity and surface DIC, pHT, and pCO2 (weak significance, p < 0.05), thus indicating that there were other important factors besides water mixing, e.g., biological activity.

4.2.3. Photosynthesis and Respiration

Due to the extremely high biodiversity and biomass, the metabolic processes of organisms in coral reefs are very complex, including the primary production of phytoplankton and benthic algae; and the heterotrophic metabolism of corals, microorganisms, and reef organisms. These processes can all have a large impact on the CO2 system in the water column [27,29].
Generally, the photosynthesis of algae can be described by the formula 106CO2 + 122H2O + 16HNO3 + H3PO4 → (CH2O)106(NH3)16H3PO4 + 138O2. Therefore, photosynthesis can reduce the DIC and increase the TA, thereby regulating the CO2 system in seawater [25]. In this study, the surface Chl a showed a significant correlation with the NDIC, NpH[email protected]°C, NpCO[email protected]°C, and ΩA on an annual basis, excluding the YMKSA data of May 2023 (n = 152), but relatively weak (p < 0.05), indicating that the primary production controlled the seasonal variation in the surface CO2 system to some extent. However, as shown in Supplementary Figure S16, the data of the Chl a and CO2 parameters in YMKSA for May 2023 significantly deviated from their overall relationship, which may be the result of multiple factors, e.g., biological calcification, respiration, and air–sea exchange [42,43].
In contrast to photosynthesis, the respiration process by microorganisms and reef organisms can increase DIC and reduce TA in seawater [25]. During the investigation period, we only analyzed the respiration and calcification processes of corals; we did not analyze the metabolic processes of other organisms (such as reef organisms and microorganisms). Therefore, it was difficult to directly quantify the contribution of the biological respiration to the seawater CO2 system. Generally, the AOU is a key indicator of net metabolic activity, i.e., net process of photosynthesis and respiration [73]. Therefore, the relationship between the AOU and CO2 parameters can effectively reveal the effect of biological metabolic process on the seawater CO2 system. As demonstrated by Figure 7, taking all the data into account (n = 192), AOU showed a significant linear relationship with NDIC, NpH[email protected]°C, NpCO[email protected]°C, and NΩ[email protected]°C, especially in the bottom seawater (p < 0.001), and its distribution pattern basically followed the trend of Redfield line [74], indicating that biological processes (photosynthesis and respiration process) could be the main processes controlling the seasonal variation in these CO2 parameters [25].
Regionally, the AOU has a very significant linear relationship with the NDIC, NpH[email protected]°C, NpCO[email protected]°C, and NΩ[email protected]°C in the bottom water of the DAB, DLB and YMKSA (p < 0.001, n = 192); however, their relationship was relatively weak in the surface water due to factors such as the air–sea exchange (Figure 7). In terms of the DIC, the slopes of the NDIC–AOU regression for the bottom water of the DAB and DLB, 0.69 and 0.63 (Figure 7b), were close to the Redfield stoichiometry, i.e., the C/O molar ratio of 0.77 (106/138) [74], which was similar to those observed in other coastal waters, e.g., Gulf of Trieste [75] and North Yellow Sea [26], reflecting the dominant role of phytoplankton photosynthesis and microbial respiration. However, the slope of NDIC–AOU regression in the YMKSA was 0.39, which was much lower than that in Redfield stoichiometry, which may be related to the metabolism of coral reef organisms, such as fish and corals [76,77,78,79].
Furthermore, according to the change in the AOU and the linear relationship between the AOU and CO2 parameters, the variations in the DIC, pHT, pCO2, and ΩA in the bottom water by biological processes were estimated to be 152.8 μmol kg−1, 0.244, 310.1 μatm, and 1.33 of the DAB; 93.1 μmol kg−1, 0.193, 256.5 μatm, and 1.05 of the DLB; and 87.1 μmol kg−1, 0.335, 466.9 μatm, and 1.78 of the YMKSA, respectively. In comparison, the contribution of biological processes to the seasonal variation in the ΩA was comparable to that of temperature; however, its contribution to pHT and pCO2 was relatively low, accounting for about 47–90% of the temperature. Of course, it is undeniable that there may be a large deviation between the results quantified by linear fitting and the actual values. The main reasons are as follows: (1) theoretically, the relationship between the AOU and pHT, pCO2, and ΩA was not a simple first-order linear relationship; and (2) the distribution of the inorganic carbon parameter–AOU was scattered, especially in the summertime, which may be related to hypoxia.

4.2.4. Coral Metabolic Activity

Coral communities can change the concentration of TA and DIC in seawater through photosynthesis, respiration, and calcification to regulate the marine CO2 system [27]. Based on the results of culture experiments and the distribution of corals in the study area, the contribution of coral metabolism to TA and DIC in seawater was preliminarily calculated. The results showed that coral metabolic processes may have little effect on TA and DIC in the seawater of the survey area. On average, coral metabolism only reduced TA in the water column of the DAB, DLB, and YMKSA by 0.16 ± 0.03 μmol kg−1, 0.03 ± 0.01 μmol kg−1, and 0.21 ± 0.04 μmol kg−1 per month; correspondingly, this process increased the DIC by 3.57 ± 0.54 μmol kg−1, 0.81 ± 0.12 μmol kg−1, and 4.65 ± 0.70 μmol kg−1, respectively. A previous study indicated that, in autumn, the microbial respiration of seawater in here can simultaneously reduce the concentration of TA by 14.4–22.8 μmol kg−1 and increase the concentration of DIC by 90.0–168 μmol kg−1 per month [28]. In comparison, the effect of coral metabolism on TA and DIC was much lower than that of microbial respiration. Similar results were also observed in other coral reefs, e.g., Kāne ‘ohe Bay [9].
However, during the survey period, we found the CO2 parameters of the bottom water in the study area, especially in the YMKSA, showed significant differences between the reef area and the non–reef area (p < 0.05), which has also been found in other coral reef waters [54], reflecting the significant impact of coral communities on the reef area. It was assumed that coral metabolic activity only affected the CO2 system within the reef area (ignoring the water exchange inside and outside the reef area). In this scenario, the coral metabolism can reduce the concentration of TA by 4.19 ± 1.74 μmol kg−1 (DAB), 1.84 ± 0.34 μmol kg−1 (DLB), and 2.71 ± 1.90 μmol kg−1 (YMKSA) per month; correspondingly, it can increase the concentration of DIC by 88.14 ± 30.45 μmol kg−1, 40.7 ± 6.12 μmol kg−1, and 51.77 ± 17.40 μmol kg−1, respectively, which was almost equivalent to the contribution of microbial respiration.
In addition, coral communities can affect the carbon cycle of their habitats. For instant, the metabolic process of corals can continuously release a large amount of active organic carbon (e.g., coral mucus) into seawater, especially under environmental stress, which can significantly affect the carbon metabolism process of water and sediment [80]. Furthermore, coral reefs can accumulate a large number of benthic organisms, and their metabolism also has an important impact on the CO2 system. To sum up, we speculate that large–scale coral reef was a non–negligible factor leading to OA in coastal waters.

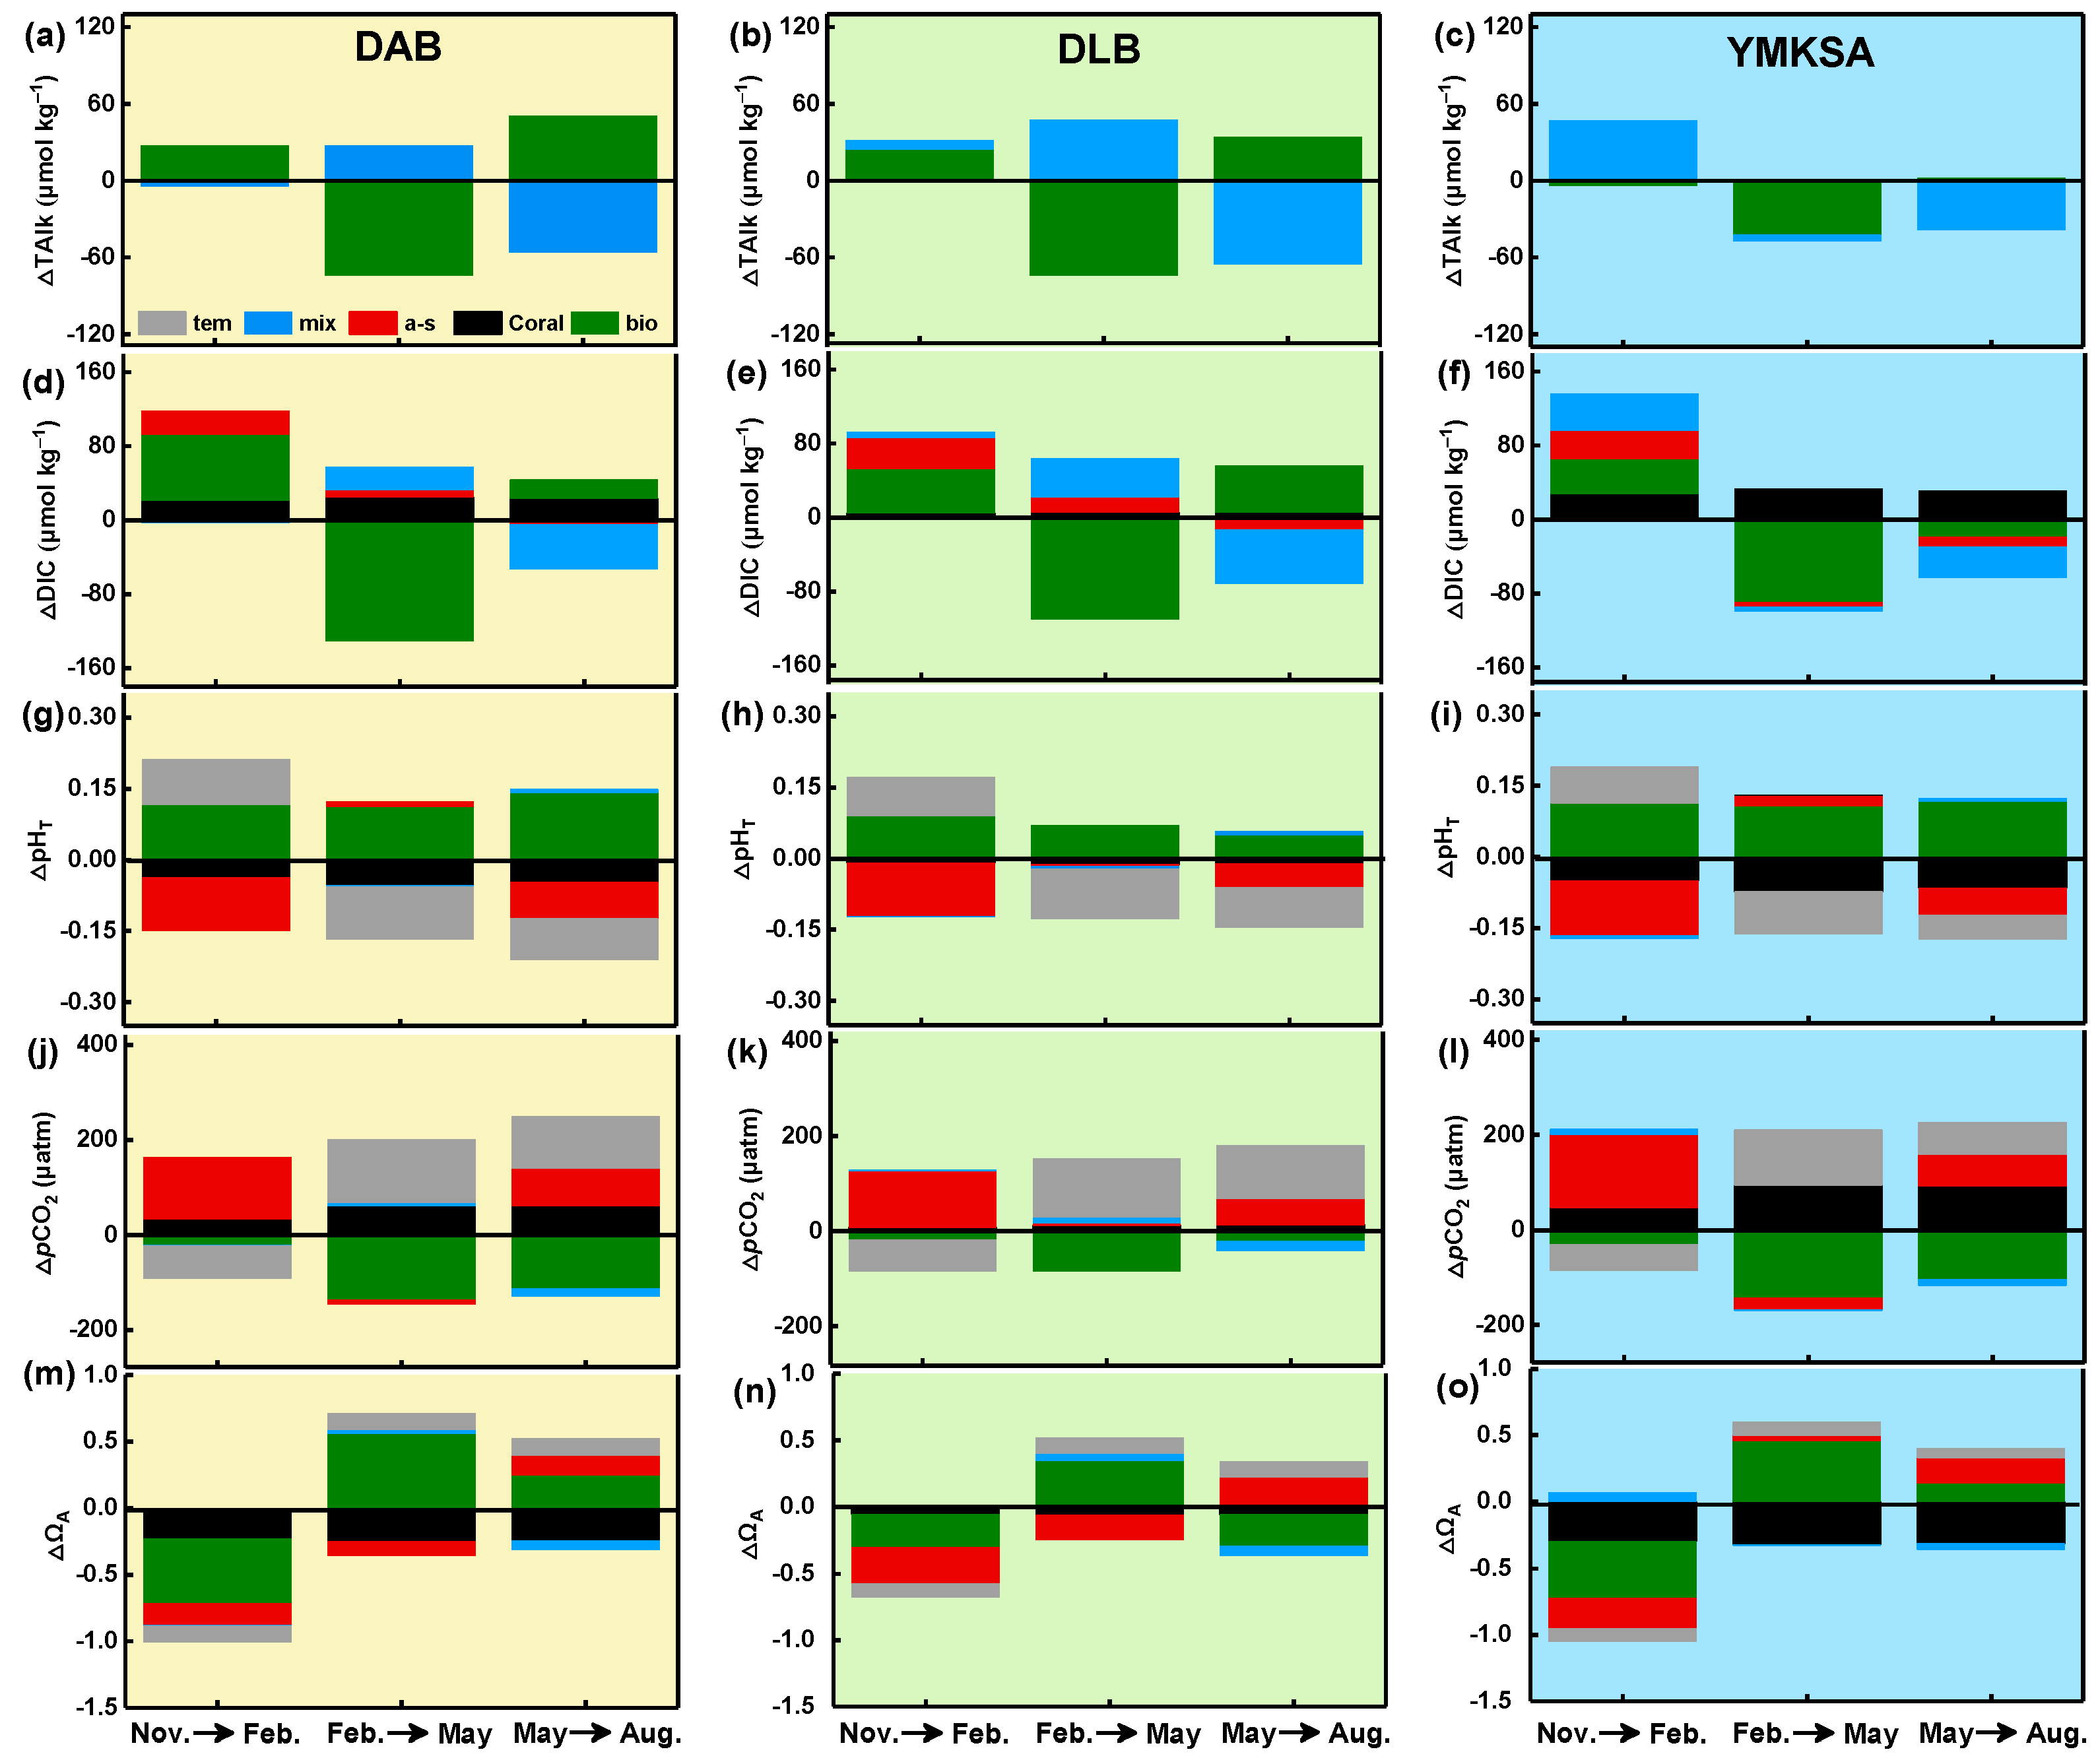
4.3. 1–D Model Reveals the Seasonal Driving Mechanism of CO2 System

The contributions and relative importance of different controlling processes to the seasonal changes in the carbonate parameters (TA, DIC, pHT, pCO2, and ΩA) are shown in Figure 8. The specific contributions of different processes (temperature change, water mixing, air–sea exchange of CO2, coral metabolism, and other biological processes) were shown in Supplementary Material Section S1.2. Although the conclusions obtained from the 1–D model were generally consistent with those derived from the property regression, sometimes, they also illustrate how the various processes enhance or cancel each other.
As for TA, water mixing and biological processes (except coral metabolism) were generally the main driving forces for its seasonal variations (Figure 8a–c). However, in terms of different study areas (DAB, DLB and YMKSA), there were some differences in the effects of the above processes (i.e., water mixing and biological processes) on TA changes. For example, water mixing dominated the change in TA in the YMKSA from November 2022 to February 2023, and from May to August 2023, while the biological process controlled its change from February to May 2023. However, the seasonal variations in TA in the DAB and DLB were jointly controlled by water mixing and biological processes (except for DAB from November 2022 to February 2023).
In the DAB and YMKSA, DIC was controlled by biological processes, air–sea exchange, coral metabolism and water mixing (Figure 8d,f). In comparison, coral metabolism had little effect on the seasonal variation in DIC in the DLB, which was also true for other CO2 parameters (pHT, pCO2 and ΩA) (Figure 8). Among them, biological processes were the most important contributors to controlling the seasonal variation in DIC in the DAB and DLB from November 2022 to May 2023, while biological processes and water mixing jointly controlled their changes from May to August 2023 (Figure 8d,e). Different from the former, biological processes dominated the DIC changes in the YMKSA from February to May 2023. In other stages, biological processes, air–sea exchange, coral metabolism, and water mixing jointly controlled the seasonal variation in the DIC (Figure 8f).
As for other CO2 parameters (pHT, pCO2, and ΩA), biological processes, temperature changes, air–sea exchange, and coral metabolism (except DLB) jointly dominated their seasonal changes (Figure 8g–o). However, water mixing had little effect on the above parameters. As shown in Figure 8, overall, the seasonal driving factors of pHT were opposite to that of pCO2. Among them, biological processes, temperature changes, air–sea exchange, and coral metabolism were the main contributors to the changes in pHT and pCO2 of the DAB and YMKSA between November 2022 and February 2023 and between May 2023 and August 2023, while biological processes, temperature changes, and coral metabolism controlled their changes between February and May 2023. The seasonal driving factors of pHT and pCO2 in the DLB were almost consistent with those of DAB and YNKSA, except for the little effect on coral metabolism. Similarly, as for ΩA, biological processes, temperature changes, air–sea exchange, and coral metabolism jointly dominated its seasonal changes in the DAB and YMKSA. In the DLB, biological processes, temperature changes, and air–sea exchange control its changes, while coral metabolism has little effect (Figure 8n).

5. Conclusions

In this study, we demonstrated the dynamics of the seawater CO2 system and its controlling factors in the DAB, DLB, and YMKSA in the November 2022, February 2023, May 2023, and August 2023. Overall, DAB acted as a sink for atmospheric CO2 with the exchange flux of −1.51 ± 0.31 to 0.27 ± 0.50 mmol C m−2 d−1, while DLB and YMKSA acted as a CO2 source with the exchange fluxes of −0.42 ± 0.36 to 1.69 ± 0.74 mmol C m−2 d−1 and −0.58 ± 0.48 to 1.69 ± 0.41 mmol C m−2 d−1, respectively. In addition, ~40% of the YMKSA in the bottom water may pose a potential threat to coral growth due to ΩA < 1.5.
The seasonal variation in the seawater CO2 system was mainly driven by a variety of physical and biogeochemical factors, mainly including temperature change, mixing-effect biochemical processes, air–sea exchange, and coral metabolism. The biological processes and mixing effect could be the most important factors for the seasonal variation in TA. As for DIC, in addition to biological process and mixing, its seasonal variation was affected by the air–sea exchange and coral metabolism to some extent. Different from the former, the pHT, pCO2, and ΩA were mainly controlled by the temperature change, biochemical processes, air–sea exchange, and coral metabolism, while water mixing had little effect on them. In addition, our results indicated that coral communities can significantly increase the DIC/TA ratio by reducing the TA concentration and increasing the DIC in the reef waters, which may promote the acidification of local seawater and need attention. Although this study focused on the subtropical coral reefs, it is reasonable to assume that the presence of calcified organisms in other tropical reefs will also accelerate coastal acidification.

Supplementary Materials

The following supporting information can be downloaded at: https://www.mdpi.com/article/10.3390/w15234124/s1, Figure S1: The relationship between the measured and calculated values of DIC (i.e., DICMea and DICCal). Figure S2: Spatial distributions of temperature (°C) and salinity in the surface and bottom water of the DAB. Figure S3: Spatial distributions of temperature (°C) and salinity in the surface and bottom water of the DLB. Figure S4: Spatial distributions of temperature (°C) and salinity in the surface and bottom water of the YMKSA. Figure S5: Spatial distributions of DO (μmol L−1) and Chl a (μg L−1) in the surface and bottom water of the DAB. Figure S6: Spatial distributions of DO (μmol L−1) and Chl a (μg L−1) in the surface and bottom water of the DLB. Figure S7: Spatial distributions of DO (μmol L−1) and Chl a (μg L−1) in the surface and bottom water of the YMKSA. Figure S8: Spatial distributions of TA (μmol kg−1), DIC (μmol kg−1) and pHT@in situ in the surface and bottom water of the DAB. Figure S9: Spatial distributions of TA (μmol kg−1), DIC (μmol kg−1) and pHT@in situ in the surface and bottom water of the DLB. Figure S10: Spatial distributions of TA (μmol kg−1), DIC (μmol kg−1) and pHT@in situ in the surface and bottom water of the YMKSA. Figure S11: Spatial distributions of pCO2@in situ (µatm) and ΩA@in situ in the surface and bottom water of the DAB. Figure S12: Spatial distributions of pCO2@in situ (µatm) and ΩA@in situ in the surface and bottom water of the DLB. Figure S13: Spatial distributions of pCO2@in situ (µatm) and ΩA@in situ in the surface and bottom water of the YMKSA. Figure S14: The mean FCO2 of the DAB, DLB and YMKSA in the November 2022 (Nov), February 2023 (Feb), May 2023 (May) and August 2023 (Aug). Figure S15: NpH[email protected]°C (a and b), NpCO[email protected]°C (c and d) and NΩ[email protected]°C (e and f) versus salinity in the surface and bottom water. Figure S16: NDIC (a), NpH[email protected]°C (b), NΩ[email protected]°C (c) and NpCO[email protected]°C (d) versus Chl a in the surface water. Table S1: Relationship between carbonate parameters and environmental factors in the surface and bottom water during investigation period of the study areas (DAB, DLB and YMKSA) (n = 192). Table S2: Relationship between carbonate parameters and environmental factors in the surface and bottom water of the study areas (DAB, DLB and YMKSA) in November 2022 (n = 46). Table S3: Relationship between carbonate parameters and environmental factors in the surface and bottom water of the study areas (DAB, DLB and YMKSA) in February 2023 (n = 48). Table S4: Relationship between carbonate parameters and environmental factors in the surface and bottom water of the study areas (DAB, DLB and YMKSA) in May 2023 (n = 49). Table S5: Relationship between carbonate parameters and environmental factors in the surface and bottom water of the study areas (DAB, DLB and YMKSA) in August 2023 (n = 49).

Author Contributions

B.Y., investigation, formal analysis, and writing—original draft; Z.Z. and B.C., investigation and writing; B.X., J.Z. and B.Y., conceptualization, resources, and writing—review and editing; B.X. and B.Y., funding acquisition and writing—review and editing; H.Z., B.L. and Z.X., writing—review and editing. All authors have read and agreed to the published version of the manuscript.

Funding

This work was financially supported by the Sustainable Development Project of Shenzhen (KCXFZ20211020165547011), General Project of China Postdoctoral Fund (2022M721792), Shenzhen Basic Research Foundation (JCYJ20230807120402005), Guangdong Basic and Applied Basic Research Foundation (2022A1515110345), and Guangdong Basic and Applied Basic Research Foundation (2023A1515012204).

Institutional Review Board Statement

Not applicable.

Informed Consent Statement

Not applicable.

Data Availability Statement

The data that support the findings of this study are available from the corresponding authors, B. Xiao and J. Zhou, upon reasonable request.

Acknowledgments

Acknowledgement for the data support from “South China Sea and Adjacent Seas Data Center, National Earth System Science Data Center, National Science & Technology Infrastructure of China”. (http://ocean.geodata.cn/data/dataresource.html, accessed on 15 November 2023).

Conflicts of Interest

The authors declare no conflict of interest.

References

  1. NOAA. Trends in Atmosphere Carbon Dioxide, Global Greenhouse Gas Reference Network. 2023. Available online: https://www.esrl.noaa.gov/gmd/ccgg/trends/global.html (accessed on 28 May 2023).
  2. Feely, R.A.; Sabine, C.L.; Lee, K.; Berelson, W.; Kleypas, J.; Fabry, V.; Millero, F.J. Impact of anthropogenic CO2 on the CaCO3 system in the oceans. Science 2004, 305, 362–363. [Google Scholar] [CrossRef] [PubMed]
  3. Doney, S.C.; Fabry, V.J.; Feely, R.A.; Kleypas, J.A. Ocean acidification: The other CO2 problem. Annu. Rev. Mar. Sci. 2009, 1, 169–192. [Google Scholar] [CrossRef] [PubMed]
  4. Riebesell, U.; Kortzinger, A.; Oschlies, A. Sensitivities of marine carbon fluxes to ocean change. Proc. Natl. Acad. Sci. USA 2009, 106, 20602–20609. [Google Scholar] [CrossRef]
  5. Inoue, S.; Kayanne, H.; Yamamoto, S.; Kurihara, H. Spatial community shift from hard to soft corals in acidified water. Nat. Clim. Change 2013, 3, 683–687. [Google Scholar] [CrossRef]
  6. Enochs, I.C.; Manzello, D.P.; Donham, E.M.; Kolodziej, G.; Okano, R.; Johnston, L.; Price, N.N. Shift from coral to macroalgae dominance on a volcanically acidified reef. Nat. Clim. Change 2015, 5, 1083–1088. [Google Scholar] [CrossRef]
  7. Horwitz, R.; Hoogenboom, M.O.; Fine, M. Spatial competition dynamics between reef corals under ocean acidification. Sci. Rep. 2017, 7, 40288. [Google Scholar] [CrossRef]
  8. Agostini, S.; Harvey, B.P.; Wada, S.; Kon, K.; Milazzo, M.; Inaba, K.; Hall-Spencer, J.M. Ocean acidification drives community shifts towards simplified non-calcified habitats in a subtropical-temperate transition zone. Sci. Rep. 2018, 8, 11354. [Google Scholar] [CrossRef]
  9. Page, H.N.; Courtney, T.A.; De Carlo, E.H.; Howins, N.M.; Koester, I.; Andersson, A.J. Spatiotemporal variability in seawater carbon chemistry for a coral reef flat in Kāne‘ohe Bay, Hawai‘i. Limnol. Oceanogr. 2019, 64, 913–934. [Google Scholar] [CrossRef]
  10. Kurihara, H.; Watanabe, A.; Tsugi, A.; Mimura, I.; Hongo, C.; Kawai, T.; Golbuu, Y. Potential local adaptation of corals at acidified and warmed Nikko Bay, Palau. Sci. Rep. 2021, 11, 11192. [Google Scholar] [CrossRef]
  11. Orr, J.C.; Fabry, V.J.; Aumont, O.; Bopp, L.; Doney, S.C.; Feely, R.A.; Yool, A. Anthropogenic ocean acidification over the twenty-first century and its impact on calcifying organisms. Nature 2005, 437, 681–686. [Google Scholar] [CrossRef]
  12. Bates, N.R.; Astor, Y.M.; Church, M.J.; Currie, K.; Dore, J.E.; González-Dávila, M.; Santana-Casiano, J.M. A time-series view of changing surface ocean chemistry due to ocean uptake of anthropogenic CO2 and ocean acidification. Oceanography 2014, 27, 126–141. [Google Scholar] [CrossRef]
  13. Lauvset, S.K.; Gruber, N.; Landschützer, P.; Olsen, A.; Tjiputra, J. Trends and drivers in global surface ocean pH over the past 3 decades. Biogeosciences 2015, 12, 1285–1298. [Google Scholar] [CrossRef]
  14. Dumousseaud, C.; Achterberg, E.P.; Tyrrell, T.; Charalampopoulou, A.; Schuster, U.; Hartman, M.; Hydes, D.J. Contrasting effects of temperature and winter mixing on the seasonal and inter-annual variability of the carbonate system in the Northeast Atlantic Ocean. Biogeosciences 2010, 7, 1481–1492. [Google Scholar] [CrossRef]
  15. Artioli, Y.; Blackford, J.C.; Butenschön, M.; Holt, J.T.; Wakelin, S.L.; Thomas, H.; Allen, J.I. The carbonate system in the North Sea: Sensitivity and model validation. J. Mar. Sys. 2012, 102, 1–13. [Google Scholar] [CrossRef]
  16. Wimart-Rousseau, C.; Lajaunie-Salla, K.; Marrec, P.; Wagener, T.; Raimbault, P.; Lagadec, V.; Lefèvre, D. Temporal variability of the carbonate system and air-sea CO2 exchanges in a Mediterranean human-impacted coastal site. Estuar. Coast. Shelf Sci. 2020, 236, 106641. [Google Scholar] [CrossRef]
  17. Ghosh, J.; Chakraborty, K.; Bhattacharya, T.; Valsala, V.; Baduru, B. Impact of coastal upwelling dynamics on the pCO2 variability in the southeastern Arabian Sea. Prog. Oceanogr. 2022, 203, 102785. [Google Scholar] [CrossRef]
  18. Takeshita, Y.; Frieder, C.A.; Martz, T.R.; Ballard, J.R.; Feely, R.A.; Kram, S. Including high-frequency variability in coastal ocean acidification projections. Biogeosciences 2015, 12, 5853–5870. [Google Scholar] [CrossRef]
  19. Li, C.L.; Zhai, W.D. Decomposing monthly declines in subsurface-water pH and aragonite saturation state from spring to autumn in the North Yellow Sea. Cont. Shelf Res. 2019, 185, 37–50. [Google Scholar] [CrossRef]
  20. Alin, S.R.; Allen, B.; Suhrbier, A.; Davis, J.; Feely, R.A.; Newton, J. Water chemistry, larval oysters, and ocean acidification in a complex, urbanized estuary (Puget Sound, Washington). J. Shellfish. Res. 2012, 31, 259. [Google Scholar]
  21. Wallace, R.B.; Baumann, H.; Grear, J.S.; Aller, R.C.; Gobler, C.J. Coastal ocean acidification: The other eutrophication problem. Estuar. Coast. Shelf Sci. 2014, 148, 1–13. [Google Scholar] [CrossRef]
  22. Ferrera, C.M.; Jacinto, G.S.; Chen, C.; Diego-Mcglone, M.; Datoc, M.; Lagumen, M. Carbonate parameters in high and low productivity areas of the Sulu Sea, Philippines. Mar. Chem. 2017, 195, 2–14. [Google Scholar] [CrossRef]
  23. Li, C.L.; Yang, D.Z.; Zhai, W.D. Effects of warming, eutrophication and climate variability on acidification of the seasonally stratified North Yellow Sea over the past 40 years. Sci. Total Environ. 2022, 815, 152935. [Google Scholar] [CrossRef] [PubMed]
  24. Zhao, Y.; Liu, J.; Uthaipan, K.; Song, X.; Xu, Y.; He, B.; Dai, M. Dynamics of inorganic carbon and pH in a large subtropical continental shelf system: Interaction between eutrophication, hypoxia, and ocean acidification. Limnol. Oceanogr. 2020, 65, 1359–1379. [Google Scholar] [CrossRef]
  25. Cai, W.J.; Hu, X.; Huang, W.J.; Murrell, M.C.; Lehrter, J.C.; Lohrenz, S.E. Acidification of subsurface coastal waters enhanced by eutrophication. Nat. Geosci. 2011, 4, 766–770. [Google Scholar] [CrossRef]
  26. Yang, B.; Gao, X.; Zhao, J.; Liu, Y.; Lui, H.K.; Huang, T.H.; Chen, C.; Xing, Q.G. Massive shellfish farming might accelerate coastal acidification: A case study on carbonate system dynamics in a bay scallop (Argopecten irradians) farming area, North Yellow Sea. Sci. Total Environ. 2021, 798, 149214. [Google Scholar] [CrossRef]
  27. Manzello, D.P. Ocean acidification hotspots: Spatiotemporal dynamics of the seawater CO2 system of eastern Pacific coral reefs. Limnol. Oceanogr. 2010, 55, 239–248. [Google Scholar] [CrossRef]
  28. Yang, B.; Zhang, Z.; Cui, Z.; Chen, B.; Zheng, H.; Xiao, B. Multiple factors driving carbonate system in subtropical coral community environments along Dapeng Peninsula, South China Sea. Atmosphere 2023, 14, 688. [Google Scholar] [CrossRef]
  29. Allison, N. Reconstructing coral calcification fluid dissolved inorganic carbon chemistry from skeletal boron: An exploration of potential controls on coral aragonite B/Ca. Heliyon 2017, 3, e00387. [Google Scholar] [CrossRef] [PubMed]
  30. Cotovicz, L.C., Jr.; Chielle, R.; Marins, R.V. Air-sea CO2 flux in an equatorial continental shelf dominated by coral reefs (Southwestern Atlantic Ocean). Cont. Shelf Res. 2020, 204, 104175. [Google Scholar] [CrossRef]
  31. Dong, X.; Qi, D.; Chen, B.; Wu, Y.; Zheng, X.; Lin, H. Differential roles of anthropogenic CO2 in mediating seasonal amplitudes of ocean acidification metrics over a coastal coral habitat. J. Marine Syst. 2024, 241, 103910. [Google Scholar] [CrossRef]
  32. Zhang, C.; Huang, H.; Ye, C.; Huang, L.; Li, X.; Lian, J.; Liu, S. Diurnal and seasonal variations of carbonate system parameters on Luhuitou fringing reef, Sanya Bay, Hainan Island, South China Sea. Deep Sea Res. Pt. II 2013, 96, 65–74. [Google Scholar] [CrossRef]
  33. Chen, T.R.; Yu, K.F.; Shi, Q. Twenty-five years of change in scleractinian coral communities of Daya Bay (northern South China Sea) and its response to the 2008 AD extreme cold climate event. Chin. Sci. Bull. 2009, 54, 812–820. [Google Scholar] [CrossRef]
  34. Zhou, P.; Li, D.; Li, H.; Fang, H.; Huang, C.; Zhang, Y.; Yang, J. Distribution of radionuclides in a marine sediment core off the waterspout of the nuclear power plants in Daya Bay, northeastern South China Sea. J. Environ. Radioactiv. 2015, 145, 102–112. [Google Scholar] [CrossRef] [PubMed]
  35. Xu, L.; Wang, L.; Wang, X.; Van Damme, K.; Ning, J.; Li, Y.; Du, F. Spatial and temporal variabilities of coastal nekton community structure and phylogenetic diversity in Daya and Dapeng Bay, southern China. Ecol. Indic. 2021, 131, 108226. [Google Scholar] [CrossRef]
  36. Dickson, A.G.; Sabine, C.L.; Christian, J.R. Guide to Best Practices for Ocean CO2 Measurements; North Pacific Marine Science Organization: Victoria, BC, Canada, 2007. [Google Scholar]
  37. Pelletier, G.J.; Lewis, E.; Wallace, D.W.R. CO2SYS.XLS: A Calculator for the CO2 System in Seawater for Microsoft Excel/VBA, version 24; Washington State Department of Ecology: Olympia, WA, USA, 2015.
  38. Meng, L.; Huang, W.; Yang, E.G. High temperature bleaching events can increase thermal tolerance of Porites lutea in the Weizhou Island. Haiyang Xuebao 2022, 44, 87–96. [Google Scholar]
  39. Wanninkhof, R. Relationship between wind speed and gas exchange over the ocean. J. Geophys. Res. Ocean. 1992, 97, 7373–7382. [Google Scholar] [CrossRef]
  40. Sweeney, C.; Gloor, E.; Jacobson, A.R.; Key, R.M.; McKinley, G.; Sarmiento, J.L. Constraining global air-sea gas exchange for CO2 with recent bomb 14C measurements. Glob. Biogeochem. Cycles 2007, 21, 1–10. [Google Scholar] [CrossRef]
  41. South China Sea and Adjacent Seas Data Center. 2022. Available online: http://ocean.geodata.cn (accessed on 28 May 2023).
  42. Xue, L.; Cai, W.J.; Hu, X.; Sabine, C.; Jones, S.; Sutton, A.J. Sea surface carbon dioxide at the Georgia time series site (2006–2007): Air-sea flux and controlling processes. Prog. Oceanogr. 2016, 140, 14–26. [Google Scholar] [CrossRef]
  43. Xue, L.; Cai, W.J.; Sutton, A.J.; Sabine, C. Sea surface aragonite saturation state variations and control mechanisms at the Gray’s Reef time-series site off Georgia, USA (2006–2007). Mar. Chem. 2017, 195, 27–40. [Google Scholar] [CrossRef]
  44. Dai, M.H.; Guo, X.; Zhai, W.; Yuan, L.Y.; Wang, B.; Tang, T.T. Oxygen depletion in the upper reach of the Pearl River estuary during a winter drought. Mar. Chem. 2006, 102, 159–169. [Google Scholar] [CrossRef]
  45. DeCarlo, T.M.; Cohen, A.L.; Wong, G.T.; Shiah, F.K.; Lentz, S.J.; Davis, K.A.; Lohmann, P. Community production modulates coral reef pH and the sensitivity of ecosystem calcification to ocean acidification. J. Geophys. Res.Ocean. 2017, 122, 745–761. [Google Scholar] [CrossRef]
  46. Guo, Y.J.; Zhou, W.H.; Yuan, X.C. Responses of two species of reef-building corals to acidification and dissolved organic carbon enrichment. J. Trop. Oceanogr. 2018, 7, 57–63. [Google Scholar]
  47. Kuffner, I.B.; Hickey, T.D.; Morrison, J.M. Calcification rates of the massive coral Siderastrea siderea and crustose coralline algae along the Florida Keys (USA) outer-reef tract. Coral Reefs 2013, 32, 987–997. [Google Scholar] [CrossRef]
  48. Nishida, K.; Ishikawa, K.; Iguchi, A.; Tanaka, Y.; Sato, M.; Ishimura, T.; Suzuki, A. Skeletal oxygen and carbon isotope compositions of Acropora coral primary polyps experimentally cultured at different temperatures. Geochem. Geophy. Geosy. 2014, 15, 2840–2849. [Google Scholar] [CrossRef]
  49. Chan, W.Y.; Eggins, S.M. Calcification responses to diurnal variation in seawater carbonate chemistry by the coral Acropora formosa. Coral Reefs 2017, 36, 763–772. [Google Scholar] [CrossRef]
  50. Zhao, H.; Zhang, J.L.; Wang, H. Preliminary study on carbon sequestration capacity of two hermatypic corals. J. Trop. Oceanogr. 2023. [Google Scholar] [CrossRef]
  51. Fagan, K.E.; Mackenzie, F.T. Air–sea CO2 exchange in a subtropical estuarine-coral reef system, Kaneohe Bay, Oahu, Hawaii. Mar. Chem. 2007, 106, 174–191. [Google Scholar] [CrossRef]
  52. Akhand, A.; Watanabe, K.; Chanda, A.; Tokoro, T.; Kuwae, T. Lateral carbon fluxes and CO2 evasion from a subtropical mangrove-seagrass-coral continuum. Sci. Total Environ. 2021, 752, 142190. [Google Scholar] [CrossRef]
  53. Zhang, Y.L.; Zou, R.L. Study on community structure of shallow water stony coral in Daya Bay. Tropic. Oceanol. 1987, 6, 13–18. [Google Scholar]
  54. Yan, H.; Yu, K.; Shi, Q.; Tan, Y.; Zhang, H.; Zhao, M.; Li, S.; Chen, T.; Huang, L.; Wang, P. Coral reef ecosystems in the South China Sea as a source of atmospheric CO2 in summer. Chin. Sci. Bull. 2011, 56, 676–684. [Google Scholar] [CrossRef]
  55. Lonborg, C.; Calleja, M.L.; Fabricius, K.E.; Smith, J.N.; Achterberg, E.P. The great barrier reef: A source of CO2 to the at-mosphere. Mar. Chem. 2019, 210, 24–33. [Google Scholar] [CrossRef]
  56. Hannan, K.D.; Miller, G.M.; Watson, S.A.; Rummer, J.L.; Fabricius, K.; Munday, P.L. Diel pCO2 variation among coral reefs and microhabitats at Lizard Island, Great Barrier Reef. Coral Reefs 2020, 39, 1391–1406. [Google Scholar] [CrossRef]
  57. Albright, R.; Langdon, C.; Anthony, K.R.N. Dynamics of seawater carbonate chemistry, production, and calcification of a coral reef flat, central Great Barrier Reef. Biogeosciences 2013, 10, 6747–6758. [Google Scholar] [CrossRef]
  58. Norzagaray, C.O.; Hernandez-Ayon, J.M.; Castro, R.; Calderon-Aguilera, L.E.; Martz, T.; Valdivieso-Ojeda, J.A.; Lara-Lara, R. Seasonal controls of the carbon biogeochemistry of a fringing coral reef in the Gulf of California, Mexico. Cont. Shelf Res. 2020, 211, 104279. [Google Scholar] [CrossRef]
  59. Knebel, O.; Carvajal, C.; Kench, P.; Gehrels, R. Spatial pH variability of coral reef flats of Kiritimati Island, Kiribati. Mar. Environ. Res. 2023, 185, 105861. [Google Scholar] [CrossRef]
  60. Weiss, R.F. Carbon dioxide in water and seawater: The solubility of a non-ideal gas. Mar. Chem. 1974, 2, 203–215. [Google Scholar] [CrossRef]
  61. Albuquerque, C.; Kerr, R.; Monteiro, T.; Orselli, I.B.M.; de Carvalho-Borges, M.; de Oliveira Carvalho, A.D.C.; Mendes, C.R.B. Seasonal variability of carbonate chemistry and its controls in a subtropical estuary. Estuar. Coast. Shelf Sci. 2022, 276, 108020. [Google Scholar] [CrossRef]
  62. Hu, X.; Nuttall, M.F.; Wang, H.; Yao, H.; Staryk, C.J.; McCutcheon, M.R. Seasonal variability of carbonate chemistry and decadal changes in waters of a marine sanctuary in the Northwestern Gulf of Mexico. Mar. Chem. 2018, 205, 16–28. [Google Scholar] [CrossRef]
  63. McCutcheon, M.R.; Yao, H.; Staryk, C.J.; Hu, X. Temporal variability and driving factors of the carbonate system in the Aransas Ship Channel, TX, USA: A time series study. Biogeosciences 2021, 18, 4571–4586. [Google Scholar] [CrossRef]
  64. Deng, X.; Zhang, G.L.; Xin, M.; Liu, C.Y.; Cai, W.J. Carbonate chemistry variability in the southern Yellow Sea and East China Sea during spring of 2017 and summer of 2018. Sci. Total Environ. 2021, 779, 146376. [Google Scholar] [CrossRef]
  65. Yang, W.; Guo, X.; Cao, Z.; Xu, Y.; Wang, L.; Guo, L.; Dai, M. Seasonal dynamics of the carbonate system under complex circulation schemes on a large continental shelf: The northern South China Sea. Prog. Oceanogr. 2021, 197, 102630. [Google Scholar] [CrossRef]
  66. Liang, B.; Xiu, P.; Hu, J.; Li, S. Seasonal and spatial controls on the eutrophication-induced acidification in the Pearl River Estuary. J. Geophys. Res. Ocean. 2021, 126, e2020JC017107. [Google Scholar] [CrossRef]
  67. Chou, W.C.; Tishchenko, P.Y.; Chuang, K.Y.; Gong, G.G.; Shkirnikova, E.M.; Tishchenko, P.P. The contrasting behaviors of CO2 systems in river-dominated and ocean-dominated continental shelves: A case study in the East China Sea and the Peter the Great Bay of Japan/East Sea in summer 2014. Mar. Chem. 2017, 195, 50–60. [Google Scholar] [CrossRef]
  68. Wright-Fairbanks, E.K.; Saba, G.K. Quantification of the Dominant Drivers of Acidification in the Coastal Mid-Atlantic Bight. J. Geophys. Res. Ocean. 2022, 127, e2022JC018833. [Google Scholar] [CrossRef]
  69. Henson, H.C.; Holding, J.M.; Meire, L.; Rysgaard, S.; Stedmon, C.A.; Stuart-Lee, A.; Sejr, M. Coastal freshening drives acidification state in Greenland fjords. Sci. Total Environ. 2023, 855, 158962. [Google Scholar] [CrossRef]
  70. Kleypas, J.A.; Langdon, C. Coral reefs and changing seawater carbonate chemistry. Coral Reefs Clim. Chang. Sci. Manag. 2006, 61, 73–110. [Google Scholar]
  71. Andersson, A.J.; Yeakel, K.L.; Bates, N.R.; De Putron, S.J. Partial offsets in ocean acidification from changing coral reef biogeochemistry. Nat. Clim. Chang. 2014, 4, 56–61. [Google Scholar] [CrossRef]
  72. Jokiel, P.L.; Jury, C.P.; Kuffner, I.B. Coral calcification and ocean acidification. Coral Reefs Crossroads 2016, 6, 7–45. [Google Scholar]
  73. Benson, B.B.; Krause, D. The concentration and isotopic fractionation of oxygen dissolved in fresh water and seawater in equilibrium with the atmosphere. Limnol. Oceanogr. 1984, 29, 620–632. [Google Scholar] [CrossRef]
  74. Redfield, A.C. The biological control of chemical factors in the environment. Am. Sci. 1958, 46, 230A, 205–221. [Google Scholar]
  75. Cantoni, C.; Luchetta, A.; Celio, M.; Cozzi, S.; Raicich, F.; Catalano, G. Carbonate system variability in the Gulf of Trieste (North Adriatic Sea). Estuar. Coast. Shelf Sci. 2012, 115, 51–62. [Google Scholar] [CrossRef]
  76. Leclercq, N.; Gattuso, J.P.; Jaubert, J. Primary production, respiration, and calcification of a coral reef mesocosm under increased CO2 partial pressure. Limnol. Oceanogr. 2002, 47, 558–564. [Google Scholar] [CrossRef]
  77. Middelburg, J.J.; Duarte, C.M.; Gattuso, J.P. Respiration in coastal benthic communities. In Respiration in Aquatic Ecosystems; Oxford University Press: Oxford, UK, 2005; pp. 206–224. [Google Scholar]
  78. Ulstrup, K.E.; Kühl, M.; Van Oppen, M.J.; Cooper, T.F.; Ralph, P.J. Variation in photosynthesis and respiration in geographically distinct populations of two reef-building coral species. Aquat. Biol. 2011, 12, 241–248. [Google Scholar] [CrossRef]
  79. Khripounoff, A.; Caprais, J.C.; Le Bruchec, J.; Rodier, P.; Noel, P.; Cathalot, C. Deep cold-water coral ecosystems in the Brittany submarine canyons (Northeast Atlantic): Hydrodynamics, particle supply, respiration, and carbon cycling. Limnol. Oceanogr. 2014, 59, 87–98. [Google Scholar] [CrossRef]
  80. Bythell, J.C.; Wild, C. Biology and ecology of coral mucus release. J. Exp. Mar. Biol. Ecol. 2011, 408, 88–93. [Google Scholar] [CrossRef]
Figure 1. Map of sampling stations. Areas A, B, and C are located in the Da’ao Bay (DAB), Dalu Bay (DLB), and Yangmeikeng sea area (YMKSA), respectively. The DNPS and YM River represent the Daya Bay Nuclear Power Station and Yangmei River, respectively. The orange area in the figure indicates the presence of coral reefs. The color bar indicates the bottom depth (m).
Water 15 04124 g001
Figure 2. Time series for the averaged survey values of temperature (a), salinity (b), DO (c), and Chl a (d) of the surface (dashed line, denoted with (S)) and bottom (solid line, denoted with (B)) waters (mean ± SD).
Water 15 04124 g002
Figure 3. Time series of averaged survey values of TA (a), DIC (b), pHT@ in situ (c), and pCO2@ in situ (d) in the surface (dashed line denoted with (S)) and bottom (solid line denoted with (B)) waters (mean ± SD).
Water 15 04124 g003
Figure 4. The release fluxes of TA (a) and DIC (b) by coral metabolism in different seasons (positive indicates release; negative indicates absorption).
Water 15 04124 g004
Figure 5. pHT@in situ, (a,b) pCO2@in situ (c,d), and ΩA@in situ (e,f) versus temperature in the surface and bottom water.
Water 15 04124 g005
Figure 6. TA (a,b) and DIC (c,d) versus salinity in the surface and bottom water.
Water 15 04124 g006
Figure 7. NDIC (a,b), NpH[email protected]°C (c,d), NpCO[email protected]°C (e,f), and NΩ[email protected]°C (g,h) versus AOU in the surface and bottom water from May to November.
Water 15 04124 g007
Figure 8. The contribution of temperature (tem), mixing (mix), air–sea exchange (a-s), coral activity (sc), and biochemical processes (bio) to seasonal variation in the CO2 parameters in the DAB (a,d,g,j,m), DLB (b,e,h,k,n) and YMKSA (c,f,i,l,o).
Water 15 04124 g008
Table 1. Comparisons of the values of TA (μmol kg−1), DIC (μmol kg−1), pHT, pCO2 (μatm), and ΩA from some coral reef waters in the world.
LocationSampling TimeTA
μmol kg−1
DIC
μmol kg−1
pHTpCO2 
μatm
ΩAReference
Pedra da Risca do Meio Coral ReefAugust and November 20202325 ± 192019 ± 167.980 ± 0.008475 ± 28n.d.Cotovicz et al. [30]
Great Barrier Reef–AustraliaSeptember 2009 to August 20162288 ± 441989 ± 458.03 ± 0.05404 ± 46n.d.Lønborg et al. [55]
Trawler ReefAugust 20142289.3 ± 4.92003.0 ± 19.78.011 ± 0.020n.d.n.d.Hannan et al. [56]
Big Vicki’s ReefAugust 20142284.0 ± 9.81984.7 ± 14.78.044 ± 0.023n.d.n.d.Hannan et al. [56]
Palfrey ReefAugust 20142278.4 ± 7.41981.9 ± 22.78.048 ± 0.036n.d.n.d.Hannan et al. [56]
Coral Reef Lagoon Kaneohe BaySeptember 2003 to September 20042180 ± 361920 ± 16n.d.460 ± 52n.d.Fagan and Mackenzie [51]
The coast of Iriomote Island (Japan) August 20172211 ± 441878 ± 1038.009 ± 0.177415 ± 81n.d.Akhand et al. [52]
Reef flat in Northeastern BrazilJuly 20061857.6 ± 42.11623.0 ± 39.28.13 ± 0.12371.6 ± 9.2n.d.Akhand et al. [52]
Luhuitou fringing reef, Sanya Bay, ChinaJuly 2010 2312.1 ± 15.31994.7 ± 40.98.007 ± 0.048420.1 ± 62.4n.d.Zhang et al. [53]
Yongxing Island, ChinaJuly to August 20092421 ± 142n.d.8.23 ± 0.22456 ± 249n.d.Yan et al. [54]
Fiery Cross Reef, ChinaJuly to August 20092240 ± 56n.d.8.22 ± 0.03395 ± 25n.d.Yan et al. [54]
Great Barrier Reef, AustraliaNovember 2011 to April 20122276 ± 161954 ± 258.03 ± 0.03404 ± 40 n.d.Albright et al. [57]
Gulf of California, MexicoJanuary to May 2014n.d.n.d.n.d.n.d.3.03 ± 0.05Norzagaray et al. [58]
Reef flats of Kiritimati IslandMay and June 20182256.1 ± 22.2 1989.8 ± 59.67.95 ± 0.08n.d.3.1 ± 0.4Knebel et al. [59]
Dongshan coral habitatMay 20192221 ± 0 1960 ± 4 402 ± 6 2.92 ± 0.05 Dong et al. [31]
August 20192249 ± 1 2038 ± 0 619 ± 15 2.47 ± 0.01
December 20192209 ± 1 2009 ± 4 436 ± 11 2.26 ± 0.03
Gray’s ReefJuly 2006 to October 2007n.d.n.d.8.08 ± 0.05377 ± 103.47 ± 0.46Xue et al. [42,43]
Eastern coast of Shenzhen, ChinaNovember 20222184.6 ± 24.61879.7 ± 30.58.12 ± 0.03317.8 ± 26.23.40 ± 0.18In this study
February 20232219.6 ± 13.81998.4 ± 15.98.17 ± 0.03405.2 ±35.82.50 ± 0.11
May 20232178.8 ± 21.71938.3 ± 22.78.12 ± 0.03458.5 ± 33.72.81 ± 0.15
August 20232153.7 ± 37.01914.8 ± 58.58.06 ± 0.07579.5 ± 119.82.89 ± 0.44
Note(s): n.d. = no data.
Disclaimer/Publisher’s Note: The statements, opinions and data contained in all publications are solely those of the individual author(s) and contributor(s) and not of MDPI and/or the editor(s). MDPI and/or the editor(s) disclaim responsibility for any injury to people or property resulting from any ideas, methods, instructions or products referred to in the content.

