
Uncertainty Assessment in Temperature Uniformity Survey of Thermal Processing Equipment According to AMS2750 Aerospace Specification


Departamento de Ingeniería Eléctrica, Universidad de Cádiz, Avenida de la Universidad de Cádiz, 10, 11519 Cádiz, Spain
*
Author to whom correspondence should be addressed.
Aerospace 2023, 10(11), 915; https://doi.org/10.3390/aerospace10110915
Submission received: 25 September 2023
/
Revised: 21 October 2023
/
Accepted: 24 October 2023
/
Published: 26 October 2023
(This article belongs to the Section Aeronautics)
Abstract
:Thermal processing equipment used in the aerospace industry must meet the requirements of the processes for which they are intended. The periodic tests performed by calibration laboratories, according to the AMS2750 specification, are intended to ensure compliance with these equipment requirements. While this specification does not explicitly state the need for uncertainty calculation, it does specify that pyrometry laboratories must have an ISO/IEC 17025 Quality System accredited by a recognized regional body which is a member of the International Laboratory Accreditation Cooperation (ILAC). Therefore, the calculation of uncertainties is necessary. This work presents a methodology for conducting temperature uniformity surveys and uncertainty assessment in these tests. This methodology has been applied to four different types of equipment to analyse, in each case, the contributions of uncertainties and to assess their potential for improvement. The objectives that laboratories should aim for include improving measurement accuracy and reducing uncertainty components in order to meet the criteria of both AMS2750 and ISO/IEC 17025.
1. Introduction
The aerospace industry is constantly seeking to improve the structural strength-to-mass ratio of the materials used in aircraft manufacturing to reduce fuel consumption, pollutant emissions and the cost of raw materials. This evolution leads to continuous development of the associated manufacturing processes [1]. As an example, each new generation of Boeing aircraft is 15–25% more efficient than the previous one, and these aircraft are 90% recyclable by weight [2]. As for Airbus, the A350 model is composed of 53% lightweight and composite materials and emits 25% less CO2 compared to the previous model [3]. In [4,5], the author exposes the importance of certification and qualification of additive manufacturing processes in order to reduce manufacturing costs by reducing operational man and machine hours and simplifying the manufacturing process.
The most common materials are aluminium alloys, titanium alloys, steel, magnesium and composite materials [6,7,8]. The different materials require specific heat treatments that provide the necessary properties and characteristics to the different components to be assembled [9,10,11]. The heat treatments to be applied can be diverse, including solution, ageing, annealing, normalising, austenising, tempering, precipitation and stress relieving. In any case, exhaustive and rigorous metrological control of the different types of thermal equipment involved in the production process is required in order to guarantee the necessary heat treatment. Precise temperature control guarantees the efficiency of the process and the quality of the product.
The AMS2750 [12] specification published by the SAE (Society Automotive Engineers) addresses the pyrometric requirements for equipment used for the thermal processing of metallic materials in the aerospace industry. This specification establishes the characteristics and requirements for temperature sensors, instrumentation, thermal processing equipment, instrument correction factors and offsets, system accuracy tests and temperature uniformity surveys (TUS). This specification is currently used as a reference by major aircraft manufacturers such as BOEING, AIRBUS and Bombardier [13,14,15].
TUS require the thermal evaluation of the volume of the equipment during a certain time and for different temperature values according to its working range. For this purpose, it is necessary to have a set of sensors inside the volume to be characterised in order to reproduce the production load conditions during the test and to record the measured temperature values for characterisation. The possible parameters to be characterised depend on the type of isothermal medium and its use. The most common parameters are stability, uniformity, indication, thermal inertia, recovery time, transfer time and thermal decrease. These tests are essential to ensure that parts or raw materials are heat-treated by the applicable specifications.
The latest revision, G, of the AMS2750 specification came into force in June 2022, and there were no significant changes from the previous revision, F (effective from June 2020). Revision G incorporates several modifications and clarifications to Revision F, as well as new definitions and tables. Revision F established a period of 2 years for pyrometry service providers to have a quality system accredited to ISO/IEC 17025 [16]. ISO/IEC 17025 sets out the requirements that testing and calibration laboratories must meet to demonstrate their technical competence and their ability to generate valid results. Among other requirements, it states that the laboratory must use appropriate methods and procedures for all laboratory activities, as well as for the evaluation of measurement uncertainty. Therefore, although the AMS2750 specification does not explicitly consider the evaluation of uncertainty, it is necessary to consider it as an implicit requirement in ISO/IEC 17025.
Measurement uncertainty is defined, according to the International Vocabulary of Metrology (VIM) [17], as a non-negative parameter that characterises the dispersion of values attributed to a measurand. The Guide to the Expression of Uncertainty of Measurement (GUM) [18], published by the General Conference on Weights and Measures (Bureau International des Poids et Mesures, BIPM), is a document that provides a framework for the evaluation of measurement uncertainty. The GUM is used to evaluate measurement uncertainty in a wide variety of fields, and provides guidance for the calculation of measurement uncertainty and its expression in technical and scientific reports. Document EA-4/02 [19] is a guide for the expression of measurement in calibration that is applicable to all fields of calibration. This document was drafted by the EA (European Accreditation) laboratory committee and aims to harmonise the evaluation of measurement uncertainty, establish its expression in calibration certificates and assist accreditation bodies. An illustration of the assessment of uncertainty in temperature measurements is presented in reference [20].
The current research on the methodology for temperature uniformity testing in thermal processing equipment focuses on improving the accuracy and efficiency of the process [21]. Improving process efficiency can take many forms, including reducing the amount of material waste, improving energy efficiency, extending process sensor testing intervals and improving process sensor reliability. One of the most studied topics is additive manufacturing, such as wire arc additive manufacturing processes [6], which reduce the ratio between the initial mass of material at the beginning of the manufacturing process and the final mass of the final product (buy-to-fly ratio) in a very significant way. In this sense, [22] estimates that additive manufacturing technology produces a significant reduction in the buy-to-fly ratio, minimized to 1:1. Regarding the improvement of energy efficiency, the study carried out in [23] on an industrial forging furnace shows that a reduction in the opening time reduces the energy loss significantly, limiting fuel consumption and pollutant emissions.
Advanced computational simulations are used to optimise furnace designs and air circulation systems, ensuring a more uniform temperature distribution. In [24], the authors evaluate the temperature uniformity of a laboratory oven according to the AMS2750 specification. With the obtained data, a virtual model was created in Matlab® to obtain, by means of volumetric interpolation, the 3D temperature map. With this map, the stability and uniformity were optimized by reducing the working zone volume of the thermal processing equipment. The study in [25] addressed the challenges of measurements in the high-temperature domain (above 1000 °C) in both contact and non-contact thermometry. The paper cited in [26] presents a three-dimensional fluid dynamics model to simulate complex industrial furnaces. For this purpose, a numerical investigation of natural and forced convection heat transfer and airflow in an industrial furnace was carried out.
In addition, control and monitoring strategies have been investigated to maintain a constant and uniform temperature during heat treatment [27,28]. More accurate and reliable methods of calibration and verification of temperature sensors are also being sought. These advances are aimed at ensuring quality and consistency in the processes used in the aerospace industry.
In this article, the basic methodological aspects of a TUS carried out with the highest possible accuracy according to the AMS2750 specification will be listed. The different uncertainty components that contribute to the standard uncertainty calculation will be analysed and presented, assessing the possibility of reducing some of these components. Finally, the proposed method will be applied to four real cases of thermal processing. An oven, a type of thermal bath equipment, an autoclave and a type of refrigeration equipment will be considered. The results obtained for these four types of thermal processing equipment will be presented.
2. Materials and Methods
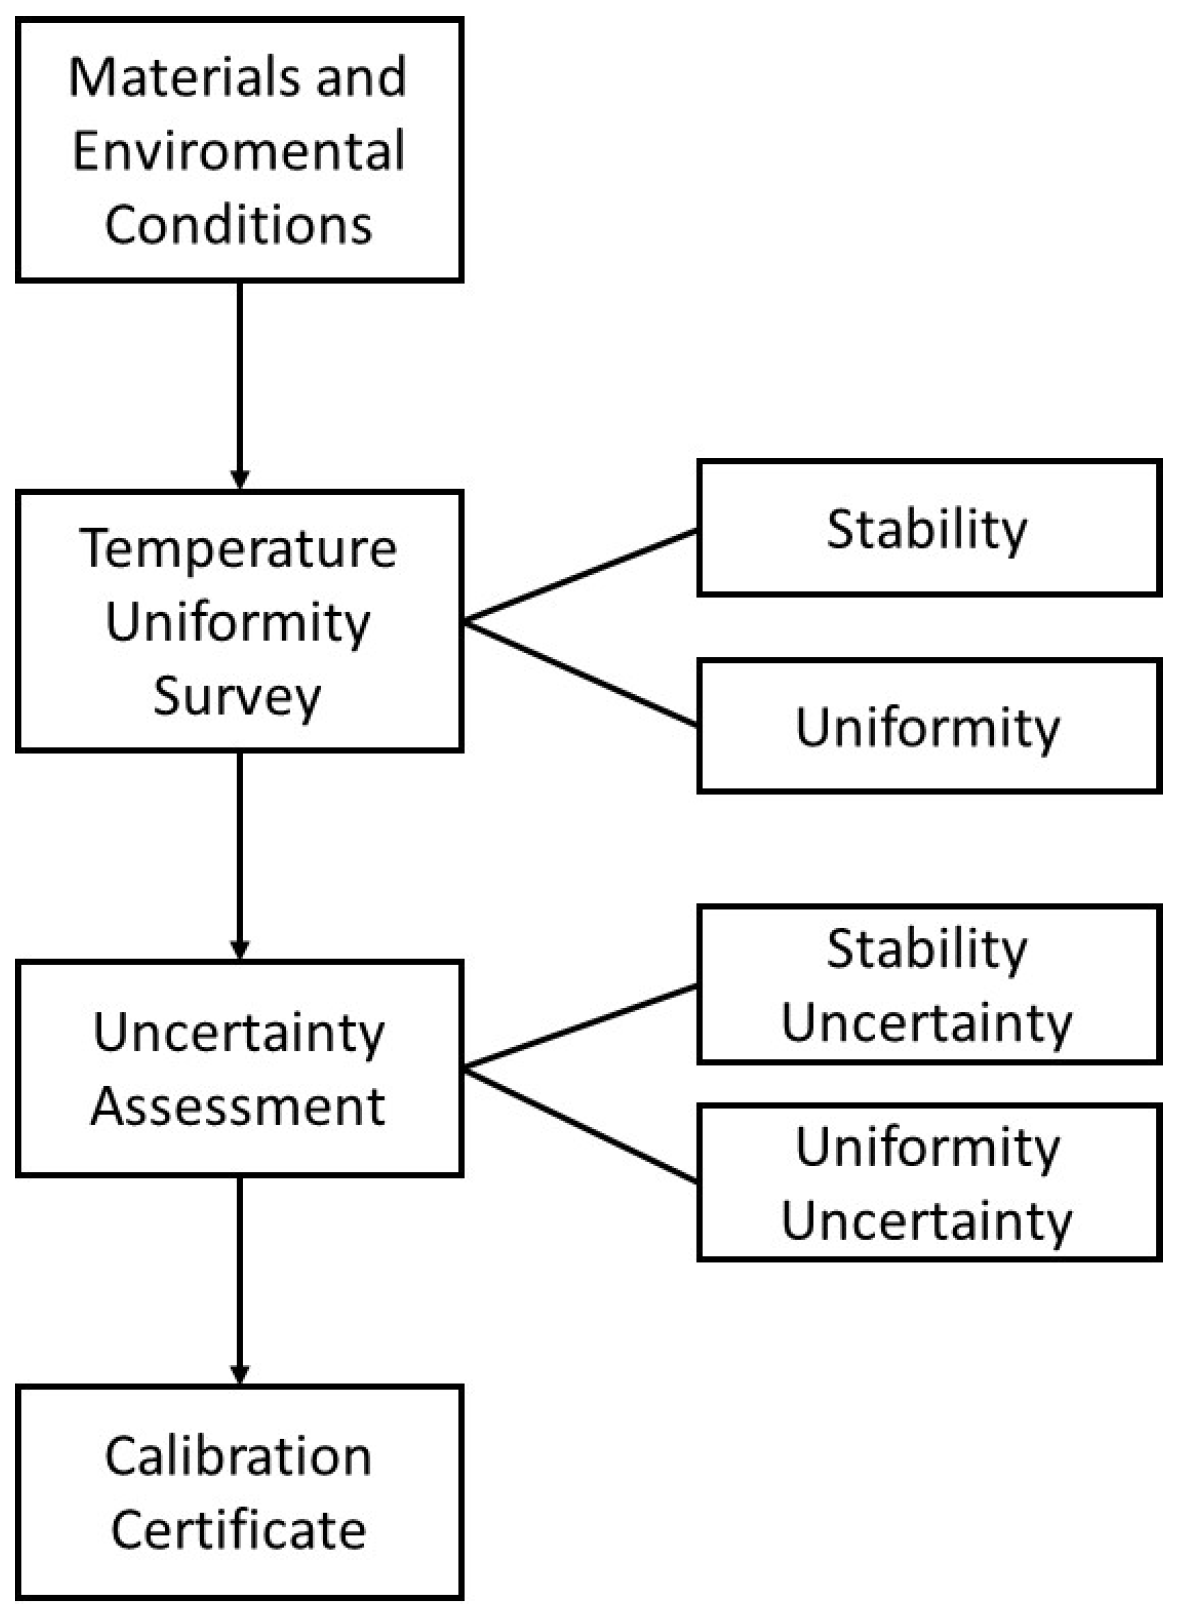
As presented in Figure 1, this section describes the materials used, the methodology carried out to perform the TUS and to the process of analysing the data to meet the AMS2750 requirements and ISO/IEC 17025 criteria for generating calibration certificates.
2.1. Materials
Four different types of thermal processing equipment were selected for the application of the methodology to systems with varying behaviours and working temperatures, with the aim of assessing the potential for reducing uncertainty components based on the obtained results. TUS was conducted for these four types of thermal equipment:
- An oven with an electric heating mode and automatic temperature control: The oven had two control zones, each with a capacity of 50 kW, and dimensions of 1.15 m × 1.5 m × 1.2 m, providing a working zone volume of 1.2 m3. According to aircraft specification AMS2750, the oven was classified as class 2. The equipment was supplied with two control probes (C1 and C2), four recording probes (R11, R12, R21 and R22) and two safety probes (S1 and S2).
- An autoclave with an electric heating mode and automatic temperature control: It had dimensions of 1.0 m × 0.8 m × 1.7 m, with a working zone volume of 0.63 m3. According to aircraft specification AMS2750, the autoclave was classified as class 2 and was equipped with one process sensor. (C).
- Thermal bath equipment with automatic temperature control and two process sensors (C and S): It had dimensions of 0.8 m × 0.6 m × 1.1 m, with a working zone volume of 0.5 m3. The equipment was supplied with one control probe (C) and one safety probe (S). According to aircraft specification AMS2750, the bath was classified as class 2.
- Refrigeration equipment with automatic control: The equipment was supplied with one control probe (C) and four recording probes (R1 and R2). It had dimensions of 3.0 m × 3.0 m × 2.5 m, with a working zone volume of 21.56 m3. According to aircraft specification AMS2750, the refrigeration equipment was classified as class 2.
These tests were carried out by the Electrical Metrology and Calibration Laboratory (EMCL) of the University of Cádiz, which has implemented an ISO/IEC 17025 system and is qualified by an accreditation body that is a member of the International Laboratory Accreditation Cooperation (ILAC). The laboratory is approved for conducting tests by the aerospace industry. The tests were conducted at the client’s facilities; therefore, all documentation regarding the thermal processing equipment to be tested and the necessary materials was made available on-site. The following instrumentation was used:
- A data acquisition instrument Fluke Hydra 2638A Hydra Series III, with a measurement capacity of 40 channels. This data logger contained inputs for various types of thermocouples and provided direct temperature readings.
- A calibrated expendable metal base test thermocouples that met the specifications and requirements of the applicable specifications, selected based on the test temperature of the thermal processing equipment.
- A Fluke 971 Temperature Humidity Meter for measuring environmental conditions.
All reference instrumentation which was used was calibrated with traceability assurance and had a valid calibration certificate, meeting the requirements of the applicable specification.
Additionally, a laptop computer equipped with specialized software for connecting to the data acquisition instrument, validated calculation software and various tools were available.
For temperature measurement, the specification allowed for the use of different sensor types. However, to minimize interference with production cycles during testing, expendable base metal thermocouples were employed. These thermocouples were purchased in the form of wire reels (Figure 2a), with lengths that did not exceed the maximum length permitted by the relevant specification (610 m). The calibration of the thermocouple reel was performed at both ends, ensuring that the temperature range and corrections met the requirements outlined in the applicable aeronautical specification. To enhance the accuracy of the measurements, the test thermocouples were required to adhere to tolerance class 1, as specified in the international standard IEC 60584-1 [29]. Tolerance class 1 represents the lowest possible tolerance class for different types of thermocouples, with specific tolerance values ranging from 0.5 °C for temperature values of −40 °C to 0.4% of the temperature value up to 1000 °C (whichever value is higher). The type of thermocouple chosen for each type of thermal processing equipment depends on the test temperature. The laboratory selected J-type thermocouples for the thermal bath equipment and autoclave, T-type thermocouples for the refrigeration equipment and N-type thermocouples for the oven.
For the preparation of the sensors, thermocouple cable sections were cut to the necessary length based on available information about the dimensions of the equipment being tested. This was carried out in such a way that the reference instrument to which they were connected remained separated from the thermal processing equipment and adequately ventilated during the test. The number of sensors was determined according to the requirements specified in the applicable standard specifications. For the thermal bath equipment, a set of mineral-insulated and sheathed thermocouples were used. Each sheath thermocouple was manufactured with a thermocouple from the same reel (Figure 2b). For the remaining thermal processing equipment, thermocouple wires were prepared. For each of the prepared thermocouples, a junction was made (Figure 2c). Each thermocouple set was then gathered to ensure its preservation and to protect it from damage such as folding, excessive exposure to moisture, corrosion, abrasion, external damage, etc. (Figure 2d).
Each set of thermocouples was identified with a code that allowed for unequivocal tracing of the coil from which it originated and the type of thermocouple. The laboratory utilised a specific code for each type of thermocouple along with a sequential code, ensuring that in the laboratory records, the code would be associated with the corresponding coil and its calibration certificate. Each thermocouple wire within the set was also individually identified. Sheathed thermocouples used in the thermal bath equipment were also individually identified. Since aeronautical regulations stipulate a maximum number of uses for expendable thermocouples, the thermocouple set identification label was utilised on the reverse side to track the usage of the set. For each type of thermal processing equipment, the number of thermocouples was selected according to the applicable standard.
Table 1 summarises the materials used for each test.
2.2. Environmental Conditions
The tests were required to be carried out under the normal operating conditions of the thermal processing equipment when used during production, with either real or simulated loads. For the oven test, a simulated production load was used (Figure 3). The environmental conditions in which the data acquisition system was located were verified to be within its working range. The Temperature Humidity Meter recorded a temperature within the range of 23 ± 5 °C and a relative humidity level of less than 70%.
2.3. Temperature Uniformity Survey
The thermocouples were prepared according to the specifications and placed into the thermal processing equipment by following the distribution conforming to the dimensions that defined the qualified working zone volume. To secure the thermocouples in place, wire rope was used, ensuring that the thermocouples would be free from any folds that could potentially damage them (Figure 4a,b).
The survey was conducted under normal thermal equipment operation conditions during production. All parameters used during the TUS reflected the normal operation of the equipment used during production. Subsequently, in accordance with the normal operation of each type of equipment, data collection commenced either prior to the first sensor reaching its lower tolerance limit or, if the temperature was pre-established, upon the introduction of the test load. Temperature readings from all test sensors were recorded 1 min from the beginning of the survey. Correction factors, taken from the calibration certificates, were applied to both the test sensors and the test instruments to compensate for the temperature data. The correction factor in a calibration certificate represents the difference between the standard’s value and that of the instrument being calibrated at each calibration point. As a result, corrected temperature values (Tij) were obtained, where i represents the position of each test thermocouple (1 ≤ i ≤ n) and j represents the recording time from the initial instant (ts) to the final instant (tf). From the beginning of the trial to its completion, readings of the process indicators were recorded at 1-minute intervals. The total trial duration (tf − ts) was divided into two intervals. The first interval was the stabilisation time (ts ≤ j ≤ te), i.e., the time elapsed from the start of data logging until all the test and process thermocouples stabilised above the lower tolerance specified by the applicable specification (te). The second interval (te < j ≤ tf) corresponded to the time during which the uniformity and stability test was conducted. After stabilisation, data collection continued for a minimum of 30 additional minutes.
AMS2750 specification established pass requirements for TUS. These requirements state that each corrected reading of the test sensor (Tij) and process sensors must fall within the temperature tolerance requirements during the uniformity period (te < j < tf). Specific specifications for different types of thermal processing equipment may include the calculation of other parameters, such as:
- Temperature overshoot: The number of degrees above the upper temperature tolerance for the applicable thermal processing equipment class by any sensor at any time.
- Recovery time: The elapsed time that the equipment, at the rated temperature, is loaded with the maximum load or a simulated representative of the production load, until it recovers the rated temperature once again. In other words, it is the time it takes for the test and process sensors to achieve the applicable lower tolerance (te − ts).
- Lag time: The elapsed time between the first test or process sensor and the last test or process sensor reaching the lower temperature tolerance.
- Relocation of hot or cold recording sensors: When the hot and cold temperature locations change within the equipment based on the readings from the most recent test, the hot and cold recording sensors may need to be relocated to reflect the new hot and cold locations within each qualified work zone.
Accreditation bodies require that laboratories with accreditation in temperature areas, in accordance with ISO/IEC 17025, assess the parameters for characterising the thermal processing equipment. The laboratory characterises the thermal equipment through stability and uniformity parameters.
- Stability: the maximum difference, after stabilization, between the maximum and minimum temperatures at any point in the workspace over a specified time interval.
- Uniformity: the maximum difference between the maximum mean value and the minimum mean value for each position in the workspace, obtained over time after stabilization.
2.4. Uncertainty Assessment
The AMS2750 specification does not explicitly state the need for uncertainty calculation. However, it does specify that pyrometry laboratories must have an ISO/IEC 17025 Quality System accredited by a regional body recognized by ILAC. Therefore, it is necessary to estimate the uncertainty of the measurements performed by analysing each component of uncertainty that is related to the thermal processing equipment, the instrumentation and the method used.
Based on the calibration guide with uncertainty calculation for temperature-controlled chambers [30,31] and the calibration of temperature block calibrators [32], the uncertainty calculation for the TUS was developed.
According to [18], the combined standard uncertainty of any magnitude under evaluation y, calculated by a measurement function from the measured values of some independent input variables, when they were not correlated to each other, was obtained as:
where is the standard uncertainty of the input variable and the partial derivatives are the sensitivity coefficients .
The uncertainty contribution of each input variable can be evaluated either as A-type (statistical analysis of series of observations) or as B-type (means other than the statistical analysis of repeated observations, e.g., based on manufacturer’s specifications or data provided in calibration certificates). Additionally, depending on its nature, every uncertainty term is associated with a specific probability distribution (normal, rectangular, triangular, trapezoidal, etc.).
A-type uncertainty contributions are usually computed from a set of N experimental data points, which are treated as they were scattered according to a normal distribution. And B-type uncertainty contributions are evaluated through instrument specifications and standard calibration certificates.
Finally, this combined standard uncertainty was multiplied by a coverage factor in order to obtain the final expanded uncertainty :
2.4.1. Stability Uncertainty
Stability was assessed based on Equation (1), which calculated the maximum difference between the maximum and minimum corrected temperature values at each position.
The model used to calculate the stability at a specific position was determined by subtracting the minimum temperature () from the maximum temperature () at that position:
The following corrections were taken into account: calibration correction, , drift, and homogeneity, of the thermocouple, calibration correction, , drift, and resolution and of the data acquisition instrument.
Grouping terms:
Since temperature readings at position i were performed using the same measuring system, in the same position and under the same conditions, the uncertainty of the applicable corrections for the thermocouple readings at position can be considered negligible.
However, for the estimation of stability uncertainty, the uncertainty of the measurement system’s resolution was taken into account. For the overall stability of the equipment, the maximum value of for all positions was considered, as described in Equation (7).
To determine the uncertainty of stability, the following components, shown in Table 2, were considered:
- Resolution uncertainty of the data acquisition instrument (): This is the uncertainty associated with the digital displays. The actual reading was equally likely between the lower and upper limits, assuming a rectangular distribution.
- Stability uncertainty in different positions (): Since stability was assessed at n different positions, for this component, the maximum standard deviation of the measurements at each position was considered, assuming a normal distribution.
Therefore, the expanded uncertainty of stability, with a coverage factor k = 2, was:
2.4.2. Uniformity Uncertainty
The model used to estimate the uniformity according to Equation (2) was:
where the following corrections were taken into account: calibration correction, , drift, and homogeneity, of the thermocouple, calibration correction, , drift, and resolution and of the data acquisition instrument. Also, the equipment’s stability at each position and the correction of the equipment’s uniformity over time were considered.
For uncertainty assessment, the following components, summarised in Table 3, were considered:
- Uncertainty of test thermocouples (): All thermocouples used in the tests met the requirement of Class 1 tolerance according to IEC 60584-1. This tolerance was considered as a rectangular distribution.
- Thermocouple drift uncertainty (): This is the uncertainty associated with the use of thermocouples. It was obtained as the drift of the thermocouples between tests, assuming a rectangular distribution.
- Uncertainty due to thermocouple inhomogeneity (): This component was evaluated as the difference between the deviation in calibration at the beginning and end of the thermocouple reel obtained from the calibration certificate, and was considered as a rectangular distribution. Reference [33] examines the standard uncertainty to be considered for different types of thermocouples as representative of the contribution of thermocouple inhomogeneity in the test. The values of inhomogeneity in the new thermocouple wire change as soon as the thermocouple is used; this degradation depends on the operating conditions, but can be quite rapid, especially for base metal thermocouples. It is important to avoid bends in the thermocouple wires and to ensure proper storage between uses. The EURAMET technical guide [34] describes the basic technical requirements for laboratories performing the evaluation of the service life and drift/stability of industrial thermocouples made of base and noble metals.
- Calibration uncertainty of the data acquisition instrument (): This is the uncertainty stated in the calibration certificate. The calibration of the instrument includes the internal compensation junction as a component of uncertainty in the measurement. This uncertainty can be considered as a normal distribution. The uncertainty was provided with a confidence level of 95% and a coverage factor k = 2.
- Drift uncertainty of the data acquisition instrument (): The accuracy data specified by the manufacturer for a one-year period were used, understanding that the instrument reading would fall within the upper and lower limits given by the specifications with equal probability. Therefore, it was considered as a rectangular distribution.
- Resolution uncertainty of the data acquisition instrument (): This is the uncertainty associated with the digital displays. The actual reading was equally likely between the lower and upper limits, assuming a rectangular distribution.
- Stability uncertainty in different positions (): Since stability was assessed at n different positions, for this component, the maximum standard deviation of the measurements at each position was considered, assuming a normal distribution.
- Uniformity uncertainty (): the maximum standard deviation obtained in each measurement record over time from te to tf, considered as a normal distribution.
Therefore, the expanded stability uncertainty, with a coverage factor k = 2, was:
3. Results
In the expression of the results, internationally accepted rounding rules in metrology [35] are applied, as indicated by the G revision of specification AMS2750. It is necessary to unify criteria in order to consistently consider measurement quantities and units according to the International System of Units adopted by BIPM.
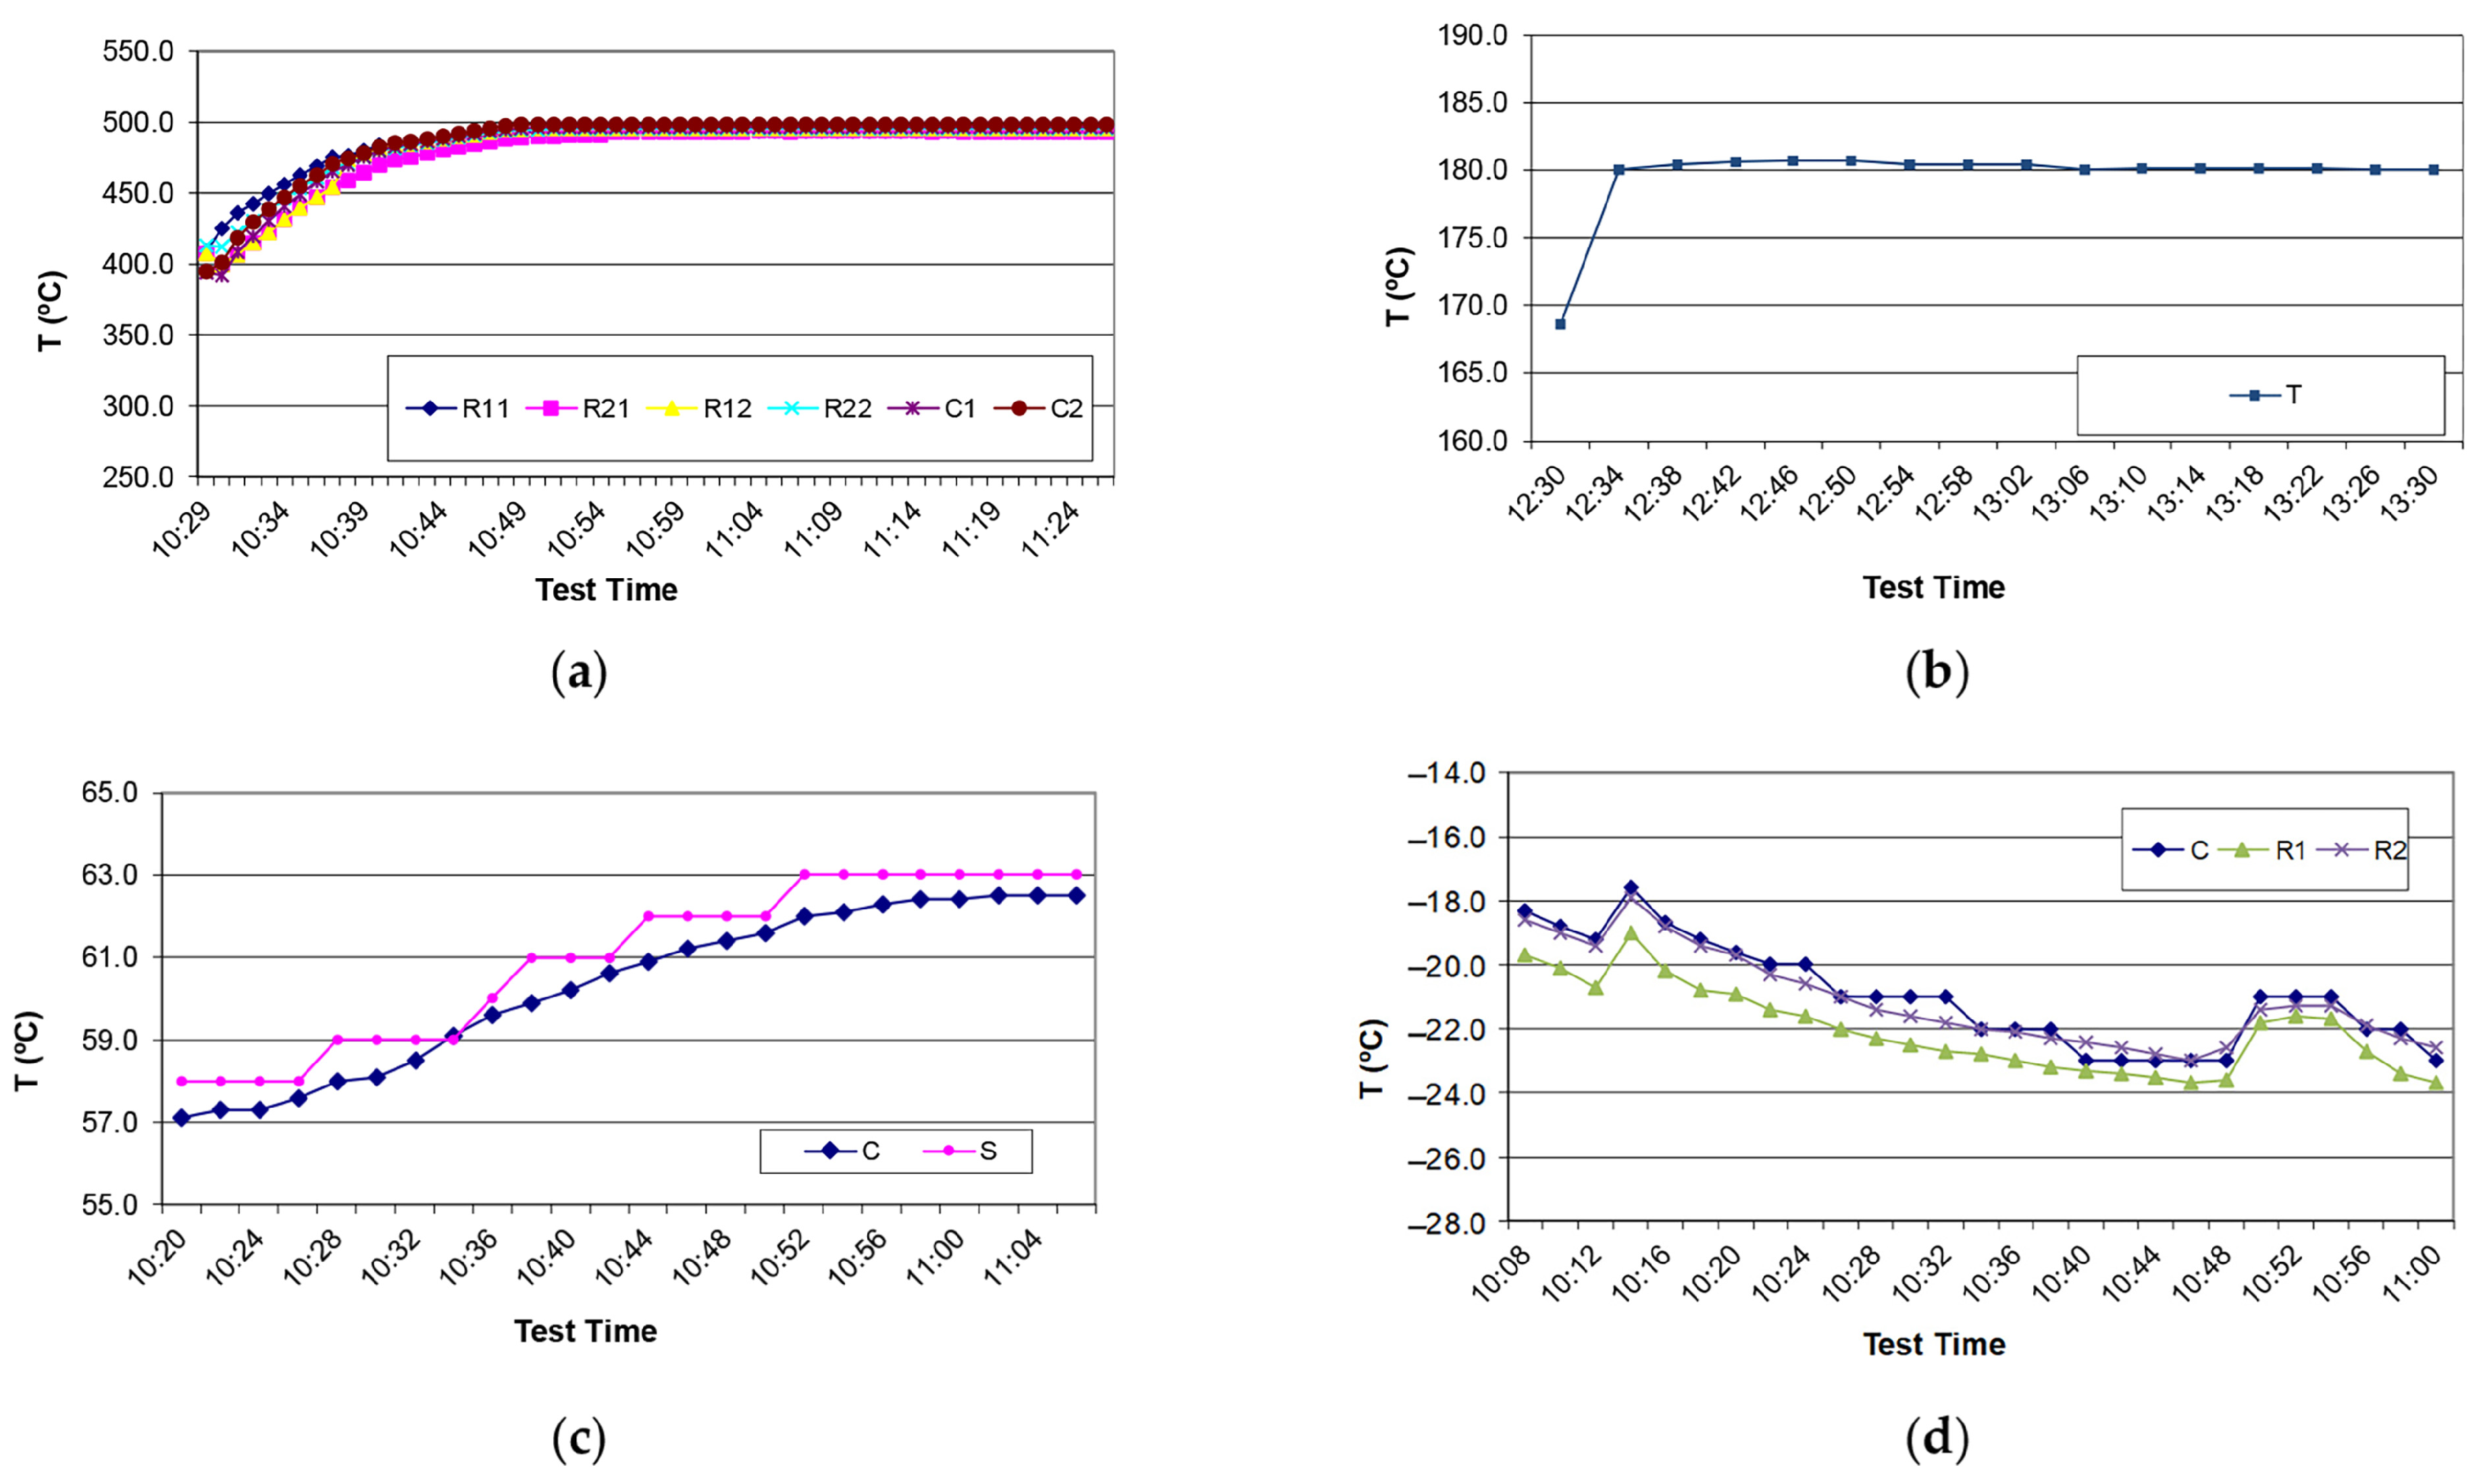
The temperature measurements were taken according to the described methodology by logging temperatures from ts to tf in each position. Figure 5 shows the results obtained for test thermocouple readings, and Figure 6 shows the results obtained for process thermocouple readings.
3.1. Results According to AMS2750
The parameters necessary to meet the requirements of the AMS2750 specification were evaluated. The maximum and minimum values of the test thermocouples at each position are provided (Table 4 for the oven, Table 5 for the autoclave, Table 6 for the bath and Table 7 for the refrigeration equipment). For the process and test thermocouple readings, it was verified that no overshoot occurred throughout the entire test period (ts to tf), and once the thermal processing equipment had stabilised (te to tf), all of the readings fell within the equipment‘s tolerance range (Table 8 for the oven, Table 9 for the autoclave, Table 10 for the bath and Table 11 for the refrigeration equipment).
All of the obtained results met the requirements of the specification; thus, the TUS complied with AMS2750.
3.2. Stability and Uniformity Results
According to Equations (1) and (2), a calculation of stability and uniformity was made for each type of equipment (Table 12):
3.3. Uncertainty Results
Considering the uncertainty components shown in Table 2 and Table 3, and according to Equations (8) and (10), the uncertainty calculations were performed for the results obtained for each type of thermal processing equipment. The stability uncertainty results are shown Table 13, and the uniformity uncertainty results are shown in Table 14.
According to Equations (8) and (10), the uniformity- and stability-expanded uncertainties of each type of thermal processing equipment are shown in Table 15.
4. Discussion
To analyse the results obtained regarding the uncertainties, the uncertainty components were grouped into three contributions:
- Thermocouple uncertainty (), which groups together the components of thermocouple calibration, thermocouple drift and thermocouple homogeneity;
- Data logger uncertainty (), which groups data logger calibration, data logger drifts and data logger resolution;
- Thermal processing equipment uncertainty (), which groups the components of stability and uniformity.
Table 16 shows the expanded uncertainty within each group and the percentage contribution of each of them to the expanded uncertainty.
The results show that the more significant uncertainty components in all types of thermal processing equipment were those associated with the thermocouple and the equipment (stability and uniformity), while the data logger uncertainty contribution was less significant to the results of expanded uncertainty.
The thermocouple uncertainty contribution carried significant weight in the final value. As a percentage, it varied between 30.1% in the refrigeration equipment and 51.9% in the autoclave, and was the highest in all equipment types except for the refrigeration equipment. The calibration and drift uncertainty components were considered with the same value in all tests. The difference lay in the homogeneity component. The highest thermocouple uncertainty contribution was from the oven (2.1756 K). Thermocouples with higher homogeneity levels than in other tests were used for this test. Reducing the thermocouple components should be the goal of manufacturers. The uncertainty component of a test thermocouple (Tct) can be reduced by considering the calibration uncertainty of the thermocouple as a normal distribution. In this case, the thermocouple calibration should be performed by laboratories that provide an uncertainty for test temperatures lower than the thermocouple’s tolerance class. The uncertainty due to thermocouple drift (Tdt) is associated with its usage. The AMS2750 specification allows for the reuse of disposable thermocouples, but one way to reduce this component is to use thermocouples for a single application, although this would considerably increase the cost of the process. The uncertainty due to thermocouple inhomogeneity (Tht) can only be reduced through improvements in the thermocouple manufacturing processes or by having reels shorter than the maximum length established in the aeronautical specification. The use of alternative sensor types with lower uncertainties is another aspect outlined in AMS2750 that the laboratory could explore.
The thermal processing equipment uncertainty contribution also carries significant weight in the result, and as depicted in Table 16, it exhibits considerable variation among different equipment types. As a percentage, it varied between 31.8% in the oven and 61.6% in the refrigeration equipment. These values were contingent upon the characteristics of each equipment and its maintenance. In these tests, it was observed that the refrigeration equipment exhibited the highest value of the uncertainty component (2.7362 K) attributed to the equipment. Table 12 illustrates that this equipment also demonstrated the highest levels of uniformity and stability (3.2 °C and 2.3 °C). Reducing this component (TS and TU) should be an objective of maintenance operations in industrial thermal processing equipment, achieved by enhancing their uniformity and stability.
Regarding the data logger instruments’ uncertainty components, both calibration (Tcd) and resolution components (Trd) had identical values across all tests. The variations in values among different types of thermal processing equipment are attributable to drift (Tdd). Drift components are more pronounced at high temperatures, as seen in the case of the oven (1.2557 K), as well as at low temperatures, as observed for the refrigeration equipment (1.0041 K). Improving the calibration procedure of the pyrometry laboratory and having traceability that provides better uncertainties could reduce the calibration component (Tcd). The uncertainty of drift (Tdd) could be minimized by conducting control checks between tests and establishing the drift obtained in this process as the limit of uncertainty with a rectangular distribution. Nevertheless, this verification would lead to reduced laboratory availability to serve the industry.
5. Conclusions
The AMS2750 specification, in its G revision, does not require the calculation of uncertainty for different tests, but it does mandate that laboratories be accredited according to the ISO 17025 standard, which implicitly includes this calculation. The compliance with measurement requirements only considers the measured value. It is possible that future revisions may also consider uncertainty, making it necessary to reduce these components and obtain more precise measurements.
Reducing thermocouples’ uncertainty components implies an enhancement of thermocouple manufacturing processes, while the reduction in data logger uncertainty components should be a goal for pyrometry laboratories. Similarly, a reduction in thermal equipment uncertainty components implies improvements in equipment maintenance processes.
This type of study should also be conducted for the Instrument Calibration and System Accuracy Test included in the AMS2750 specification.
Author Contributions
Conceptualization, C.G.-L. and G.Á.-T.; methodology, C.G.-L. and G.Á.-T.; software, C.G.-L.; validation, C.G.-L. and G.Á.-T.; formal analysis, C.G.-L.; investigation, C.G.-L. and G.Á.-T.; resources, C.G-L. and G.Á.-T.; data curation, C.G.-L. and G.Á.-T.; writing—original draft preparation, C.G.-L.; writing—review and editing, C.G.-L. and G.Á.-T.; visualization, C.G.-L. and G.Á.-T.; supervision, C.G.-L.; project administration, C.G.-L. All authors have read and agreed to the published version of the manuscript.
Funding
This research received no external funding.
Institutional Review Board Statement
Not applicable.
Informed Consent Statement
Not applicable.
Data Availability Statement
The data presented in this study are available upon request from the corresponding author.
Conflicts of Interest
The authors declare no conflict of interest.
References
- Blanco, D.; Rubio, E.M.; Lorente, R.; Sáenz-Nuño, M.A. Lightweight structural materials in open access: Latest trends. Materials 2021, 14, 6577. [Google Scholar] [CrossRef] [PubMed]
- BOEING. 2020 Boeing Global Environment Report. Available online: https://www.boeing.com/principles/sustainability (accessed on 21 June 2023).
- AIRBUS. Airbus Sustainability. Decarbonisation. Available online: https://www.airbus.com/en/sustainability/respecting-the-planet/decarbonisation/fleet-renewal (accessed on 21 June 2023).
- Saracyakupoglu, T. The Qualification of the Additively Manufactured Parts in the Aviation Industry. Am. J. Aerosp. Eng. 2019, 6, 1. [Google Scholar] [CrossRef]
- Saracyakupoglu, T. Certification Steps for the Additively Manufactured Aviation-Grade Parts. Eur. J. Res. Dev. 2022, 2, 33–42. [Google Scholar] [CrossRef]
- Williams, S.W.; Martina, F.; Addison, A.C.; Ding, J.; Pardal, G.; Colegrove, P. Wire + Arc additive manufacturing. Mater. Sci. Technol. 2016, 32, 641–647. [Google Scholar] [CrossRef]
- Li, X.; Zhao, W.; Li, L.; He, N.; Chi, S. Modeling and application of process damping in milling of thin-walled workpiece made of titanium alloy. Shock Vib. 2015, 2015, 431476. [Google Scholar] [CrossRef]
- Xu, J.; Mkaddem, A.; El Mansori, M. Recent advances in drilling hybrid FRP/Ti composite: A state-of-the-art review. Compos. Struct. 2016, 135, 316–338. [Google Scholar] [CrossRef]
- Luo, C.; Dong, F.; Guo, L. Study on Heat Treatment of Aerospace Aluminum Alloy Welded FSW. In Proceedings of the MATEC Web of Conferences, Sibiu, Romania, 7–9 June 2017; Volume 114, pp. 1–6. [Google Scholar] [CrossRef]
- Yumak, N.; Aslantas, K. A review on heat treatment efficiency in metastable β titanium alloys: The role of treatment process and parameters. J. Mater. Res. Technol. 2020, 9, 15360–16280. [Google Scholar] [CrossRef]
- Li, L.; Pan, X.; Liu, B.; Liu, B.; Li, P.; Liu, Z. Strength and Toughness of Hot- Rolled TA15 Aviation Titanium Alloy after Heat Treatment. Aerospace 2023, 10, 436. [Google Scholar] [CrossRef]
- AMS2750G, Pyrometry, Aeroespace Material Specification; SAE International: Warrendale, PA, USA, 2022.
- BAC5621 RevL, Temperature Control for Processing of Materials; BOEING: Arlington, VA, USA, 2017.
- M1089.1_Appendix C, Metrological Control of Airbus Operations S.L. Measurement Equipments; AIRBUS: Toulouse, France, 2017.
- BAERD GEN-007 RevD, Quality Control of Thermal Processing; BOMBARDIER: Montreal, QC, Canada, 2019.
- ISO/IEC 17025; General Requirements for the Competence of Testing and Calibration Laboratories. International Organization for Standardization (ISO): Geneva, Switzerland, 2017.
- BIPM. International vocabulary of metrology—Basic and general concepts and associated terms (VIM). In Tetrahedron Letters; Bureau International des Poids et Mesures (BIPM): Paris, France, 2008; Volume 58, p. 90. [Google Scholar]
- JCGM 100:2008 GUM; Evaluation of Measurement Data—Guide to the Expression of Uncertainty in Measurement. International Organization for Standardization Geneva: Geneva, Switzerland; Joint Committee for Guides in Metrology (JCGM): Paris, France; Bureau International des Poids et mesures (BIPM): Paris, France, 2008.
- EA-4/02 M; Evaluation of the Uncertainty of Measurement in Calibration. European Accreditation: Paris, France, 2022.
- García-López, C.; Álvarez-Tey, G. Evaluation of the Uncertainty of Surface Temperature Measurements in Photovoltaic Modules in Outdoor Operation. Sensors 2022, 22, 5685. [Google Scholar] [CrossRef] [PubMed]
- Pearce, J.V.; Edler, F.; Clliott, C.J.; Rosso, L.; Sutton, G.; Zante, R.; Machin, G. A European project to enhance process efficiency through improved temperature measurement: EMPRESS. In Proceedings of the 17th International Congress of Metrology, Paris, France, 21–24 September 2015; Volume 1, pp. 1–6. [Google Scholar] [CrossRef]
- Saraçyakupoğlu, T. Usage of Additive Manufacturing and Topology Optimization Process for Weight Reduction Studies in the Aviation Industry. Adv. Sci. Technol. Eng. Syst. J. 2021, 6, 815–820. [Google Scholar] [CrossRef]
- Filipponi, M.; Rossi, F.; Presciutti, A.; De Ciantis, S.; Castellani, B.; Carpinelli, A. Thermal analysis of an industrial furnace. Energies 2016, 9, 833. [Google Scholar] [CrossRef]
- Toma, A.; Frigioescu, T.; Badea, T.A.; Paraschiv, A.; Dumitru, C. Assessment of temperature uniformity and optimization of the heat treatment furnace working area. AIP Conf. Proc. 2022, 2522. [Google Scholar] [CrossRef]
- Machin, G.G.; Anhalt, K.; Batuello, M.; Bourson, F. The European project on high temperature measurement solutions in industry (HiTeMS)—A summary of achievements. Measurement 2016, 78, 168–179. [Google Scholar] [CrossRef]
- Hachem, E.; Jannoun, G.; Veysset, J.; Henri, M.; Pierrot, R.; Poitrault, I.; Massoni, E.; Coupez, T. Modeling of heat transfer and turbulent flows inside industrial furnaces. Simul. Model. Pract. Theory 2013, 30, 35–53. [Google Scholar] [CrossRef]
- Li, Q.; Wang, Y. Influencing Factors and Control Strategies of Heat Treatment Deformation of Metal Materials. J. Met. Mater. Res. 2018, 1, 2–5. [Google Scholar] [CrossRef]
- Zambaldi, E.; Magalhães, R.R.; Barbosa, B.H.G.; da Silva, S.P.; Ferreira, D.D. Low cost automated control for steel heat treatments. Appl. Therm. Eng. 2017, 114, 163–169. [Google Scholar] [CrossRef]
- IEC 60584-1:2013; Thermocouples—Part 1: EMF Specifications and Tolerances, ed. 3.0. International Electrotechnical Commission: Brussels, Belgium, 2013; ISBN 978-2-8322-1047-5.
- EURAMET. Guidelines on the Calibration of Temperature and/or Humidity Controlled Enclosures; Calibration Guide No. 20. Version 5.0; EURAMET: Brunswick, Germany, 2017; p. 12. [Google Scholar]
- The Society of Environmental Engineers. A Guide to Calculating the Uncertainty of the Performance of Environmental Chambers; The Society of Environmental Engineers: Buntingford, UK, 2003; p. 35. [Google Scholar]
- EURAMET. Guidelines on the Calibration of Temperature Block Calibrators; EURAMET: Brunswick, Germany, 2017. [Google Scholar]
- Machin, J.; Tucker, D.; Pearce, J.V. A comprehensive survey of thermoelectric homogeneity of commonly used thermocouple types. Meas. Sci. Technol. 2018, 29, 067002. [Google Scholar] [CrossRef]
- EURAMET. Guide on Lifetime and Drift/Stability Assessment of Industrial Thermocouples; EURAMET: Brunswick, Germany, 2015. [Google Scholar]
- ISO 80000-1+ Cor 1:2011; Quantities and Units. Part 1: General. International Organization for Standardization (ISO): Geneva, Switzerland, 2011.
Figure 1.
Methodology.

Figure 2.
Thermocouples used in the test: (a) wire reel expandable base metal thermocouple; (b) mineral-insulated sheathed thermocouples; (c) thermocouple set; (d) thermocouple junctions.
Figure 2.
Thermocouples used in the test: (a) wire reel expandable base metal thermocouple; (b) mineral-insulated sheathed thermocouples; (c) thermocouple set; (d) thermocouple junctions.

Figure 3.
Simulated load for the oven test.

Figure 4.
(a) Location of thermocouples in the oven; (b) thermocouple-fixing detail to avoid folds.

Figure 5.
Test thermocouple temperature. (a) Oven; (b) autoclave; (c) thermal bath equipment; (d) refrigeration equipment.
Figure 5.
Test thermocouple temperature. (a) Oven; (b) autoclave; (c) thermal bath equipment; (d) refrigeration equipment.

Figure 6.
Process thermocouple temperature. (a) Oven; (b) autoclave; (c) thermal bath equipment; (d) refrigeration equipment.
Figure 6.
Process thermocouple temperature. (a) Oven; (b) autoclave; (c) thermal bath equipment; (d) refrigeration equipment.


Table 1.
Materials used in each test.
| Thermal Equipment | AMS2750 Classification | Working Zone Volume | Test Temperature | Thermocouple Type | Sets of Thermocouple | Number of Thermocouples | Wire Length |
|---|---|---|---|---|---|---|---|
| Oven | Class 2 | 1.2 m3 | 495.0 °C | N-type | Wire | 13 | 40 m |
| Autoclave | Class 2 | 0.63 m3 | 180.0 °C | J-type | Wire | 9 | 10 m |
| Thermal bath equipment | Class 2 | 0.5 m3 | 60.0 °C | J-type | Sheathed | 9 | -- |
| Refrigeration equipment | Class 2 | 21.6 m3 | −23.0 °C | T-type | Wire | 19 | 18 m |
Table 2.
Stability uncertainty components.
| Uncertainty Sources | Value (°C) | Distribution | Sensitivity Coefficients | Divider | Standard Uncertainty (k = 1) (K) |
|---|---|---|---|---|---|
| Data logger resolution | rectangular | 1 | |||
| Stability | normal | 1 | 1 |
Table 3.
Uniformity uncertainty components.
| Uncertainty Sources | Value (°C) | Distribution | Sensitivity Coefficients | Divider | Standard Uncertainty (k = 1) (K) |
|---|---|---|---|---|---|
| Thermocouple calibration | rectangular | 1 | |||
| Thermocouple drift | rectangular | 1 | |||
| Thermocouple homogeneity | rectangular | 1 | |||
| Data acquisition instrument calibration | normal | 1 | 2 | ||
| Data acquisition instrument drift | rectangular | 1 | |||
| Data acquisition instrument resolution | rectangular | 1 | |||
| Stability | normal | 1 | 1 | ||
| Uniformity | normal | 1 | 1 |
Table 4.
Summary of measurements from te (oven).
| Location 1 | Location 2 | Location 3 | Location 4 | Location 5 | Location 6 | Location 7 | |
|---|---|---|---|---|---|---|---|
| Tmax | 497.4 °C | 497.2 °C | 497.0 °C | 495.4 °C | 497.5 °C | 497.4 °C | 496.9 °C |
| Tmin | 496.8 °C | 496.8 °C | 496.7 °C | 494.8 °C | 497.3 °C | 496.9 °C | 496.4 °C |
| Location 8 | Location 9 | Location 10 | Location 11 | Location 12 | Location 13 | ||
| Tmax | 497.1 °C | 497.2 °C | 496.9 °C | 497.5 °C | 495.1 °C | 496.6 °C | |
| Tmin | 496.3 °C | 496.6 °C | 496.3 °C | 497.3 °C | 494.8 °C | 496.2 °C |
Table 5.
Summary of measurements from te (autoclave).
| Location 1 | Location 2 | Location 3 | Location 4 | Location 5 | Location 6 | Location 7 | |
|---|---|---|---|---|---|---|---|
| Tmax | 184.3 °C | 184.6 °C | 183.3 °C | 184.5 °C | 182.9 °C | 183.5 °C | 184.1 °C |
| Tmin | 183.4 °C | 183.0 °C | 182.5 °C | 183.2 °C | 182.4 °C | 182.9 °C | 183.6 °C |
| Location 8 | Location 9 | ||||||
| Tmax | 184.7 °C | 184.3 °C | |||||
| Tmin | 183.8 °C | 183.8 °C |
Table 6.
Summary of measurements from te (thermal bath equipment).
| Location 1 | Location 2 | Location 3 | Location 4 | Location 5 | Location 6 | Location 7 | |
|---|---|---|---|---|---|---|---|
| Tmax | 62.9 °C | 63.0 °C | 63.0 °C | 63.0 °C | 63.2 °C | 62.9 °C | 62.9 °C |
| Tmin | 60.4 °C | 60.4 °C | 60.4 °C | 60.4 °C | 60.6 °C | 60.0 °C | 60.0 °C |
| Location 8 | Location 9 | ||||||
| Tmax | 63.3 °C | 62.9 °C | |||||
| Tmin | 60.6 °C | 60.1 °C |
Table 7.
Summary of measurements from te (refrigeration equipment).
| Location 1 | Location 2 | Location 3 | Location 4 | Location 5 | Location 6 | Location 7 | |
|---|---|---|---|---|---|---|---|
| Tmax | −19.8 °C | −19.7 °C | −19.6 °C | −20.5 °C | −18.6 °C | −18.7 °C | −19.8 °C |
| Tmin | −22.3 °C | −22.2 °C | −22.0 °C | −22.0 °C | −20.3 °C | −20.6 °C | −21.9 °C |
| Location 8 | Location 9 | Location 10 | Location 11 | Location 12 | Location 13 | Location 14 | |
| Tmax | −20.2 °C | −20.2 °C | −19.1 °C | −20.1 °C | −19.0 °C | −19.6 °C | −20.5 °C |
| Tmin | −22.9 °C | −23.1 °C | −21.1 °C | −23.3 °C | −20.8 °C | −21.3 °C | −22.5 °C |
| Location 15 | Location 16 | Location 17 | Location 18 | Location 19 | |||
| Tmax | −19.6 °C | −19.8 °C | −19.0 °C | −20.7 °C | −19.6 °C | ||
| Tmin | −21.9 °C | −20.8 °C | −20.7 °C | −23.3 °C | −21.9 °C |
Table 8.
Overshoot verification (oven).
| Required | Obtained | Result | |
|---|---|---|---|
| Overshoot | 500.0 °C | 499.1 °C | PASS |
| Tmax | 500.0 °C | 497.5 °C | PASS |
| Tmin | 490.0 °C | 494.8 °C | PASS |
Table 9.
Overshoot verification (autoclave).
| Required | Obtained | Result | |
|---|---|---|---|
| Overshoot | 185.0 °C | 184.8 °C | PASS |
| Tmax | 185.0 °C | 184.7 °C | PASS |
| Tmin | 175.0 °C | 182.4 °C | PASS |
Table 10.
Overshoot verification (thermal bath equipment).
| Required | Obtained | Result | |
|---|---|---|---|
| Overshoot | 65.0 °C | 63.3 °C | PASS |
| Tmax | 65.0 °C | 63.3 °C | PASS |
| Tmin | 55.0 °C | 60.0 °C | PASS |
Table 11.
Overshoot verification (refrigeration equipment).
| Required | Obtained | Result | |
|---|---|---|---|
| Overshoot | −28.0 °C | −23.3 °C | PASS |
| Tmax | −18.0 °C | −18.1 °C | PASS |
| Tmin | −28.0 °C | −23.3 °C | PASS |
Table 12.
Stability and uniformity results.
| Thermal Equipment | TS (°C) | TU (°C) |
|---|---|---|
| Oven | 0.7 | 0.3 |
| Autoclave | 1.6 | 0.7 |
| Thermal bath equipment | 2.8 | 2.6 |
| Refrigeration equipment | 3.2 | 2.3 |
Table 13.
Stability uncertainty results.
| Thermal Equipment | Uncertainty Sources | Value (°C) | Standard Uncertainty (k = 1) (K) |
|---|---|---|---|
| Oven | Data logger resolution | 0.1000 | |
| Stability | 0.1702 | ||
| Autoclave | Data logger resolution | 0.1000 | |
| Stability | 0.4125 | ||
| Thermal bath | Data logger resolution | 0.1000 | |
| equipment | Stability | 0.9052 | |
| Refrigeration | Data logger resolution | 0.1000 | |
| equipment | Stability | 0.8611 |
Table 14.
Uniformity uncertainty results.
| Thermal Equipment | Uncertainty Sources | Value (°C) | Standard Uncertainty (k = 1) (K) |
|---|---|---|---|
| Oven | Thermocouple calibration | 1.5000 | |
| Thermocouple drift | 0.7000 | ||
| Thermocouple homogeneity | 0.9000 | ||
| Data logger calibration | 0.6000 | ||
| Data logger drift | 0.9500 | ||
| Data logger resolution | 0.1000 | ||
| Stability | 0.1702 | ||
| Uniformity | 0.8414 | ||
| Autoclave | Thermocouple calibration | 1.5000 | |
| Thermocouple drift | 0.7000 | ||
| Thermocouple homogeneity | 0.0300 | ||
| Data logger calibration | 0.6000 | ||
| Data logger drift | 0.5300 | ||
| Data logger resolution | 0.1000 | ||
| Stability | 0.4125 | ||
| Uniformity | 0.6998 | ||
| Thermal bath | Thermocouple calibration | 1.5000 | |
| equipment | Thermocouple drift | 0.7000 | |
| Thermocouple homogeneity | 0.5000 | ||
| Data logger calibration | 0.6000 | ||
| Data logger drift | 0.4300 | ||
| Data logger resolution | 0.1000 | ||
| Stability | 0.9052 | ||
| Uniformity | 0.3212 | ||
| Refrigeration | Thermocouple calibration | 1.5000 | |
| equipment | Thermocouple drift | 0.7000 | |
| Thermocouple homogeneity | 0.0600 | ||
| Data logger calibration | 0.6000 | ||
| Data logger drift | 0.6900 | ||
| Data logger resolution | 0.1000 | ||
| Stability | 0.8611 | ||
| Uniformity | 1.0631 |
Table 15.
Stability- and uniformity-expanded uncertainty results.
| Thermal Equipment | U(TS) (K) | U(TU) (K) |
|---|---|---|
| Oven | 0.4 | 3.1 |
| Autoclave | 0.9 | 2.7 |
| Thermal bath equipment | 1.9 | 2.9 |
| Refrigeration equipment | 1.8 | 3.5 |
Table 16.
Contribution of each uncertainty component to the expanded uncertainty.
| Thermal Equipment | Thermocouple Uncertainty Contribution | Data Logger Uncertainty Contribution | Thermal Equipment Uncertainty Contribution | |||
|---|---|---|---|---|---|---|
| Ratio | Ratio | Ratio | ||||
| Oven | 51.1% | 17.0% | 31.8% | |||
| Autoclave | 51.9% | 10.6% | 37.5% | |||
| Thermal bath equipment | 48.1% | 7.5% | 44.5% | |||
| Refrigeration equipment | 30.1% | 8.3% | 61.6% | |||
Disclaimer/Publisher’s Note: The statements, opinions and data contained in all publications are solely those of the individual author(s) and contributor(s) and not of MDPI and/or the editor(s). MDPI and/or the editor(s) disclaim responsibility for any injury to people or property resulting from any ideas, methods, instructions or products referred to in the content. |
© 2023 by the authors. Licensee MDPI, Basel, Switzerland. This article is an open access article distributed under the terms and conditions of the Creative Commons Attribution (CC BY) license (https://creativecommons.org/licenses/by/4.0/).
Share and Cite
MDPI and ACS Style
García-López, C.; Álvarez-Tey, G. Uncertainty Assessment in Temperature Uniformity Survey of Thermal Processing Equipment According to AMS2750 Aerospace Specification. Aerospace 2023, 10, 915. https://doi.org/10.3390/aerospace10110915
AMA Style
García-López C, Álvarez-Tey G. Uncertainty Assessment in Temperature Uniformity Survey of Thermal Processing Equipment According to AMS2750 Aerospace Specification. Aerospace. 2023; 10(11):915. https://doi.org/10.3390/aerospace10110915
Chicago/Turabian StyleGarcía-López, Carmen, and Germán Álvarez-Tey. 2023. "Uncertainty Assessment in Temperature Uniformity Survey of Thermal Processing Equipment According to AMS2750 Aerospace Specification" Aerospace 10, no. 11: 915. https://doi.org/10.3390/aerospace10110915
Note that from the first issue of 2016, this journal uses article numbers instead of page numbers. See further details here.