Plasma-Assisted Control of Supersonic Flow over a Compression Ramp


1
Department of Aerospace and Mechanical Engineering, University of Notre Dame, Notre Dame, IN 46556, USA
2
Department of Aeronautics and Astronautics, The University of Tokyo, Tokyo 113-8656, Japan
*
Author to whom correspondence should be addressed.
†
These authors contributed equally to this work.
Aerospace 2019, 6(3), 35; https://doi.org/10.3390/aerospace6030035
Submission received: 13 February 2019
/
Revised: 6 March 2019
/
Accepted: 7 March 2019
/
Published: 12 March 2019
Abstract
:This study considers the effect of an electric discharge on the flow structure near a 19.4° compression ramp in Mach-2 supersonic flow. The experiments were conducted in the supersonic wind tunnel SBR-50 at the University of Notre Dame. The stagnation temperature and pressure were varied in a range of 294–600 K and 1–3 bar, respectively, to attain various Reynolds numbers ranging from 5.3 × 10⁵ to 3.4 × 10⁶ based on the distance between the exit of the Mach-2 nozzle and the leading edge of the ramp. Surface pressure measurements, schlieren visualization, discharge voltage and current measurements, and plasma imaging with a high-speed camera were used to evaluate the plasma control authority on the ramp pressure distribution. The plasma being generated in front of the compression ramp shifted the shock position from the ramp corner to the electrode location, forming a flow separation zone ahead of the ramp. It was found that the pressure on the compression surface reduced almost linearly with the plasma power. The ratio of pressure change to flow stagnation pressure was also an increasing function of the ratio of plasma power to enthalpy flux, indicating that the task-related plasma control effectiveness ranged from 17.5 to 25.
1. Introduction
Active flow control is one of the most promising methodologies for improving the aerodynamic characteristics of supersonic transport vehicles. A supersonic flow field is dominated by shock waves, and thus their formation and interaction with the boundary layer is an essential aspect of flow control to attain a desirable flow field around the vehicle [1]. A micro vortex generator, or a micro ramp composed of triangular obstacles with a forward-facing compression ramp, has been studied both at supersonic [2] and hypersonic speeds [3] as a flow modification method. It provides a means of controlling boundary layer separation and shock-induced separation by forming an adverse pressure gradient along the surface. Supersonic flow over a compression ramp geometry has been studied for decades [4,5] because the ramp geometry is employed in aerodynamic shapes. The compression ramp can be regarded as a geometry composed of a supersonic vehicle body with its flap deflected outwards. The compression surface forms a shock wave which changes the pressure distribution and flow field in the vicinity of the ramp compared to the surface without a ramp. An important characteristic of supersonic flow over a compression ramp is the formation of flow separation and unsteadiness of the separation shock ahead of the ramp [6,7,8]. Shock wave interaction with the supersonic boundary layer upstream of the ramp provides various flow field patterns depending on the ramp angles [9]. Flow separation and unsteadiness of the separation shock wave significantly affect the aerodynamic forces acting on flaps.
The control methods for the flow field over a compression ramp have been investigated from various viewpoints. Micro air jets [10] were studied as a means of controlling such a flow field with separation and oblique shock waves in front of the compression ramp at Mach-2 by introducing a pressure increase and wall-normal momentum addition to change the flow field ahead of the ramp. In recent years, another flow control method employing electric discharges has been gaining research attention. Plasma-based flow actuators have several significant advantages over conventional mechanical actuators [11,12] with deflecting surfaces such as flaps. Electric actuation has a shorter response time and provides rapid flow control operation with a time scale in the order of a characteristic gas-dynamic time. Electrodes flush-mounted on the surface provide a robust installation, since electric actuator lacks movable parts and is not protruding into the flow. The rapid response feature is highly beneficial to the prevention of operational delay when generating aerodynamic moments, especially for high speed vehicles such as supersonic/hypersonic transports. A supersonic vehicle may travel a few kilometers if the aerodynamic control is delayed for just a second or two, which may lead to deviation from the optimum trajectory. However, if the delay in aerodynamic control is reduced by plasma-assisted flow control, it will be profitable to keep close to the desired course, reducing fuel consumption.
In [13,14,15,16] and other publications, the plasma-based technique and the mechanisms of the plasma–flow interaction were examined in supersonic flow. It was found that the near-surface electric discharge is well applicable for the purposes of the modification of surface pressure distribution, flow field pattern, and shock wave formation. The quasi-DC (Q-DC) electric discharge [15] forms filamentary plasma penetrating in the streamwise direction, which intensely and locally heats the gas, leading to a volumetric expansion and shock wave generation. The Q-DC electric discharge was also found to have great effectiveness in ignition and flame holding in scramjet engines [17], flow modification inside a flame holding cavity [18], boundary layer modification [19], inlet control [20], and oblique shock wave control [21,22].
In this study, the plasma actuator was placed upstream of a body–flap geometry, which has been found to be beneficial for the pitching moment control of high-speed vehicles. Watanabe and Suzuki investigated Mach-7 hypersonic flow control ahead of a 20° compression ramp geometry [23,24]. A schematic of such an approach is shown in Figure 1. As illustrated in Figure 1a, in these Mach-7 studies, a pair of electrodes were installed in front of a ramp geometry to replicate a simplified form of a space vehicle surface with a body flap on the downstream side. In this plasma actuation concept, plasma generation leads to flow separation and subsequently changes the pressure distribution over the flap/ramp, as shown in Figure 1b. Plasma actuation, applied to the 20° ramp geometry, rapidly changed the pitching moment acting on the ramp surface, reducing it by 10–20% within 0.09 s. The main research interest of the current work was the experimental study of the Q-DC electric discharge employed upstream of a ramp geometry in the Mach-2 airflow.
For the purpose of applying this plasma-assisted flow control method for the aerodynamic control of actual supersonic vehicles, it was necessary to clarify its flow control characteristics with a multielectrode system arranged in the crossflow/spanwise direction. A preliminary study [25] was conducted to examine the Reynolds number effects on flow control authority. The objective of the current work was to examine changes in flow structure, ramp pressure (which is an indicator of force acting on a flap), and plasma power to correlate ramp pressure change with plasma and flow parameters.
2. Experimental Facility and Instrumentation
2.1. Supersonic Wind Tunnel
Experiments were carried out in the supersonic blow-down wind tunnel SBR-50 at the University of Notre Dame. An image of the wind tunnel facility is shown in Figure 2. The wind tunnel is composed of a high-pressure reservoir, plenum chamber with an ohmic heater, Mach-2 supersonic nozzle, test section, and a vacuum tank. The plenum chamber pressure can be adjusted by increasing the pressure from the high-pressure reservoir and by heating the air, but the actual stagnation pressure is identified based on the static pressure at the nozzle exit. In the present configuration, Mach-2 supersonic flow is realized at the test section, which has a 76.2 mm × 76.2 mm rectangular cross section at the nozzle exit and a 1° half-angle expansion along the top and bottom walls to compensate the growth of boundary layers. The stagnation temperature can be varied from room temperature up to 800 K. The stagnation pressure can be controlled from 0.1–5 bar as per requirement. The flow duration is 1 s at maximum. In the present work, the stagnation pressure P0 ranged from 1–3 bars and the stagnation temperature T0 varied from 294–600 K. By changing stagnation temperature and pressure, various Reynolds number conditions were achieved, with Reynolds number values ranging from 5.3 × 10⁵ to 3.4 × 10⁶ based on the characteristic distance of 85 mm—measured from the nozzle exit to the leading edge of the compression ramp along the flat test section wall. While the flow at the test section was steady, plasma-assisted flow control was applied for 0.1 s.
2.2. Compression Ramp Model
The schematics of the ramp model are illustrated in Figure 3. Eleven electrodes were flush-mounted on the wall in a spanwise direction, with 5 anodes and 6 cathodes arranged in an alternating fashion. A 19.4° ramp with a height of 10.9 mm was attached to the test section wall with its leading edge 30 mm downstream of the electrodes, as illustrated in Figure 3a. The ramp surface was made from a 1 mm thick alumina 96 ceramic plate to protect the model from the high-temperature air heated by plasma. There are pressure measurement ports along the center line and their location is indicated in Figure 3a. The ramp angle of 19.4° was selected to match a previous experiment in reference [24] that was tested at Mach-7. The ramp model was fixed in the test section as shown in Figure 3b. Both side walls are equipped with windows made of quartz to allow for optical diagnostics. Due to the 1° test section wall expansion, the Mach number is slightly increased over the distance, making the effective flow Mach number 2.04 at the ramp.
2.3. Measurements and Visualization
Flow visualization, pressure measurement, and measurement of the plasma power were performed during the wind tunnel tests for the purpose of clarifying the changes to the flow field induced by plasma.
Flow field structure and shock wave visualization was conducted by schlieren imaging to examine the change of flow structure due to plasma actuation. A Basler ace acA2040-180kmNIR camera (Basler AG, Ahrensburg, Germany) with a 2048 × 2048 pixel sensor was employed to capture high-definition images at a frame rate of 133 fps. The effective exposure time for each image was less than 1 μs—the duration of the pulsed near-infrared (NIR) laser diode used for illumination (Laser Components LS8-10-150-s10-00). Each frame in the schlieren video essentially “freezes” the flow, allowing for a clear instantaneous view of turbulent structures.
Pressure measurements were taken using a differential pressure sensor, the TE NetScannerTM Model 9116. The reference pressure of this sensor was kept at atmospheric pressure in the wind tunnel laboratory. Pressure data were recorded at a sampling rate of 400 Hz. In this work, there were 4 pressure ports that were especially important in evaluating the effect of plasma actuation. As illustrated in Figure 3a,b, the freestream pressure port measures the wall pressure at the nozzle exit, which is used to identify the actual stagnation pressure value by assuming the designed Mach number of the nozzle to be 2.0. The middle pressure port (port 1), located between the electrode array and the ramp provides pressure value just at the downstream side of electrodes. Two pressure ports, port 2 and port 3, are located on the ramp surface to provide pressure force information acting on the ramp/flap surface and hence, pressure at these points is the direct indicator of the plasma actuation effect over the compression ramp.
A custom-made power supply [15] was used in the present flow-control experiments. Simplified schematics of the electrical circuit and typical voltage waveforms at each point are shown in Figure 4. In this circuit, a high-voltage power supply and capacitor bank are connected to 5 anodes through current-limiting resistors, Ra, as illustrated in Figure 4a. Six cathodes are wired to the ground level through current-limiting resistors, Rc. Total voltage supplied from the circuit, Vps, was recorded with an oscilloscope (DSO-X 4024A, Agilent Technologies, Santa Clara, CA, USA) through high-voltage probes at a sampling rate of 800 kHz. Anode and cathode voltage, Va and Vc, were also measured. Typical voltage traces for these voltage measurements are shown in Figure 4b. These voltages were used to calculate average plasma power. The average plasma power, Wpl, was calculated in 3 steps as follows: (1) Total current I is calculated based on anode current Ia as I = Na·Ia = Na·(Vps − Va)/Ra, where Na = 5 denotes the number of anodes and Ra = 1 kΩ is the resistance of each anode resistor. (2) Then, the plasma power at each moment Ppl is calculated by Ppl = (Va − Vc)·Ia. (3) By integrating Ppl, the deposited plasma energy Epl = ∫Ppl dt is obtained. Since the slope of Epl during plasma actuation was found to increase almost linearly, the average plasma power Wpl was finally identified by applying linear fitting to the Epl plot as in Figure 4d. In typical plots shown in Figure 4b–d, the average plasma power was found to be 6.9 ± 0.2 kW.
3. Results and Discussion
A snapshot image of the plasma filaments is shown in Figure 5. The supersonic flow moves from left to right and the plasma filament was convected downstream to form the U-shaped discharge path. Although periodical change in the location of the transverse portion of the plasma filaments was confirmed in the images, the change in the position of the streamwise portion of filaments was negligible. This pattern occurred because a separation zone formed ahead of the ramp on the downstream side of the electrodes. The transverse filament was partially trapped in the separation and exhibited periodical change.
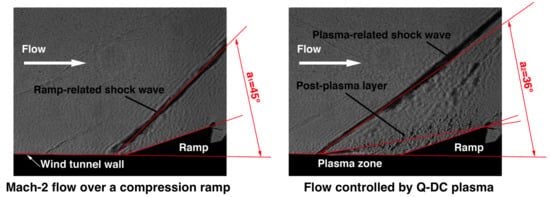
Due to significant gas heating near/within the plasma filaments, it was expected that the flow field would be modified in the vicinity of the ramp. The schlieren images in Figure 6 provide a clear insight into the flow structure modification by plasma actuation. The flow structure exhibited significant change in shock wave positions and angle. The plasma-related shock wave oscillated because of the motion of the plasma filaments, but its position remained at almost the same location when averaged in time. Without plasma actuation, the shock wave at the ramp formed at 45° to the wall, illustrated as a1 in Figure 6a. This shock wave originated slightly ahead of the leading edge of the ramp. This is because the selected ramp angle of 19.4° was close to critical shock detachment angle of 23° for Mach-2.04. Since there was a 1° wall inclination and −0.3° boundary layer expansion, the actual turn angle of Mach-2.04 supersonic flow was 19.4° − (1° − 0.3°) = 18.7°. According to the oblique shock relation for the Mach number, and turn- and wave angles, the wave angle to the flow was calculated as 49.8°, and thereby the wave angle to the wall was 49.8° + 0.3° = 50.1°. This angle was greater than a1 = 45° measured from the schlieren image because of a small separation zone that formed in front of the ramp’s leading edge. When the plasma was turned on, the shock location shifted upstream and formed ahead of the electrode row, as shown in Figure 6b. The plasma-induced shock wave had the angle a2 = 36° to the wall. Due to a separation zone formed between plasma and the ramp, the turn angle of the flow was estimated to be 9.8°, as shown in Figure 6b, and the effective turn angle became 9.8° − (1° − 0.3°) = 9.1°. From the oblique shock relation, the wave angle was calculated to be 37.5° to the flow, and thereby 37.5° + 0.3° = 37.8° to the wall, which was slightly larger than the angle a2 = 36° measured from the schlieren image. The difference in measured shock angles and those calculated from theoretical relation is explained by the fact that the separation zone had a more complex shape than a plane wedge, representing a gradually increased effective angle. The resulting shape of the shock wave was also curved, demonstrating a higher angle further into the freestream, see Figure 6b.
The significant change in shock locations, as shown in Figure 6, suggests that there was a remarkable pressure change at the rear side of the electrodes and along the surface of the compression ramp. Typical pressure timeseries are shown in Figure 7. A pressure increase was observed downstream of the electrodes, which was consistent with past studies without the ramp [15]. A significant pressure drop was observed along the surface of the ramp at ports 2 and 3. This is clear evidence that the plasma actuation ahead of a ramp (flap) can control pressure force and thereby cause a change in the pitching moment acting on the flaps. It should be noted that the pressure curves of ports 2 and 3 were almost identical and hence, and separation ahead of the ramp was insignificant without plasma actuation. In the following results and discussion, the pressure drop on the ramp surface was evaluated based on the pressure at port 2 and quantified according to the definition of pressure decrease illustrated in Figure 7b.
The flow parameters were varied independently to form the test matrix: P0 = 1, 2, 3 bar and T0 = 294, 400, 500, and 600 K. This led to variation in plasma power in the range of 2.5–11.8 kW and an appropriate pressure decrease on the ramp. Figure 8 shows the pressure effect vs. average plasma power. The uncertainty of the pressure change reading was almost 10 mbar, represented as error bars in the plot. Since the pressure change value was always negative, the y axis denotes −ΔP (mbar). The fill color of the dots in Figure 8 indicates the stagnation pressure in each test case and a circle at the origin illustrates the no-plasma case with no pressure change. Figure 8 demonstrates that the ramp pressure change was linearly dependent on the average plasma power. An increase in plasma power produces an increase in the heat energy deposited to the flow, this intense and local heating proceeds through multiple relaxation pathways to a pressure increase, and thus an increase in plasma power increases the flow control effect over the ramp [15]. It should be noted that the gray shaded area in Figure 8, indicating a low plasma–power zone with Wpl < 2.1 kW, corresponds to an unstable discharge pattern because of insufficient electric power to maintain steady plasma filaments. There was also a trend of the ramp pressure impact (−ΔP) increasing with an increase in stagnation pressure, which implies that the pressure change ratio −ΔP/Pstatic could be an important parameter correlated against other flow control parameters.
Since the pressure change ratio −ΔP/Pstatic is a non-dimensional parameter, a correlation was found between another non-dimensional parameter related to plasma power. Figure 9 shows the relation between pressure change ratio −ΔP/Pstatic and relative plasma power Wpl/(h0·ṁ), where h0 is the specific enthalpy of the freestream and ṁ denotes the mass flux through the wind tunnel test section. The uncertainty of −ΔP/Pstatic was (2–7) × 10−2 depending on the stagnation pressure. Figure 9 shows that the pressure change ratio gradually increased with an increase in relative plasma power. The curve fit with a power curve was also illustrated in Figure 9.
The main focus of this study was the pressure control on the ramp, and the quantity of the pressure change ratio divided by the relative plasma power, η = [−ΔP/Pstatic]/[Wpl/(h0·ṁ)], can be defined as “task-related effectiveness”. The straight line, η = 1 in Figure 9, shows the task-related effectiveness to be unity. In all tests, η was always higher than 1 and almost attained 25 at lower relative power. At a higher relative power of around 0.02, η was higher than 1 and reached around 17.5, but the increment decreased within the scope of plasma power attained in this study.
4. Conclusions
Plasma-assisted flow control over a 19.4° compression ramp was examined with Mach-2 supersonic wind tunnel experiments using quasi-DC electric discharge flow parameters in the range of P0 = 1–3 bar and T0 = 294–600 K. It was concluded that the pressure force on a ramp surface can be reduced by 9–16% with the aid of plasma actuation. The pressure increase on the surface in front of the ramp was observed to be 20–60%. Schlieren visualization showed that the shock angle at the ramp without plasma actuation was about 45° to the flow direction, which was smaller than the angle obtained by oblique shock relations because the shock attachment point was located slightly upstream of the ramp’s leading edge. When plasma actuation was applied, the shock position moved upstream to the electrode location, forming an oblique shock with an angle of approximately 36°, which was almost equal to but slightly smaller than the angle of 37.8°, calculated based on a visibly equivalent geometric shape. Within the scope of the test conditions, the ramp pressure decrease was linearly dependent on the plasma power. The pressure change ratio was a rise function of the relative plasma power attaining a task-related effectiveness, η, of 17.5–25.
Within the range of the test parameters, no relation was found between the plasma control effect and the Reynolds number. Further research will assume a wider range of the flow Reynolds number to extend the test conditions to the laminar and transitional operation mode.
Author Contributions
Conceptualization, Y.W. and S.B.L.; methodology, Y.W. and S.B.L.; investigation, Y.W., A.H., and S.B.L.; resources, Y.W. and S.B.L.; data curation, Y.W., A.H., and S.B.L.; writing—original draft preparation, Y.W.; writing—review and editing, Y.W., A.H., and S.B.L.; visualization, Y.W.; supervision, S.B.L.; project administration, Y.W. and S.B.L.; funding acquisition, Y.W.
Funding
This research was funded by JSPS Grant-in-Aid for Young Scientists, grant number 16K18307, and by JSPS Grant-in-Aid for Early-Career Scientists, grant number 18K13923.
Acknowledgments
The first author appreciates the financial support from JSPS Overseas Research Fellowships.
Conflicts of Interest
The authors declare no conflict of interest.
References
- Verma, S.B.; Hadjadj, A. Supersonic flow control. Shock Waves 2015, 25, 443–449. [Google Scholar] [CrossRef] [Green Version]
- Holden, H.; Babinsky, H.H. Effect of Microvortex Generators on Separated Normal Shock/Boundary Layer Interactions. J. Aircraft 2007, 44, 170–174. [Google Scholar] [CrossRef]
- Saad, M.R.; Zare-Behtash, H.; Che-Idris, A.; Kontis, K. Micro-Ramps for Hypersonic Flow Control. Micromachines 2012, 3, 364–378. [Google Scholar] [CrossRef] [Green Version]
- Settles, G.S.; Fitzpatrick, T.J.; Bogdonoff, S.M. Detailed Study of Attached and Separated Compression Corner Flowfields in High Reynolds Number Supersonic Flow. AIAA J. 1979, 17, 579–585. [Google Scholar] [CrossRef]
- Settles, G.S.; Vas, I.E.; Bogdonoff, S.M. Details of a Shock-Separated Turbulent Boundary Layer at a Compression Corner. AIAA J. 1976, 14, 1709–1715. [Google Scholar] [CrossRef]
- Dolling, D.S.; Murphy, M.T. Unsteadiness of the Separation Shock Wave Structure in a Supersonic Compression Ramp Flowfield. AIAA J. 1983, 21, 1628–1634. [Google Scholar] [CrossRef]
- Dolling, D.S.; Brusniak, L. Separation shock motion in fin, cylinder, and compression ramp - Induced turbulent interactions. AIAA J. 1989, 27, 734–742. [Google Scholar] [CrossRef]
- Verma, S.B. Experimental study of flow unsteadiness in a Mach 9 compression ramp interaction using a laser schlieren system. Meas. Sci. Technol. 2003, 14, 989–997. [Google Scholar] [CrossRef]
- Wu, Y.; Yi, S.; He, L.; Chen, Z.; Zhu, Y. Flow visualization of Mach 3 compression ramp with different upstream boundary layers. J. Vis. 2015, 18, 631–644. [Google Scholar] [CrossRef]
- Verma, S.B.; Manisankar, C. Shockwave/Boundary-Layer Interaction Control on a Compression Ramp Using Steady Micro Jets. AIAA J. 2012, 50, 2753–2764. [Google Scholar] [CrossRef]
- Shang, J.S.; Surzhikov, S.T.; Kimmel, R.; Gaitonde, D.; Menart, J.; Hayes, J. Mechanisms of plasma actuators for hypersonic flow control. Prog. Aero. Sci. 2005, 41, 642–668. [Google Scholar] [CrossRef]
- Fomin, V.M.; Tretyakov, P.K.; Taran, J.-P. Flow control using various plasma and aerodynamic approaches (Short review). Aerosp. Sci. Technol. 2004, 8, 411–421. [Google Scholar] [CrossRef]
- Falempin, F.; Firsov, A.A.; Yarantsev, D.A.; Goldfeld, M.A.; Timofeev, K.; Leonov, S.B. Plasma control of shock wave configuration in off-design mode of M = 2 inlet. Exp. Fluids 2015, 56. [Google Scholar] [CrossRef]
- Hedlund, B.; Houpt, A.; Gordeyev, S.; Leonov, S. Measurement of Flow Perturbation Spectra in Mach 4.5 Corner Separation Zone. AIAA J. 2018, 56, 2699–2711. [Google Scholar] [CrossRef]
- Houpt, A.; Hedlund, B.; Leonov, S.; Ombrello, T.; Carter, C. Quasi-DC electrical discharge characterization in a supersonic flow. Exp. Fluids 2017, 58. [Google Scholar] [CrossRef]
- Leonov, S.B.; Adamovich, I.V.; Soloviev, V.R. Dynamics of near-surface electric discharges and mechanisms of their interaction with the airflow. Plasma Sources Sci. Technol. 2016, 25, 063001. [Google Scholar] [CrossRef]
- Leonov, S.; Houpt, A.; Elliott, S.; Hedlund, B. Ethylene Ignition and Flameholding by Electrical Discharge in Supersonic Combustor. J. Propul. Power 2018, 34, 499–509. [Google Scholar] [CrossRef]
- Houpt, A.; Leonov, S.; Hedlund, B.; Ombrello, T.; Carter, C. Supersonic Cavity-Based Flow Control Using a Quasi-DC Discharge. IOP Conf. Ser. Mater. Sci. Eng. 2017, 249, 012007. [Google Scholar] [CrossRef] [Green Version]
- Yan, H.; Gaitonde, D. Effect of thermally induced perturbation in supersonic boundary layers. Phys. Fluids 2010, 22, 064101. [Google Scholar] [CrossRef]
- Yan, H. Near-Surface Discharge in Supersonic Inlet Control. In Proceedings of the 51st AIAA Aerospace Sciences Meeting including the New Horizons Forum and Aerospace Exposition, Grapevine, TX, USA, 7–10 January 2013. AIAA 2013-0530. [Google Scholar] [CrossRef]
- Yan, H.; Liu, F.; Xu, J. Oblique Shock Control by Surface Arc Discharge Plasma. In Proceedings of the 8th AIAA Flow Control Conference, AIAA Aviation Forum, Washington, DC, USA, 13–17 June 2016. AIAA 2016-3776. [Google Scholar] [CrossRef]
- Yan, H.; Liu, F.; Xu, J. Study of Oblique Shock Wave Control by Surface Arc Discharge Plasma. AIAA J. 2018, 56, 532–541. [Google Scholar] [CrossRef]
- Watanabe, Y.; Suzuki, K. Investigation of Arc Plasma Discharge in Hypersonic Flow over Compression and Expansion Corner. In Proceedings of the 44th AIAA Plasmadynamics and Lasers Conference, Fluid Dynamics and Co-located Conferences, San Diego, CA, USA, 24–27 June 2013. AIAA 2013-3130. [Google Scholar] [CrossRef]
- Watanabe, Y.; Suzuki, K. Aerodynamic Control Effect of Surface DC Plasma Discharge at Mach-7 Hypersonic Flow. In Proceedings of the 46th AIAA Plasmadynamics and Lasers Conference, Dallas, TX, USA, 22–26 June 2015. AIAA 2015-2342. [Google Scholar] [CrossRef]
- Watanabe, Y.; Leonov, S.B.; Houpt, A.; Hedlund, B.E.; Elliott, S. Plasma-Assisted Control of Mach-2 Flowfield over Ramp Geometry. IOP Conf. Ser. Mater. Sci. Eng. 2017, 249, 012006. [Google Scholar] [CrossRef] [Green Version]
Figure 1.
Schematic diagram of plasma-assisted flow control at electrodes installed in front of deflected flap (ramp).
Figure 1.
Schematic diagram of plasma-assisted flow control at electrodes installed in front of deflected flap (ramp).

Figure 2.
Photograph of the SBR-50 supersonic wind tunnel at the University of Notre Dame.

Figure 3.
Compression ramp model: (a) Test arrangement and compression ramp geometry; (b) photograph of the model ramp in the test section.
Figure 3.
Compression ramp model: (a) Test arrangement and compression ramp geometry; (b) photograph of the model ramp in the test section.


Figure 4.
Electrical circuit and typical plots of electric parameters: (a) Schematics of electrical circuit and measured voltages; (b) voltage traces; (c) anode current; (d) plot of deposited plasma energy and linear fit result.
Figure 4.
Electrical circuit and typical plots of electric parameters: (a) Schematics of electrical circuit and measured voltages; (b) voltage traces; (c) anode current; (d) plot of deposited plasma energy and linear fit result.

Figure 5.
Snapshot view of plasma filament with high-speed imaging, 100 µs exposure time.

Figure 6.
Typical snapshot images of schlieren visualization: (a) Flow without plasma actuation; (b) shifted shock wave ahead of plasma.
Figure 6.
Typical snapshot images of schlieren visualization: (a) Flow without plasma actuation; (b) shifted shock wave ahead of plasma.

Figure 7.
Pressure timeseries in typical test: (a) Pressure variation during wind tunnel test; (b) definition of pressure decrease.
Figure 7.
Pressure timeseries in typical test: (a) Pressure variation during wind tunnel test; (b) definition of pressure decrease.

Figure 8.
Plasma power effect on pressure control.

Figure 9.
Task-related effectiveness η.

© 2019 by the authors. Licensee MDPI, Basel, Switzerland. This article is an open access article distributed under the terms and conditions of the Creative Commons Attribution (CC BY) license (http://creativecommons.org/licenses/by/4.0/).
Share and Cite
MDPI and ACS Style
Watanabe, Y.; Houpt, A.; Leonov, S.B. Plasma-Assisted Control of Supersonic Flow over a Compression Ramp. Aerospace 2019, 6, 35. https://doi.org/10.3390/aerospace6030035
AMA Style
Watanabe Y, Houpt A, Leonov SB. Plasma-Assisted Control of Supersonic Flow over a Compression Ramp. Aerospace. 2019; 6(3):35. https://doi.org/10.3390/aerospace6030035
Chicago/Turabian StyleWatanabe, Yasumasa, Alec Houpt, and Sergey B. Leonov. 2019. "Plasma-Assisted Control of Supersonic Flow over a Compression Ramp" Aerospace 6, no. 3: 35. https://doi.org/10.3390/aerospace6030035
Note that from the first issue of 2016, this journal uses article numbers instead of page numbers. See further details here.