
Investigation of the Appropriate Reverberation Time in Learning Spaces for Elderly People Using Speech Intelligibility Tests

1
Department of Architectural Engineering, Chungbuk National University, Cheongju 28644, Korea
2
Korea Institute for Local Educational Finance, Sejong 30130, Korea
*
Author to whom correspondence should be addressed.
Buildings 2022, 12(11), 1943; https://doi.org/10.3390/buildings12111943
Submission received: 11 October 2022
/
Revised: 21 October 2022
/
Accepted: 7 November 2022
/
Published: 10 November 2022
(This article belongs to the Special Issue Acoustics of Buildings)
Abstract
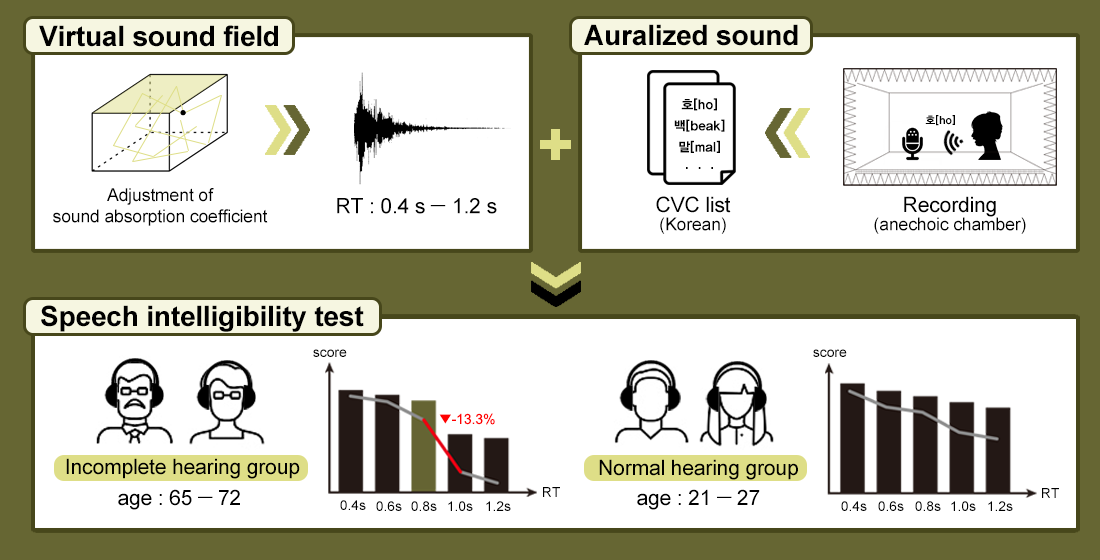
:The Republic of Korea is currently an aging society, and it will enter an ultra-aging society in 2025. This study aimed to investigate the undesignated appropriate reverberation time of learning spaces for elderly people in Korea. For this purpose, a virtual sound field was created, and the anechoic sounds were convoluted with the virtual sound field to control the reverberation time via absorption rate adjustments. Using a virtual sound field, auralized materials were made which have five different conditions with a reverberation time ranging from 0.4 s to 1.2 s. Speech intelligibility tests were conducted in both elderly and young people using headphones. Consonant–Vowel–Consonant (CVC) tests were undertaken. Preliminary experiments were performed to adjust the difficulty levels of speech intelligibility via normal young adults. The test order was nonsequential, and the sound output level was 60 dB(A). As a result, the test scores were found to decrease with an increase in the reverberation time. In addition, it was revealed that the test scores fell by 32.4% compared with the scores of normal adults under the same reverberation conditions. When the reverberation time was longer than 0.8 s, the test score was reduced by up to 13.3%; therefore, learning spaces for elderly people may require reverberation times shorter than 0.8 s. If the proposed reverberation time were applied to learning spaces for the elderly, it is believed that it could provide an appropriate sound environment for the elderly.

1. Introduction
In all learning spaces, learning activities such as speaking and listening are performed based on speech transmission. Learning in these spaces is accomplished through the teacher’s voice, and it is important for learners to understand the content of speech-based lessons perfectly. Therefore, ensuring a high-quality sound environment for a learning space, such as a lecture room, is essential. The reverberation time (RT60) is a representative factor in the measurement of speech intelligibility based on sound. Sabine identified the decay rate as the reverberation time and defined it as the time taken by sound to decrease by 60 dB from its value at termination [1]. The RT60 is generally calculated by doubling the estimated RT30. The appropriate RT60 differs depending on the purpose and size of the space. In a space built for speech transmission, such as a lecture room, a longer RT60 causes unclear speech transmission [1]. Therefore, a high RT60 in a learning space built for speech transmission may interfere with the learners’ speech perception.
Many studies have concluded that factors such as RT60 affect academic performance [2]. In Korea, speech intelligibility tests were conducted for middle- and high-school students, and the RTmid conditions to be met in a specific volume of middle and high schools were presented [3]. The RTmid is the average of the RT60 at 500–1000 Hz. The appropriate RT60 in a space where classes were conducted, mainly in Korean, was less than 0.8 s, whereas it was found to be more than 1.0 s in actual lecture rooms [4,5]. Nablek reported that in foreign countries, speech intelligibility test results were higher when RT60 was shorter in a noisy environment with impact noise [6]. Recently, it was suggested that not only academic achievement but also the convenience of listening should be considered in this regard. Thus, the RT60 has been demonstrated to have a significant effect on the listening effort (LE) [7]. In addition, to provide an appropriate sound environment to learners using the learning space, guidelines for classroom acoustic performance standards and designs are essential [8]. In this regard, there is a guideline that proposes a lecture room acoustic evaluation model based on an analytic hierarchy process.
Currently, acoustic performance standards and guidelines for lecture rooms in the United States and the United Kingdom have been established based on the RT60 and the background noise. The acoustic performance standards used in the United States and the United Kingdom are listed in Table 1 and Table 2 [9,10].
In Denmark, Norway, and Chile, the RT60 standard for learning spaces is set to 0.6 s; in Germany, France, Italy, China, and Malaysia, it is set to 0.8 s. In other countries, it is set between 0.4 s to 1.2 s, depending on the volume of the lecture room and the student’s age. Certain countries, such as South Africa and India, still do not have established RT60 standards for learning spaces [11,12,13,14]. However, the standards in Korea proposed thus far are based on individuals who are over 12 years of age and have a normal hearing ability; the standard for individuals whose hearing is either not fully developed or degenerated has not been established yet.
According to the “2021 elderly statistics,” the current proportion of the elderly population in the Republic of Korea is already at 16.5%, and it is expected to reach 20.3% by 2025 [15]. The Republic of Korea will become an ultra-aging society if it continues to grow at the same rate. Therefore, novel and continuous learning must be enabled for the aging population such that they may be able to participate in social activities or lead the youth in social and economic fields with their capacity as members of society. However, the hearing capacity of people over 65 years of age gradually declines compared with that of individuals with normal hearing abilities. As age increases, hearing decline intensifies [16]. A study conducted on a 7-point Likert scale of the hearing comparison between elderly adults and young adults found that elderly adults required a higher amount of listening effort than young adults [17]. The elderly group scored significantly lower on the dichotic digits test, particularly in the left ear, than the adult group [18]. Although the elderly have a lower spatial performance than young adults, they can still benefit from the spatial separation of sound sources [19]. Thus, even if learning spaces for elderly people are adapted to the RT60 standard for middle- and high-school students, as is currently proposed in Korea, it may not be appropriate for elderly people with poor speech perception abilities.
A prior physical and subjective investigation of learning spaces for the elderly was conducted in four classrooms in two lifelong education centers, A and B, where both small and large classrooms were used [20]. It was found that the measured RT60 of the four learning spaces for the elderly satisfied the standard for Korean middle- and high-school classrooms. The measured RT60 values are shown in Figure 1.
Currently, there are no standardized learning spaces for the elderly in Korea. This is because there are no professional learning spaces for the elderly, and different learning spaces are used for each program. Because learning spaces for the elderly are not standardized, there are differences in the size of lecture rooms depending on the size of the lifelong education center or the elderly welfare center in each region. Furthermore, because learning spaces are not standardized, the volume of the lecture rooms that directly affect the RT60 differs from place to place; thus, appropriate acoustic standards are required in learning spaces for the elderly.
Based on prior investigations, the present study intended to perform a speech intelligibility test for standard listening spaces under various acoustic conditions. Overall, the purpose of the present study was to investigate the RT60 of learning spaces for elderly people; to suggest an appropriate RT60; to provide a suitable sound environment; and to support continuous learning for the elderly, which is essential in an aging society. In the present study, people over 65 years of age who suffered from hearing loss were called “incomplete-hearing people.” The hearing-impaired groups differed from the groups in the present study. The incomplete-hearing group included people with no medical hearing problems that exhibited a decreased hearing ability due to old age.
2. Experimental Method
The present study investigated the appropriate RT60 for learning spaces for the elderly. The RT60 factor was used to control the speech intelligibility tests. Accordingly, the procedure was performed in three steps. First, a virtual sound field was developed using a computer-aided design (CAD) model and the Odeon to assign RT60 to the auralized sound sources. Since there were no standardized lecture rooms for the elderly, the experiment followed the average specifications measured through prior investigation. The accuracy of the manufactured virtual sound field was evaluated using parameters such as RT60, D50, and speech transmission index (STI). Second, auralized sound was produced through the developed virtual sound field under five reverberation conditions (0.4, 0.6, 0.8, 1.0, and 1.2 s). Five reverberation conditions were set based on the results of the preliminary experiment. Third, speech intelligibility tests were performed on the incomplete-hearing and normal-hearing groups in random order. The test materials used in the speech intelligibility tests were Consonant–Vowel–Consonant (CVC) tests. For the speech intelligibility test results, statistical significance was confirmed through T-Test and ANOVA.
2.1. Creation of a Virtual Sound Field
In Korea, there are no standardized learning spaces for the elderly. Therefore, in the present study, two rooms (room C and D) were used for speech intelligibility tests. Room C is a room in C Lifelong Education Center. Room D is a lecture room in D University. Among two rooms (room C and D), room D was selected as the model of virtual sound field since room D is the standard size of classrooms in Korea. Room D exhibited similar room conditions (including volume) to room C. Therefore, room D was set as the room for the virtual sound field for the production of auralized sound. The specifications of each room are listed in Table 3. The virtual sound field was manufactured by 3D modeling using a CAD program as illustrated in Figure 2. The manufactured 3D model was exported to Odeon program to form a virtual sound field. A detailed geometric shape was made to improve the accuracy of the Odeon simulation. This is because the more angularly the room is reflected, the more accurate the simulation that is possible in the Odeon simulation [21]. If there was very simple modeling of tables and chairs, scattering coefficient used would be around 0.7, which is the maximum scattering coefficient applicable to rough surfaces [22,23]. However, in the present study, tables and chairs were made using very detailed modeling, and the scattering coefficient of the desk and chair was set to 0.05.
A human-shaped (persons) sound source was used to determine the impulse response of the virtual sound field. “BB93_RAISED_NATURAL.SO8” in Table 4 is the set value of the human-shaped (persons) sound source in Odeon [24]. In addition, the NC curve value from Odeon was set to NC 30 to control background noise in the virtual sound field [25]. NC values and transition orders were set to make the virtual sound field similar to the actual environment. In addition, after importing CAD files to the Odeon program, it was confirmed that all the sound existed in the sound field through Odeon’s 3D billiard function.
The interior finishing material for the virtual sound field was set using the Odeon software as listed in Table 5 [26]. The finishing material settings were based on actual finishing materials. In particular, to develop classrooms based on five different RT60 values, the ceiling and walls were covered with materials with the same sound absorption coefficients for all frequencies. Accordingly, five virtual rooms were established with different RTsim values. All rooms featured similar RTsim values at all frequencies.
Generally, room acoustic studies based on Odeon simulations only use actual materials. However, several other cases in the previous study were similar to this study. (1) Materials with equal sound absorption coefficients at all frequencies were used to set the experimental environment [27,28]. (2) Despite the use of actual materials, a similar RT60 was obtained at all frequencies [29,30]. However, these virtual rooms differ from actual environments. Therefore, the result was presented as RTmid, so that it could be applied in an actual environment.
The calculated acoustic parameters of the manufactured virtual sound field are presented in Table 6. A virtual sound field was produced for five cases of RTsim from 0.4 s to 1.2 s. The D50 and STI values decreased as RTsim increased. Generally, the space for speech transmission requires a D50 value of 0.50–0.60 [1]. STI is used as an indicator of speech transmission, such as a lecture. The values of the STI range from 0 to 1, with 0.45–0.60 indicating “Fair,” 0.60–0.75 indicating “Good,” and 0.75 or higher indicating “Excellent” [31]. Impulse responses were recorded at all frequencies. Among five virtual sound fields, the acquired impulse responses at 1000 Hz with RTsim of 0.8 s are displayed in Figure 3.
2.2. Creation of Auralized Sounds
The order of production of the auralized sound was as follows: (1) Announcer voice recording in an anechoic room. (2) Recorded file outputting from virtual sound field using a human-shaped sound source. (3) Production of auralized sound convoluting the anechoic sound with each impulse response. Table 7 lists the equipment used to produce the auralized sounds [3]. Figure 4 shows flow diagram of auralized sound production. Auralized sounds were produced with different RTsim values in virtual sound fields based on different sound absorption coefficients, materials, and NC values. The auralized sounds used in the speech intelligibility test were CVC sounds.
3. Speech Intelligibility Test Method
3.1. Speech Intelligibility Test Setting
The item tools of the speech intelligibility test conducted in the present study were the CVC tests proposed in ASA S 3.2 [32]. In the present study, Korean syllables were used as the test materials [33,34,35]. By employing the abovementioned methods, the present study intended to compare and test the speech perception performance of the incomplete-hearing group and the normal hearing group through a speech intelligibility test. Figure 5 illustrates the speech transmission performance of the space by comparing the correct answer rate of the CVC test methods with the physical acoustic factors [36].
In the case of “sentences” and “words,” although the correct answer rate is high even under the low STI condition, CVC tests demonstrates a high correct answer rate only under the high STI condition. The present study aimed to test the hearing capacity of elderly people with incomplete hearing ability compared with those with normal hearing ability. Accordingly, it was necessary to determine a speech intelligibility test factor with a low correct answer rate regardless of the RT60, rather than a factor with a high correct answer rate such as “sentences” and “words.” Therefore, CVC tests were used in the present study.
Additionally, the speech intelligibility test conducted in the present study was performed using headphones rather than speakers as a speech intelligibility test tool because speakers could not produce meaningful results when the actual RT60 of the speech intelligibility test place was reflected. In the case of elderly people above the age of 65 years, their hearing perception performance may decrease even at the same level of speech because their hearing ability is degenerated compared with that of a normal person. Therefore, most instructors who deliver lectures in learning spaces for the elderly have a high level of vocalization. Due to this, the setting of 72 dB(A) in Odeon was measured at a distance of 1 m from the sound source, where the average male voice quality was loud. In an actual learning space, the lecturer is primarily situated in the front. In the virtual sound field developed in Odeon, the sound source was located in the front of the learning space. The sound-receiving point was located in the center of the learning space. The output of 72 dB(A), which is equivalent to “loud,” was accepted at the voice level of 60 dB(A) at the sound-receiving point. Table 8 classifies the size of the voice level according to the vocal effort of men in general [37]. Figure 6 illustrates the location of the sound source and the location of the sound-receiving point in the Odeon program [21,26]. The sound source was set at 1.5 m, which was the position of the mouth of an adult male when one was standing in the front and center of the lecture room. The sound-receiving point was set at 1.2 m—the approximate position of the ear of a participant sitting in the middle of the lecture room.
3.2. Test Materials of the Speech Intelligibility Tests
The CVC syllable is a syllable that resembles that which is used in everyday life. However, it has no meaning even though it is balanced by phonemes. Therefore, syllables that overlapped in phonetic signs were excluded from the speech intelligibility test items, even if they had different final consonants. An example list of the speech intelligibility test items is shown in Table 9, and the difficulty classification was expressed through the value characteristic of colors—the darker the color, the more “difficult” the recognition of each item. The CVC examples listed in Table 9 are Korean. Regarding the items for the actual speech intelligibility test, a total of 250 CVC syllables, 50 each by the RTsim according to the syllable, were used as the speech intelligibility test items.
3.3. Preliminary Experiments
Several variables can occur in speech intelligibility tests. These variables include the different difficulty levels of speech intelligibility test items, the lack of the individual hearing ability of speech intelligibility test participants, and the inconsistent rate of correct answers due to the RT60. Therefore, preliminary experiments were conducted to minimize these variables. The purpose of the preliminary experiments was to determine whether the difficulty level of the speech intelligibility test items had been adjusted and to set the appropriate RTsim for the sound source to be used in the speech intelligibility test.
The participants in the preliminary experiments were undergraduate and graduate university students with normal hearing. Participants in the preliminary experiments were excluded from the other tests. The reference point setting for the RTsim was based on 0.6 s which was confirmed through the first preliminary study, and, as illustrated in Figure 7a, the speech intelligibility test was conducted using five sound sources from 0.4 to 0.8 s at 0.1 s intervals. Consequently, the RT60 at 0.1 s intervals did not demonstrate a significant difference in the speech intelligibility test. Therefore, a second preliminary experiment was performed by setting the reference point of the RTsim as shown in Figure 7b. As a result of setting the five sound sources at intervals of 0.2 s, the sound source between 0.2 to 1.0 s was produced. However, if the minimum RTsim was 0.2 s, the speech intelligibility test result based on the RT60 could not be expected. Therefore, as illustrated in Figure 7c, the five sound sources of 0.4–1.2 s were produced at 0.2 s intervals by changing the reference point. In the case of Figure 7c, the RTsim of 0.6 s was included in the learning space for the elderly as investigated through preliminary studies; the shortest RTsim corresponded to 0.4 s, and the longest RTsim corresponded to 1.2 s. Therefore, it was judged to be suitable as the RTsim range for the speech intelligibility test conducted in the present study. Detailed results of the preliminary experiments are shown in Figure 8.
3.4. Speech Intelligibility Test Procedure
If five sound sources with different RTsim values are sequentially tested, the participants may demonstrate prelearning about the feeling of reverberations as the speech intelligibility test progresses. Because sequential order could affect the results of the tests, the speech intelligibility tests were conducted in a randomized order. Table 10 lists the output order.
Speech intelligibility tests were conducted in the form of listening to and dictating the sounds of 50 CVC syllables. Because the length of each syllable was 2–3 s for the CVC syllables, the answer time was 5 s for the CVC syllables. Thus, the total time for each speech intelligibility test was approximately 7 min for the CVC syllables. Therefore, the test for all five RTsim conditions required 35 min for the CVC syllables. When the test for one RTsim condition was completed, sufficient rest time was guaranteed to minimize fatigue.
Table 11 lists the equipment used for the speech intelligibility test. The schematic of the above speech intelligibility test process is illustrated in Figure 9. The configuration of the equipment during the speech intelligibility test was as presented in Figure 10. The sound source played on the laptop was delivered to the participants through headphones [38]. All headphones were connected to the headphone distribution unit shown in Figure 10. There was a sound controller in the unit that could adjust the output sound levels of each headphone. Thus, all headphones were calibrated to emit white noise of 60 ± 1 dB(A) before the experiments.
4. Speech Intelligibility Test
4.1. Speech Intelligibility Test Progress
Speech intelligibility tests were conducted with 23 people demonstrating incomplete hearing: the group comprised 10 males and 13 females aged 65–72 years. To compare the results between people demonstrating incomplete hearing and those with normal hearing, 20 young adults aged 21–27 years were additionally used, wherein this group comprised 12 males and 8 females with normal hearing ability. The present study was conducted by the Chungbuk National University Institutional Review Board (IRB). In addition, the authors completed a course on human-related research conducted by the Korea Disease Control and Prevention Agency. In addition, an explanation and a manual were distributed, following the Life Ethics and Safety Act (Article 16), to every participant before the tests, and signed consent was obtained. During the recruitment of participants, the research team required medical reports confirming the absence of medical hearing problems or hearing impairments in the participants. At first, more than 30 people were invited, but seven were excluded because they exhibited medical hearing problems.
Table 12 shows some general information regarding the speech intelligibility tests. Speech intelligibility tests were conducted on different days and locations for the incomplete-hearing and the normal-hearing groups. In room C, the speech intelligibility tests were conducted on the elderly people, while the normal-hearing group were tested in room D. The background noise in room C was approximately 10 dB(A) higher than that in room D because the C Lifelong Education Center was adjacent to the roadside. Ideally, all the tests should be conducted in the same room. However, due to COVID-19, both groups had restrictions on movement. Therefore, the tests were conducted in different rooms. Even though the two groups were tested in different rooms for the participants’ convenience, the test rooms did not affect the test results because the participants used headphones to hear the same auralized materials. Although there was a difference in the background noise between the two rooms, there was no interruption by the background noise because over-the-ear-type closed headphones that could attenuate ambient noise by up to 32 dB were used in the tests [39]. The ambient noise of the headphones was measured using a sound level meter that was closely attached to the headphones with an adaptor, such as a microphone calibration adaptor. As a result, the ambient noise inside the headphones was measured to be 10 dB less than the background noise level of the rooms. The minimum SNR inside the classroom was 15 dB, which could enable the recognition of speech transmission [40]. Because the sound output level was 60 dB, it was confirmed that the listening tests were undertaken without outside noise influence.
4.2. Speech Intelligibility Test Results
Each of the 50 questions received two points. Therefore, the total score was calculated by counting the number of correct answers, with a total of 100 points. The results of the speech intelligibility tests for the RTsim illustrated that the incomplete-hearing group scored approximately 20 points lower than the normal-hearing group and that both participant groups exhibited a lower score with a longer RTsim. Figure 11 is a graphical representation of the speech intelligibility test scores according to the RTsim of the incomplete- and normal-hearing groups. Figure 12 illustrates the results of the speech intelligibility tests with a graph of the increase and decrease rates. According to the figures, the score of the incomplete-hearing group decreased sharply by approximately 13% when the RTsim was 0.8 s or longer.
In addition, both groups were found to demonstrate a decline in the score with an increase in the RTsim. However, in the incomplete-hearing group, the speech intelligibility test results decreased significantly as the RTsim increased relative to that of the normal-hearing group. Accordingly, the speech intelligibility test scores reduced by up to 32.4% when the incomplete- and normal-hearing groups were compared under the same conditions.
The results of comparing the speech intelligibility test results between the two groups with the STI standard are shown in Figure 13. The CVC test score of the incomplete-hearing group corresponded to “fair.” However, the CVC test score of the normal-hearing group corresponded to “good–excellent.” Therefore, there was a clear difference in the speech perception ability between the two groups.
Because the CVC criteria of the STI shown in Figure 13 were established based on English, there may be differences in the results according to the experiments conducted and the language used in Korea. Accordingly, in the future, it will be necessary to progress beyond criteria such as the reverberation time and the background noise. For example, STI standards based on speech intelligibility could be presented according to the test data for each country.
To determine statistical significance, a T-Test and ANOVA were performed. The results of the T-Test and ANOVA are shown in Table 13. The T-test results showed that both groups afforded statistically significant results because the CVC test exhibited ≤ 0.05 p-values. The results of the ANOVA were compared based on the RTsim, and it was found that the p-value based on the RTsim was less than 0.05. Accordingly, the speech intelligibility test results were confirmed to be statistically significant.
The appropriate RT60 for learning spaces for elderly people proposed through the speech intelligibility tests was < 0.8 s. An excessively low RT60 causes a loss of the sound pressure level in the room [41]. Therefore, it is also desirable to set the lower limit of the suggested RT60. Unfortunately, the present study did not conduct trials to find the lower limit of the RT60 in classrooms for elderly people.
The proposed RT60 was the RTmid and was limited to an elderly learning space where lessons were provided in Korean. The proposal for an appropriate RT60 for an elderly learning space is presented in Table 14. According to recent papers, acoustic transmission is influenced by protection equipment such as face masks [42,43]. Depending on the COVID-19 situation, experiments based on whether or not a mask or screen is required are very important. However, the present study assumed the general situation of not wearing a mask.
Table 15 compares the RT60 of American, British, and Korean classrooms with that of the present study. Standards such as those mentioned in Table 15 differ by the language and education method of the respective country. Therefore, the standards for the acoustic environment of the classroom vary depending on the country of application. In Korea, standards for the reverberation time were proposed according to the students’ ages and the size of the classrooms. In the USA, standards for the reverberation time were established according to the room use and the volume of the classroom, while, in the UK, acoustic standards were set according to the age of the students and the size of the classrooms. In addition, many countries and organizations have suggested the RT60 standard of classrooms that is suitable for their languages. Therefore, all the standards were made to create a listening environment suitable for their languages. The present study also derived the Korean standards from the same research methods which have already been carried out before.
5. Conclusions and Discussion
This study was conducted to determine the appropriate RT60 for learning spaces for the elderly, for which there are currently no standards in Korea. Since the study aimed to set the standard for learning spaces for elderly people, speech intelligibility tests were performed, and the RT60 was used. The conclusions obtained through the analysis of the speech intelligibility test results are as follows:
- The speech intelligibility test results demonstrated that both the incomplete- and normal-hearing groups exhibited a lower score with an increase in the RTsim. In addition, in the STI standard, the results of the incomplete-hearing group corresponded to “fair,” and those of the normal-hearing group corresponded to “good–excellent.” Therefore, there was a clear difference in the speech perception ability between the two groups.
- The speech intelligibility test results demonstrated that the speech intelligibility test scores dropped by a maximum of 32.4% for the incomplete-hearing group under the same RTsim conditions as those of the normal-hearing group. Thus, a learning space with the same RT60 standard as that of the normal-hearing group was not appropriate for the incomplete-hearing group.
- According to the speech intelligibility test under the five RTsim conditions, if the RTsim was > 0.8 s, the speech intelligibility test score of the incomplete-hearing group dropped by 13.3%. Therefore, it is recommended that the RT60 in learning places for the elderly (below 250 m3) should not exceed 0.8 s.
- Most of the criteria for speech intelligibility presented thus far were based on English. Classrooms, where classes are conducted, require an RT60 standard suitable for each country’s language. Therefore, it is necessary to present the criteria for the RT60 according to each country’s language as well as the appropriate criteria for the STI based on speech intelligibility.
Unlike previous studies, the present study derived the appropriate RT60 for the incomplete-hearing group from the results of a speech intelligibility test in Korean. If a 0.8 s RT60 was applied in the elderly learning spaces where classes are conducted in Korean, it could enable the improvement of the speech perception ability of people exhibiting incomplete hearing.
The present study conducted a speech intelligibility test based on the Korean language. Therefore, different results could be obtained in various classrooms that use different countries’ languages. Therefore, in future studies, it is expected that more meaningful results will be obtained if speech intelligibility is tested in classrooms using various languages. Furthermore, new results could be derived from a speech intelligibility test based on the sound pressure level of female teachers or the STI standard presentation based on the speech intelligibility of each country. In addition, it is very important to consider a speaker in a lecture room. Since the present study was aimed to find the appropriate conditions for listeners, the conditions for a speaker were not considered. In addition, the effects of facial masks and screens were not considered. Therefore, future research will derive measures to improve acoustic conditions for speakers in lecture rooms. Additionally, it is thought that the lower limit of the RT60 that does not strain the speaker’s voice in elderly learning spaces could be derived through experiments on a speaker.
Based on these findings, learning space design guidelines for interior finishing materials and layout could be developed to implement acoustic standards for learning spaces for elderly and, ultimately, to provide an educational environment appropriate for the hearing of the elderly.
Author Contributions
Conceptualization, C.-H.H.; methodology, S.-M.L., C.-J.P. and C.-H.H.; software, S.-M.L.; validation, S.-M.L., C.-J.P. and C.-H.H.; formal analysis, S.-M.L. and C.-H.H.; investigation, S.-M.L., C.-J.P. and C.-H.H.; resources, C.-H.H.; data curation, S.-M.L.; writing—original draft preparation, S.-M.L.; writing—review and editing, C.-H.H.; visualization, S.-M.L.; supervision, C.-H.H.; project administration, C.-H.H.; funding acquisition, C.-H.H. All authors have read and agreed to the published version of the manuscript.
Funding
This work was supported by the National Research Foundation of Korea (NRF) grant funded by the Korea government (MSIT) (NRF-2020R1A2C2009963) and financially supported by the Research Year of Chungbuk National University in 2022.
Conflicts of Interest
The authors declare no conflict of interest.
References
- Mehta, M.; Johnson, J.; Rocafort, J. Architectural Acoustics–Principles and Design; Prentice-Hall: Englewood Cliffs, NJ, USA, 1999. [Google Scholar]
- Park, C.J. Establish of the Acoustical Performance Criteria for Middle and High School Classrooms in Korea. Ph.D. Thesis, Chungbuk National University, Cheongju, Korea, 2014. [Google Scholar]
- Park, C.J.; Haan, C.H. Initial Study on the Reverberation Time Standard for the Korean Middle and High School Classrooms Using Speech Intelligibility Tests. Buildings 2021, 11, 354. [Google Scholar] [CrossRef]
- Haan, C.H.; Moon, K.C. An Experimeantal on the Room Acoustical Environment of the Elementary School Classrooms. J. Korean. Inst. Educ. Facil. 2004, 11, 5–14. [Google Scholar]
- Park, C.J.; Ryu, D.J.; Haan, C.H. Investigation of the Outdoor Noises of Schools and Acoustic Performance of the Classroom. In Proceedings of the Conference on Acoustical Society of Korea, Seoul, Korea, 10–11 May 2021. [Google Scholar]
- Nábělek, A.K.; Pickett, J.M. Reception of Consonant in a Classroom as Affected by Monaural and Binaural Listening, Noise, Reverberation, and Hearing Aids. J. Acoust. Soc. Am. 1974, 56, 628–639. [Google Scholar] [CrossRef] [PubMed]
- Prodi, N. Research Trajectories in Classroom Acoustics: Investigating Children Perception Beyond Accuracy. J. Acoust. Soc. Am. 2018, 144, 1976. [Google Scholar] [CrossRef] [Green Version]
- Madbouly, A.I.; Noaman, A.Y.; Regab, A.H.M.; Khedra, A.M.; Fayoumi, A.G. Assessment Model of Classroom Acoustics Criteria for Enhancing Speech Intelligibility and Learning Quality. Appl. Acoust. 2016, 114, 147–158. [Google Scholar] [CrossRef]
- ANSI/ASA S12.60; American National Standard, Acoustical Performance Criteria, Design Requirements, and Guidelines for School, Part 1: Permanent Schools. ANSI (American National Standards Institute): New York, NY, USA, 2010.
- DfEE (Department for Education and Employment). Acoustic Design of Schools; Building Bulletin 93; DfEE (Department for Education and Employment): London, UK, 2011. [Google Scholar]
- Aguilar, J.R. A Review of Acoustic Design Criteria for School Infrastructure in Chille. Rev. Ing. Construcción. 2019, 34, 115–123. [Google Scholar] [CrossRef] [Green Version]
- Gupta, V. Policy on Classroom Acoustics in India. J. Educ. 2015, 8, 0974–7966. [Google Scholar]
- Van Reenen, C.; Karusseit, C. Classroom Acoustics as a Consideration for Inclusive Education in South Africa. S. Afr. J. Commun. Discord. 2017, 64, 550–650. [Google Scholar] [CrossRef] [Green Version]
- Tong, Y.G.; Bakar, H.A.; Sari, K.M.; Ewon, U.; Labeni, M.N.; Fauzan, N.F.A. Effect of Urban Noise to the Acoustical Performance of the Secondary School’s Learning Spaces—A Case Study in Batu Pahat. In Proceedings of the Global Congress on the Materials Science and Engineering, Johor Bahru, Malaysia, 28–29 August 2017. [Google Scholar]
- Statistics Korea. Statistics Korea, 2021 Statistics of the Elderly; Statistics Korea: Daejeon, Korea, 2021.
- Kim, S.H.; Jang, S.S.; Shin, J.H.; Yeo, C.K.; Han, Y.K.; Lee, J.K. Age and gender specific reference levels for hearing thresholds of normal aging in korean. J. Acoust. Soc. Kr. 2005, 24, 353–357. [Google Scholar]
- Kwak, C.; Han, W. Age-Related Difficulty of Listening Effort in Elderly. Int. J. Environ. Res. Public Health 2021, 18, 8845. [Google Scholar] [CrossRef]
- Tawfik, S.M.; Shafik, N.A. Effects of aging on dichotic listening ability. Egypt. J. Otolaryngol. 2022, 38, 1–8. [Google Scholar] [CrossRef]
- Abdollahi, F.Z.; Delphi, M.; Delphi, V. Spatial hearing and speech understanding in noise in elderly. Hear. Balance Commun. 2021, 19, 21–25. [Google Scholar] [CrossRef]
- Park, C.J.; Kim, B.G.; Haan, C.H. Investigation of the listening environment of classroom for elderly people using speech intelligibility tests. J. Acoust. Soc. Kr. 2021, 40, 18–30. [Google Scholar]
- Park, C.J.; Haan, C.H. Effects of the Complexity of 3D Modeling on the Acoustic Simulations and Auralized Sounds. J. Acoust. Soc. Kr. 2011, 30, 22–32. [Google Scholar] [CrossRef]
- Rindel, J.H.; Christensen, C.L. Room acoustic simulation and auralization-how close can we get to the real room. In Proceedings of the WESPAC VIII Western Pacific Acoustics Conference, Melbourne, Australia, 7–9 April 2003. [Google Scholar]
- Zeng, X.; Christensen, C.L.; Rindel, J.H. Practical methods to define scattering coefficients in a room acoustics computer model. Appl. Acoust. 2006, 67, 771–786. [Google Scholar] [CrossRef]
- KS F ISO 3382–2: 2008; Measurement of room acoustics parameters—Part 2: Reverberation time in ordinary rooms (MOD ISO 3382–2:2008). ISO: Geneva, Switzerland, 2008.
- ASHRAE. ASHRAE Handbook: HVAC Applications (ASHRAE); ASHRAE: Washington, DC, USA, 2007. [Google Scholar]
- Christensen, C.L. Odeon Combined Version 12.10; User Manual, Odeon; Technical University of Denmark: Lyngby, Denmark, 2013. [Google Scholar]
- Christensen, C.L.; George, K.; Jens, H.R. Estimating absorption of materials to match room model against existing room using a generic algorithm. In Proceedings of the Forum Acusticum, Krakow, Poland, 7–12 April 2014. [Google Scholar]
- Shtrepi, L.; Astolfi, A.; Puglisi, G.E.; Masoero, M.C. Effects of the distance from a diffusive surface on the objective and perceptual evaluation of the sound field in a small simulated variable-acoustics hall. Appl. Sci. 2017, 7, 224. [Google Scholar] [CrossRef] [Green Version]
- Yoo, H.C. The room acoustics of gymnasium building. In Proceedings of the 5th Korea-Russia International Symposium on Science and Technology. Proceedings. KORUS 2001 (Cat. No. 01EX478), Tomsk, Russia, 26 June 2001—3 July 2001; Volume 3, pp. 35–38. [Google Scholar]
- Bailescu, C.; Lordache, V.; Catalina, T. Optimal cost-efficiency solution of acoustic treatment for a complex meeting room. E3S Web Conf. 2019, 111, 02073. [Google Scholar] [CrossRef] [Green Version]
- IEC 60268–16: 2020; Sound System Equipment—Part 16: Objective Rating of Speech Intelligibility by Speech Transmission Index. ISO: Geneva, Switzerland, 2020.
- ANSI/ASA S3.2; Method for Measuring the Intelligibility of Speech over Communication Systems. ANSI (American National Standards Institute): New York, NY, USA, 2009.
- Yoon, C.S.; Kim, S.W.; Oh, Y.K. A study on the standardization of articulation testing method and its evaluation suitable for Korean language (Ⅰ)—Concentrated on the proposal of articulation testing standard. J. Archi. Inst. Kr. 1988, 20, 117–125. [Google Scholar]
- Yoon, C.S.; Kim, S.W.; Oh, Y.K. A study on the standardization of articulation testing method and its evaluation suitable for Korean language (Ⅱ)—Evaluation of the proposed articulation testing standard. J. Archi. Inst. Kr. 1989, 21, 95–108. [Google Scholar]
- Kim, B.W.; Kim, J.J.; Kim, S.T.; Lee, Y.J. A study on the design and the construction of a Korean speech DB for common use. J. Acoust. Soc. Kr. 1997, 16, 35–41. [Google Scholar]
- ISO 9921; Ergonomic: Assessment of Speech Communication. International Standardization Organization: Geneva, Switzerland, 2003.
- ISO 9921–1: 1996; Ergonomic: Assessment of Speech Communication—Part 1: Speech Inference and Communication Distance for Persons with Normal Hearing Capacity in Direct Communication (SIL Method). International Standardization Organization: Geneva, Switzerland, 1996.
- Jo, A.H. A Study on the Acoustical Performance Standards for the Lower Grade Elementary School Classrooms in Korea Using Speech Intelligibility Tests. Master’s Thesis, Chungbuk National University, Cheongju, Korea, 2021. [Google Scholar]
- Sennhiser electronic GmbH & co. HD 280_Quick_Guide_05_2016; Sennhiser electronic GmbH & co: Wedemark, Germany, 2016. [Google Scholar]
- Houtgast, T. The effect of ambient noise on speech intelligibility in classrooms. Appl. Acoust. 1981, 14, 15–25. [Google Scholar] [CrossRef]
- Egan, M.D. Architectural Acoustics; McGraw-Hill: New York, NY, USA, 1988; p. 344. [Google Scholar]
- Caniato, M.; Marzi, A.; Gasparella, A. How much COVID-19 face protections influence speech intelligibility in classroom? Appl. Acoust. 2021, 178, 108051. [Google Scholar] [CrossRef]
- Sukaj, S.; Trematerra, A.; Ciaburro, G.; Lannace, G. Use of masks inside the classrooms. In Proceedings of the 50th International Congress on Exposition on Noise Control Engineering, Washington, DC, USA, 1–5 August 2021; Volume 263, pp. 4020–4027. [Google Scholar]
- Jo, A.H.; Park, C.J.; Haan, C.H. Investigation of the Appropriate Reverberation Time for Lower-Grade Elementary School Classrooms Using Speech Intelligibility Tests. Buildings 2022, 12, 808. [Google Scholar] [CrossRef]
Figure 1.
Measurement result of RT60 in four classrooms for the elderly (unoccupied).

Figure 2.
CAD modeling lecture room D.

Figure 3.
Example of an impulse response of simulated sound at 1000 Hz with RTsim of 0.8 s.

Figure 4.
Flow diagram of the auralized sound production.

Figure 5.
Comparison of intelligibility scores and STIs using three types of speech intelligibility tests.
Figure 5.
Comparison of intelligibility scores and STIs using three types of speech intelligibility tests.

Figure 6.
Odeon model of lecture room D.

Figure 7.
Preliminary experiment results.

Figure 8.
Preliminary experiment results of (a,b).

Figure 9.
Speech intelligibility test progress.

Figure 10.
Equipment configuration map.

Figure 11.
Speech intelligibility test results of RTsim.

Figure 12.
Rate of increase or decrease in the speech intelligibility test scores.

Figure 13.
Relationship between the speech intelligibility test results of the two groups and STI standard.
Figure 13.
Relationship between the speech intelligibility test results of the two groups and STI standard.


Table 1.
Acoustic performance standard for classrooms in the United States (unoccupied).
| Classroom Size | Background Noise (dB(A)) | RT60 (s) |
|---|---|---|
| <283 m3 | 35 | <0.6 |
| 283–566 m3 | 35 | <0.7 |
| >566 m3 | 40 | - |
Table 2.
Acoustic performance standard for classrooms in the United Kingdom (unoccupied).
| Classroom Type | Background Noise (dB(A)) | RT60 (s) | |
|---|---|---|---|
| primary school | <35 | <0.6 | |
| middle and high school | <35 | <0.8 | |
| open-plan classroom | <40 | <0.8 | |
| lecture room | <50 people | <35 | <0.8 |
| >50 people | <30 | <1.0 | |
Table 3.
Comparison of each room specification.
| C Room | D Room (Virtual Room) | |
|---|---|---|
| Width | 7.5 m | 10.4 m |
| Length | 11.5 m | 8.2 m |
| Height | 2.7 m | 2.9 m |
| Accommodation of people | 40 | 60 |
Table 4.
General information of acoustical setting in Odeon.
| Classification | Content |
|---|---|
| Directivity pattern | BB93_RAISED_NATURAL.SO8 |
| NC Value | NC 30 |
Table 5.
Noise reduction coefficient (NRC) for computer simulation in Odeon.
| Location | Interior Finishing Material | 125 Hz | 250 Hz | 500 Hz | 1000 Hz | 2000 Hz | 4000 Hz | NRC * |
|---|---|---|---|---|---|---|---|---|
| unchanged actual material applied to every simulation | ||||||||
| floor | vinyl tile | 0.02 | 0.03 | 0.03 | 0.03 | 0.03 | 0.02 | 0.03 |
| window | heavy plate glass | 0.18 | 0.06 | 0.04 | 0.03 | 0.02 | 0.02 | 0.04 |
| windowsill | metal | 0.06 | 0.05 | 0.07 | 0.10 | 0.08 | 0.07 | 0.08 |
| door | solid wooden door | 0.14 | 0.10 | 0.06 | 0.08 | 0.10 | 0.10 | 0.08 |
| black board | black board | 0.18 | 0.06 | 0.04 | 0.03 | 0.02 | 0.02 | 0.04 |
| lecture desk | wooden paneling | 0.12 | 0.11 | 0.10 | 0.07 | 0.05 | 0.06 | 0.08 |
| desk | wooden desk | 0.12 | 0.11 | 0.10 | 0.07 | 0.05 | 0.06 | 0.08 |
| desk leg | metal | 0.06 | 0.05 | 0.07 | 0.10 | 0.08 | 0.07 | 0.08 |
| chair back | upholstered seats | 0.10 | 0.10 | 0.09 | 0.08 | 0.08 | 0.08 | 0.09 |
| chair seat | fabric | 0.19 | 0.37 | 0.56 | 0.67 | 0.61 | 0.59 | 0.55 |
| chair leg | metal | 0.06 | 0.05 | 0.07 | 0.10 | 0.08 | 0.07 | 0.08 |
| shelf | concrete or terrazzo | 0.01 | 0.01 | 0.02 | 0.02 | 0.02 | 0.02 | 0.02 |
| wall | smooth concrete, painted or glazed | 0.01 | 0.01 | 0.01 | 0.02 | 0.02 | 0.02 | 0.02 |
| ceiling | mineral absorbent board | 0.16 | 0.53 | 0.44 | 0.51 | 0.59 | 0.58 | 0.52 |
| same sound absorption coefficient for all frequency bands applied for RTsim ** control | ||||||||
| wall &ceiling | sound absorbing coefficient: 4% | 0.04 | 0.04 | 0.04 | 0.04 | 0.04 | 0.04 | 0.04 |
| sound absorbing coefficient: 8% | 0.08 | 0.08 | 0.08 | 0.08 | 0.08 | 0.08 | 0.08 | |
| sound absorbing coefficient: 14% | 0.14 | 0.14 | 0.14 | 0.14 | 0.14 | 0.14 | 0.14 | |
| sound absorbing coefficient: 24% | 0.24 | 0.24 | 0.24 | 0.24 | 0.24 | 0.24 | 0.24 | |
| sound absorbing coefficient: 40% | 0.40 | 0.40 | 0.40 | 0.40 | 0.40 | 0.40 | 0.40 | |
* Noise reduction coefficient: average of the sound absorption coefficient at 250, 500, 1000, and 2000 Hz. ** Simulated RT60 in a virtual sound field.
Table 6.
Acoustical parameters of virtual sound field.
| RTsim | 125 Hz | 250 Hz | 500 Hz | 1000 Hz | 2000 Hz | 4000 Hz | |
|---|---|---|---|---|---|---|---|
| 0.4 s | RT60(s) | 0.42 | 0.40 | 0.40 | 0.39 | 0.40 | 0.39 |
| D50 | 0.81 | 0.85 | 0.85 | 0.86 | 0.87 | 0.88 | |
| STI | 0.71 | ||||||
| 0.6 s | RT60 (s) | 0.66 | 0.62 | 0.61 | 0.61 | 0.61 | 0.58 |
| D50 | 0.63 | 0.68 | 0.69 | 0.69 | 0.72 | 0.74 | |
| STI | 0.65 | ||||||
| 0.8 s | RT60 (s) | 0.95 | 0.84 | 0.81 | 0.81 | 0.82 | 0.77 |
| D50 | 0.49 | 0.55 | 0.56 | 0.57 | 0.60 | 0.62 | |
| STI | 0.60 | ||||||
| 1.0 s | RT60 (s) | 1.28 | 1.07 | 1.02 | 1.01 | 1.04 | 0.95 |
| D50 | 0.39 | 0.46 | 0.48 | 0.49 | 0.51 | 0.54 | |
| STI | 0.56 | ||||||
| 1.2 s | RT60 (s) | 1.62 | 1.30 | 1.23 | 1.20 | 1.26 | 1.13 |
| D50 | 0.32 | 0.39 | 0.41 | 0.42 | 0.44 | 0.47 | |
| STI | 0.52 | ||||||
Table 7.
Equipment list for producing auralized sound.
| Classification | Content | |
|---|---|---|
| Recording | microphone (hyper cardioid) | Earthwork SR78 |
| digital stereo audio recorder | TASCAM HD-P2 | |
| Convolution | room acoustic simulation software | Odeon combined v.12 |
| Editing source | sound editing program | Adobe Audition cs3 |
Table 8.
Voice level according to the speaker’s vocal effort.
| Vocal Effort | LS, A, 1 m (dB) |
|---|---|
| maximum shout | 90 |
| shout | 84 |
| very loud | 78 |
| loud | 72 |
| raised | 66 |
| normal | 60 |
| relaxed | 54 |
Table 9.
Example of CVC syllable lists (in Korean).
| 호[ho] | 멍[meong] | 백[baek] | 으[eu] | 고[go] |
| 아[a] | 말[mal] | 차[cha] | 앙[ang] | 문[mun] |
| 슬[seul] | 처[cheo] | 뒷[dwis] | 족[jok] | 갈[gal] |
| 걸[geol] | 코[ko] | 땅[ttang] | 삭[sak] | 싸[ssa] |
| 헏[heot] | 씬[ssin] | 칟[chit] | 끈[kkeun] | 팓[pat] |
| 벋[beot] | 련[ryeon] | 펃[peot] | 꼭[kkok] | 녿[not] |
Table 10.
Experiment output order.
| Test Order | RTsim (s) |
|---|---|
| 1st | 1.0 |
| 2nd | 0.4 |
| 3rd | 0.8 |
| 4th | 0.6 |
| 5th | 1.2 |
Table 11.
List of equipment used for the speech intelligibility test.
| Classification | Manufacturer and Model | Quantity |
|---|---|---|
| sound level meter | NTI XL2 | 1 |
| headphones | Sennheiser HD 280 PRO | 10 |
| distributor | Behringer powerplay pro-8 (8 ch) | 1 |
| DESCO headphone distributor (5 ch) | 1 | |
| sound player | Samsung notebook | 1 |
Table 12.
General information of speech intelligibility tests.
| Test Place | Speech Intelligibility Test Group | Background Noise |
|---|---|---|
| C Lifelong Education Center | Incomplete-hearing group | 40.1 dB(A) |
| D University | Normal-hearing group | 29.6 dB(A) |
Table 13.
Result of the T-Test and ANOVA.
| t-Test | ANOVA | ||
|---|---|---|---|
| t-Value | p-Value * | Incomplete-Hearing Group | Normal-Hearing Group |
| −7.748 | 0.002 | 0.005 | 0.001 |
* p < 0.05.
Table 14.
Proposed RTmid standard for Korean learning spaces for elderly people (unoccupied).
| Volume | Reverberation Time (RTmid) * |
|---|---|
| <250 m3 | <0.8 s |
* average RT60 at 500 Hz and 1000 Hz.
Table 15.
Comparison of reverberation time standards in various countries (unoccupied).
| Country | Grade | Volume | Reverberation Time |
|---|---|---|---|
| Korea | learning space for elderly people (example) | below 250 m3 | below 0.8 s |
| lower-grade elementary school [44] | below 185 m3 | below 0.6 s | |
| middle and high school [4] | below 220 m3 | below 0.8 s | |
| United States [10] | learning space | below 283 m3 | below 0.6 s |
| above 283 m3 below 566 m3 | below 0.7 s | ||
| above 566 m3 | no requirement | ||
| United Kingdom [11] | elementary school | no limitation | below 0.6 s |
| middle and high school | below 0.8 s | ||
| open-plan type classroom | below 0.5 s | ||
| Small classrooms (up to 50 people) | below 0.8 s | ||
| Large classrooms (50 or more people) | below 1.0 s |
Publisher’s Note: MDPI stays neutral with regard to jurisdictional claims in published maps and institutional affiliations. |
© 2022 by the authors. Licensee MDPI, Basel, Switzerland. This article is an open access article distributed under the terms and conditions of the Creative Commons Attribution (CC BY) license (https://creativecommons.org/licenses/by/4.0/).
Share and Cite
MDPI and ACS Style
Lee, S.-M.; Park, C.-J.; Haan, C.-H. Investigation of the Appropriate Reverberation Time in Learning Spaces for Elderly People Using Speech Intelligibility Tests. Buildings 2022, 12, 1943. https://doi.org/10.3390/buildings12111943
AMA Style
Lee S-M, Park C-J, Haan C-H. Investigation of the Appropriate Reverberation Time in Learning Spaces for Elderly People Using Speech Intelligibility Tests. Buildings. 2022; 12(11):1943. https://doi.org/10.3390/buildings12111943
Chicago/Turabian StyleLee, Seung-Min, Chan-Jae Park, and Chan-Hoon Haan. 2022. "Investigation of the Appropriate Reverberation Time in Learning Spaces for Elderly People Using Speech Intelligibility Tests" Buildings 12, no. 11: 1943. https://doi.org/10.3390/buildings12111943
Note that from the first issue of 2016, this journal uses article numbers instead of page numbers. See further details here.