
Numerical Simulation of a Fire Accident in a Longitudinally Ventilated Railway Tunnel and Tenability Analysis


Laboratory of Thermo Fluid Systems (LTFS), Department of Mechanical Engineering, Ancient Olive Grove Campus, University of West Attica, Thivon Str. 250, Egaleo, 12244 Athens, Greece
*
Author to whom correspondence should be addressed.
Appl. Sci. 2022, 12(11), 5667; https://doi.org/10.3390/app12115667
Submission received: 5 May 2022
/
Revised: 30 May 2022
/
Accepted: 31 May 2022
/
Published: 2 June 2022
(This article belongs to the Special Issue Experimental and Numerical Modeling of Fluid Flow)
Abstract
:The present study examines the prevailing conditions in a railway tunnel after a train fire accident and the ability of the ventilation system to create the proper conditions for a safe passenger evacuation. The examined scenario included an event of a 20-MW diesel pool fire on a suburban train, immobilized in the middle of a 1.5-Km long, linear shaped rectangular tunnel ventilated by a longitudinal jet fan system, and the people’s movement during the evacuation was effectuated along walking platforms. More specifically, three scenarios with different fan activation times and different evacuation processes were examined. A Large Eddy simulation model (LES) was used for the simulation of the air flow in the railway tunnel. The evaluation of the ventilation system criteria considered the achievement of the air critical velocity inside the railway tunnel, and for the people’s safe evacuation, the Fractional Effective Dose (FED) value was examined. It was found that the most important action in a tunnel fire is the time, after the start of a fire, the ventilation system is activated.
1. Introduction
Tunnels are complex infrastructures, usually of semicircular or rectangular cross-sections, constructed to establish connections between different sections of a road or railroad network. The growing reports of indoor fire accidents with high population mobility, such as tunnels, have created the need to consider the prevailing conditions in such cases as well as the best evacuation plan to ensure human life [1].
The consequences after a tunnel fire can be much more serious than an outdoor fire because of high smoke concentrations and confined movement space [2,3]. Accidents involving fire and hazardous material displacement can be studied for different urban scales and settings. Although the fire poses a threat near its vicinity, toxic substances can travel along the flow of the air [4]. After a fire accident, high temperatures and toxic fumes are produced, which have harmful consequences for passengers who are trapped inside the tunnel. In 2003, an arson fire in the subway tunnel in Daegu, South Korea resulted in 198 deaths. In 2017, the Jinji Road Tunnel Fire in Shanxi, China, 2017, caused 31 deaths [5]. A wrong evacuation plan can lead people in to the fire or smoke direction, with a negative effect on their health due to the presence of toxic gases, heat, and radiation [6,7].
To minimize human exposure to smoke during a tunnel evacuation, various types of ventilation systems are used to remove the smoke from the tunnel or to keep the smoke in the tunnel above the head [8,9]. These can be either mechanical or natural ventilation systems [10]. Forced ventilation systems use fans to extract or push smoke out of the tunnel. Natural ventilation with vertical wells in the roof of the tunnel take advantage of the buoyancy of hot smoke, which escapes through the shafts due to the stack effect and piston effect due to the movement of vehicles or trains inside the tunnel. This approach generally does not require mechanical fans, resulting in space-saving at the higher level of the tunnel, and it is suitable for overground [11].
One of the key criteria for the passenger’s safety after a fire accident is the number of toxic products of combustion that the individual inhales during the event and the evacuation process. This is calculated using the FED (Fractional Effective Doses) index. The FED index was first introduced by Purser [12] and has since been adopted by various organizations, such as the NFPA [13]. The basic idea is that a person who inhales a certain dose of toxic products for a period of time is considered unconscious or dead. To assess how a person’s life is threatened, FED is the main factor considered [1], alongside the thermal exposure and the low visibility due to smoke (hence the difficulty of accessing emergency exits).
Evacuation in underground public transport systems can be complicated and the outcome of an evacuation scenario depends on many different parameters. These parameters can be the people’s walking speed, the visibility, the design of the train and tunnel, or the physical condition of the people [14].
Tunnels are designed with elevated platforms to assist a safe passenger evacuation in case of a fire accident. The reduced height difference between the level of the train and the platform, compared to the evacuation of a train directly to the rail area, is a method of increasing the safety of the population. The difficulty of evacuating a train to the rails, especially for people with mobility difficulties, has been analyzed in the METRO project of Ingason et al. [15]
The purpose of a tunnel ventilation system, besides for maintaining air quality, is to keep the longest part of a tunnel free of smoke for as long as possible. In the case of a fire accident inside a tunnel, passengers are exposed to smoke, even though the ventilation system exists. In such a situation, the activation of the ventilation system must be delayed slightly or operated at a slower speed so as not to disturb the natural stratification of the air and smoke layers [16,17]. This state will be maintained if the air velocity does not exceed the critical velocity [18]. The critical velocity is defined as the minimum longitudinal ventilation velocity to avoid the phenomenon of smoke reversal or backlayering in case of fire [19]. Depending on the air velocity, hot smoke and cold air are mixed, and thus the smoke is dispersed downstream of the fire throughout the tunnel [20]. Hot smoke also moves against the flow of air, upstream of the fire front, and as it cools it descends to the ground. This phenomenon is called smoke backlayering. The amount of smoke that will be inverted upstream of the fire front and the downstream distance of where it will remain depends on the ventilation conditions [19,21].
Hu et al. [22] suggested that smoke stops spreading when the horizontal inertia forces caused by the buoyancy of hot smoke are equal to the inertia forces of the ventilation air. Based on a series of small-scale experiments that studied the correlation between critical velocity and heat release rate (HRR—Heat Release Rate), for different geometries of fire sources, conducted by Oka and Atkinson [23] and Li et al. [24], they found that the dimensionless critical velocity is proportional to the dimensionless HRR1/3 in the case of low and medium HRR and is independent in the case of large HRR. Riess and Bettelini [25] found that the stack effect should be considered in the design of the ventilation of sloped tunnels with angles of inclination of more than 1–2%. Wu and Bakar [26] observed that, with the same fuel and longitudinal ventilation speed, the length of the inverted smoke layer gradually increases as the tunnel cross-section increases when the tunnel cross-section reaches a certain value.
Lee and Ryou [27] investigated the critical velocities for various tunnel aspect ratios in a series of small-scale experiments, and they found that the critical velocity increases with the aspect ratio. The study of a fire accident with vehicles blocking the tunnel showed [28,29] that, as the distance from the blockage upstream of the source fire accident increases, the length of the inverted smoke layer and the critical velocity initially decreases until it reaches a certain value that is equal to the value that these two sizes would have without the presence of an obstacle. Tanaka et al. [30] conducted a series of small-scale experiments to study the characteristics of a fire’s, smoke considering the escalation of heat conduction through the tunnel walls and presented some equations for estimating the critical velocity and length of the inverted smoke layer.
According to NFPA [13], the critical velocity is “the minimum steady-state velocity of the ventilation airflow towards the fire, in a tunnel or corridor, required to prevent smoke reversal in the fire area.” In this study, three different scenarios (A, B, and C), regarding the jet fan activation time, were examined. The jet fans were activated simultaneously at t = +180 s, +300 s, and +480 s, after the fire ignition, respectively. Then, the calculated volume fractions of toxic gases from the numerical simulation were used to calculate the FED value of the passengers evacuating the train. Three different scenarios for the passengers’ evacuation were examined, with evacuation initiation times being t = +60 s, +120 s, and +300 s after the fire ignition.
Section 2 describes the numerical model, the dimensions and boundary conditions of the simulation model geometry, the grid formulation, and the grid independence test. Section 3 describes the validation method used to validate the numerical simulation results using empirical equations that resulted from experiments. The tenability analysis takes place in Section 4, where the mean and max FED values are compared for each scenario.
The literature, in its majority, studies the evacuation times, choke points during the evacuation of subway systems and the comfort of passengers evacuating tunnels via walking platforms, or how the critical velocity is affected by different conditions [14,24,29,31,32]. The present study focused on the correlation between the two actions taken in a tunnel fire accident: ventilation system activation and evacuation process initialization. These two actions play a great role in the exposure of the population to harmful gases and hot temperatures. The results show that the most important action is the activation of the ventilation system as soon as possible from the ignition of the fire. When this is not possible, according to the results, the best strategy is to wait for the people to evacuate the tunnel and then activate the ventilation system to prevent passengers from inhaling smoke due to the entertainment of the smoke layer in the tunnel ceiling.
2. Numerical Model
The Fire Dynamics Simulation (FDS) is a code developed by the NIST in cooperation with the VIT research center of Finland. The code numerically solves the Navier-Stokes equations and finds application in low velocity thermally driven flows, smoke production, and mass and heat transfer. The FDS code is a low Mach number Large Eddy Simulation solver (the Mach number is under 0.3). To define the turbulent characteristics, the Smagorinsky model is applied.
The governing equations for mass and momentum conservation are:
where ρ is the density, g is the gravity acceleration, u is the velocity, p is the pressure, t is the time, and is the stress tensor, where μ is the dynamic viscosity of the fluid, is the strain tensor, and is the Kronecker delta.
The coefficient of turbulent consistency in Smagorinsky’s analysis is defined as:
where is the dimension of the spatial filter proportional to the dimension of the grid.
The energy conservation equation is written as:
where is the sensible enthalpy, is the energy transferred to particles during evaporation (change of phase), and are the radiative and conductive heat fluxes.
The equation for species conservation is written as:
where is the species production rate as particles or droplets.
The time step used is variable and adjusted by the FDS code. During the calculation, the time step is adjusted so that the CFL (Courant, Friedrichs, Lewy) condition is satisfied. The default value of the size of the time step is [31]:
where δx, δy, and δz are the dimensions of the smallest mesh cell, H is the height of the computational domain, and g is the acceleration of gravity.
2.1. Model Details
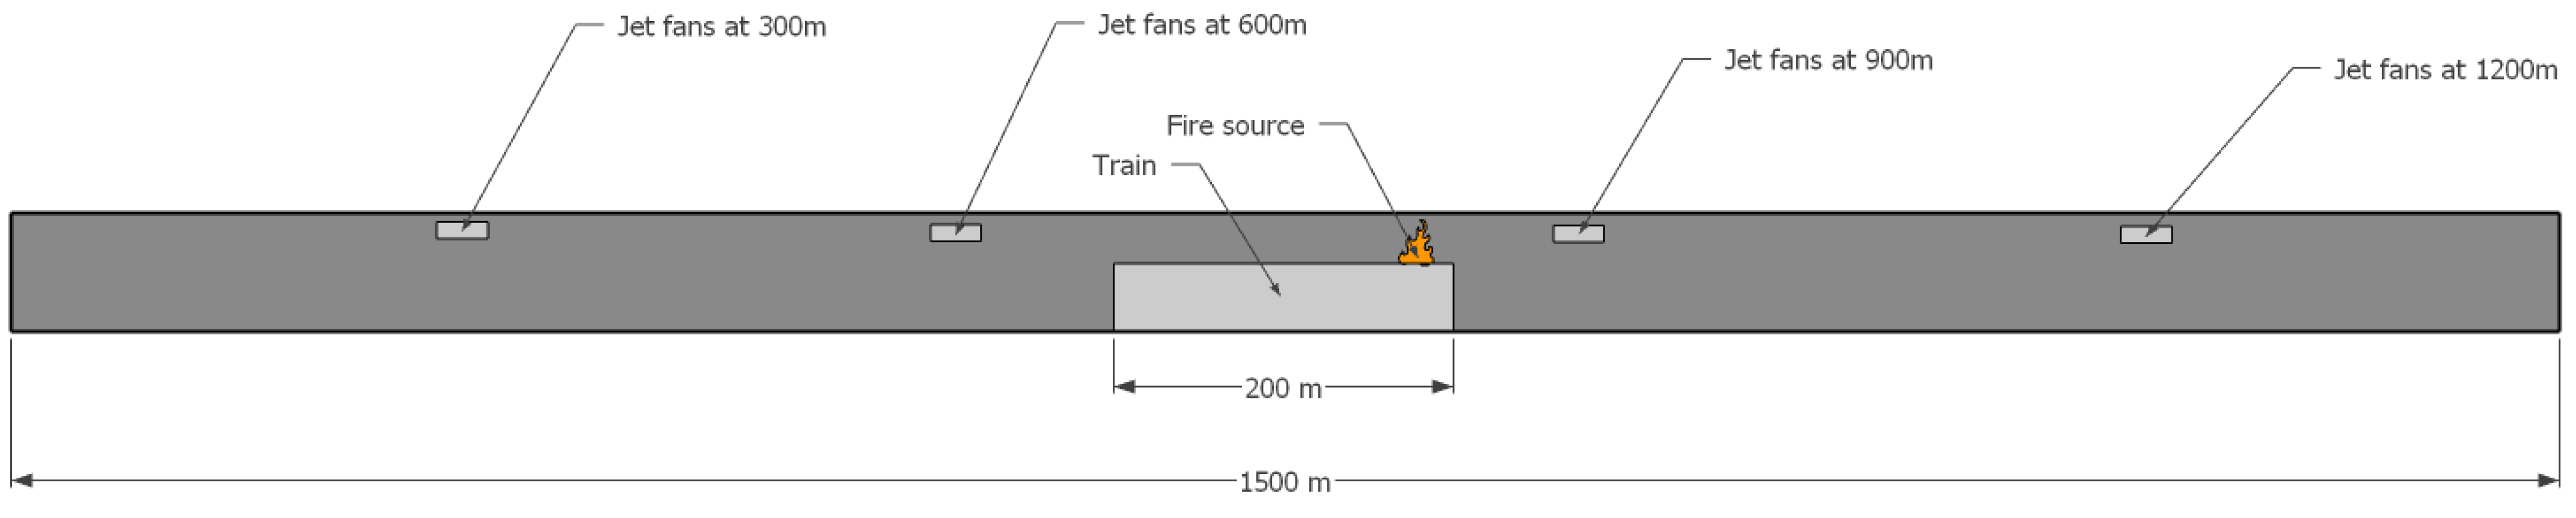
The studied tunnel is made of rectangular cross-sections with dimensions typical for a double railway tunnel (y = 11 m, z = 7 m), and its length is 1.5 Km.
In all cases, the center of the fire source was located in the middle section of the tunnel, as shown in Figure 1 at (x = 795.5 m, y = 2.25 m, z = 4 m), and the intensity was 20 MW, which corresponds to a traction engine fire. The fire’s surface was 1 m2 and it was located on the train’s roof. The surface of the fire was modeled as a burner type and was inserted into the model as an open vent. The fire growth followed a typical rule, where the growth rate was 0.1876 kW/s2 and achieved nominal HRR within 327 s. C12H23 was used as the fuel, which is the standard composition of diesel, with a yield of combustion products of 0.1 for CO and 0.09 for soot. Combustion efficiency is defined as the amount produced per gram of fuel diffused along with the flow, compared to the diffusion of fire into the environment.
The jet fans used in the simulations are 3 m long with a surface area of 1 m2. Four pairs of them were placed every 300 m at the height of 5 m and 1 m off the side walls
According to McGrattan et al. [32], the non-dimensional expression D*/δx was used to assess mesh resolution, where δx is the nominal size grid (in m), and the characteristic length of D* is expressed as follows
where Q is the fire heat release rate (HRR) (W), is the ambient density (kg/m3), is the specific heat capacity (J/kgK), is the ambient temperature (K), and is the gravitational acceleration constant (m/s2). In the NUREG-1824 Directive published by the United States Nuclear Energy Regulatory Commission (USNRC) and the Electricity Research Institute (EPRI), it defines that values should be in a range between 4–16 for an optimal analysis in FDS Code [33]. Unlike the number of cells, the grid resolution does not depend on the volume of the building, so the corresponding standard has the advantage of universal application regardless of the size of the building.
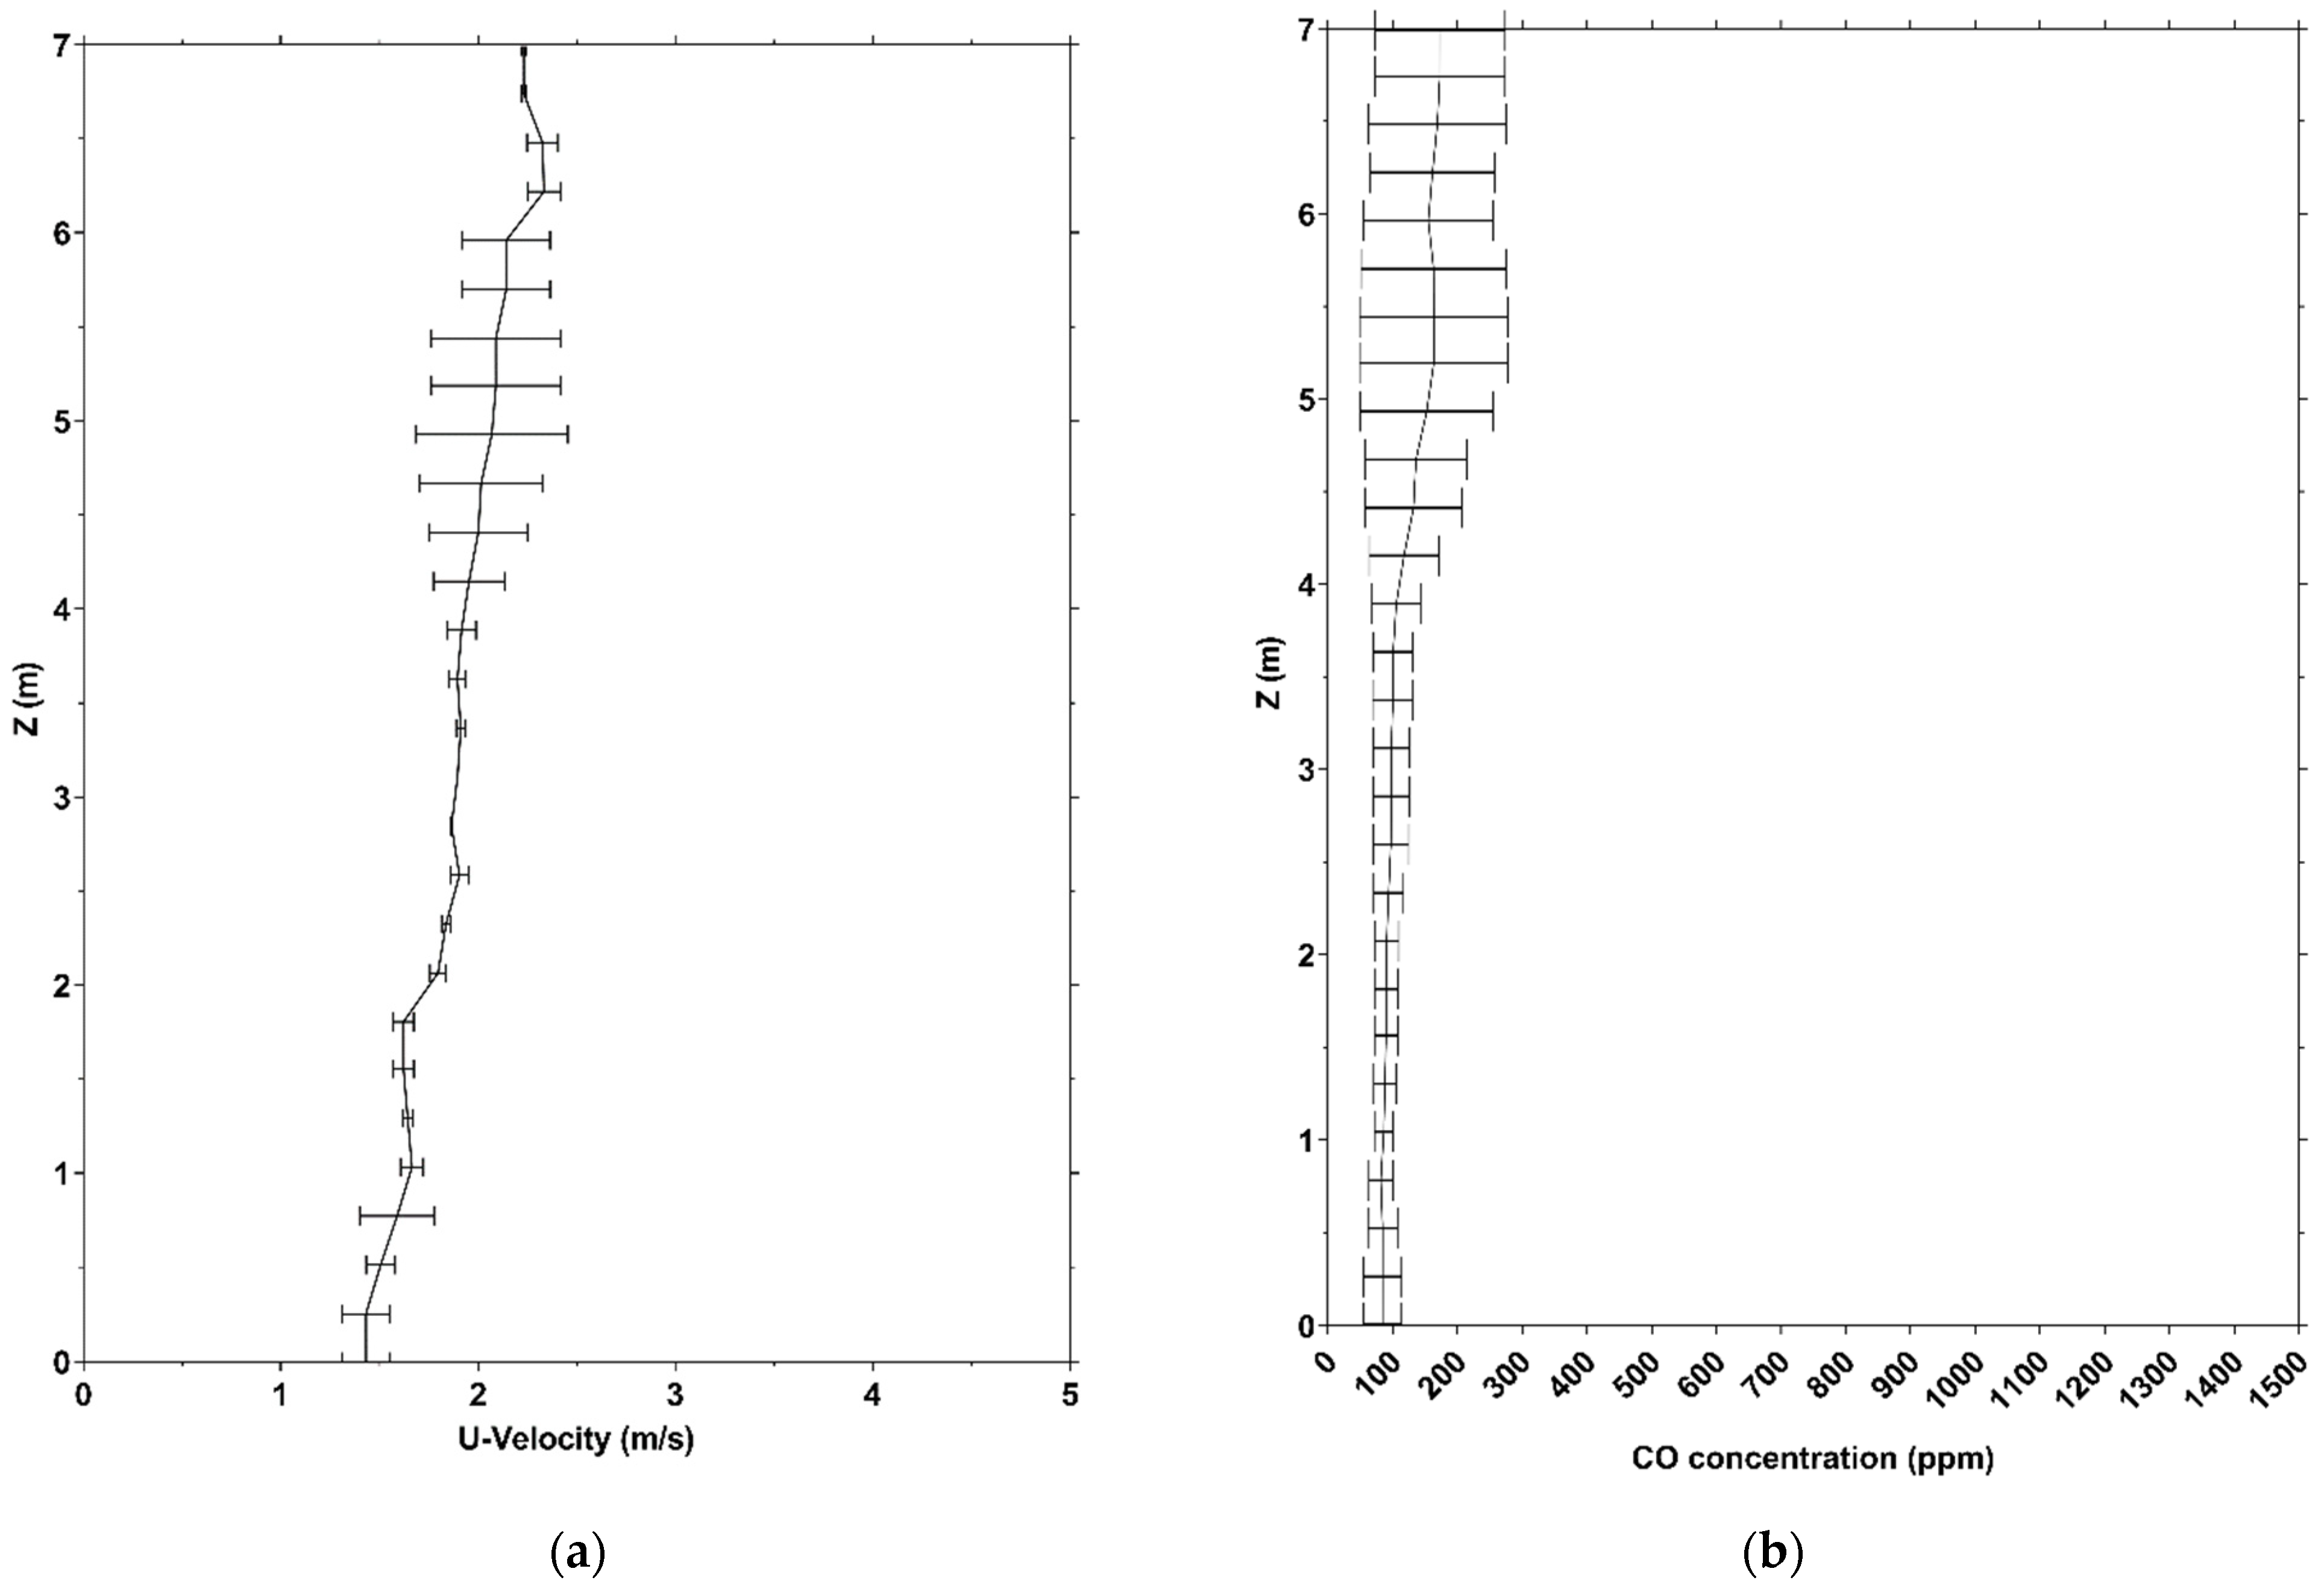
The grid independence test was conducted for three different meshes: coarse mesh with a mesh size of 0.75 m, medium mesh with a mesh size of 0.5 m, and fine mesh with a mesh resolution of 0.25 m. The number of cells for each type of mesh was 269,865, 924,000, and 4,254,149, respectively. As shown in Figure 2, the fine and medium meshes were compared. The grid errors using two computational grids were calculated using the following equation [34]
where is the numerical solution that results from the medium computational grid, and the corresponding from the finer is , r is the refinement factor between the two computational grids, and p is the accuracy of the algorithm, which is 3 for the present study.
The grid independence examined the U velocity and carbon monoxide concentration values. The values were extracted by a line, downwind of the fire source, in the symmetry plane of the tunnel with coordinates (x = 1100 m, y = 5.5 m, and z = from 0 to 7 m) with 28 sampling points.
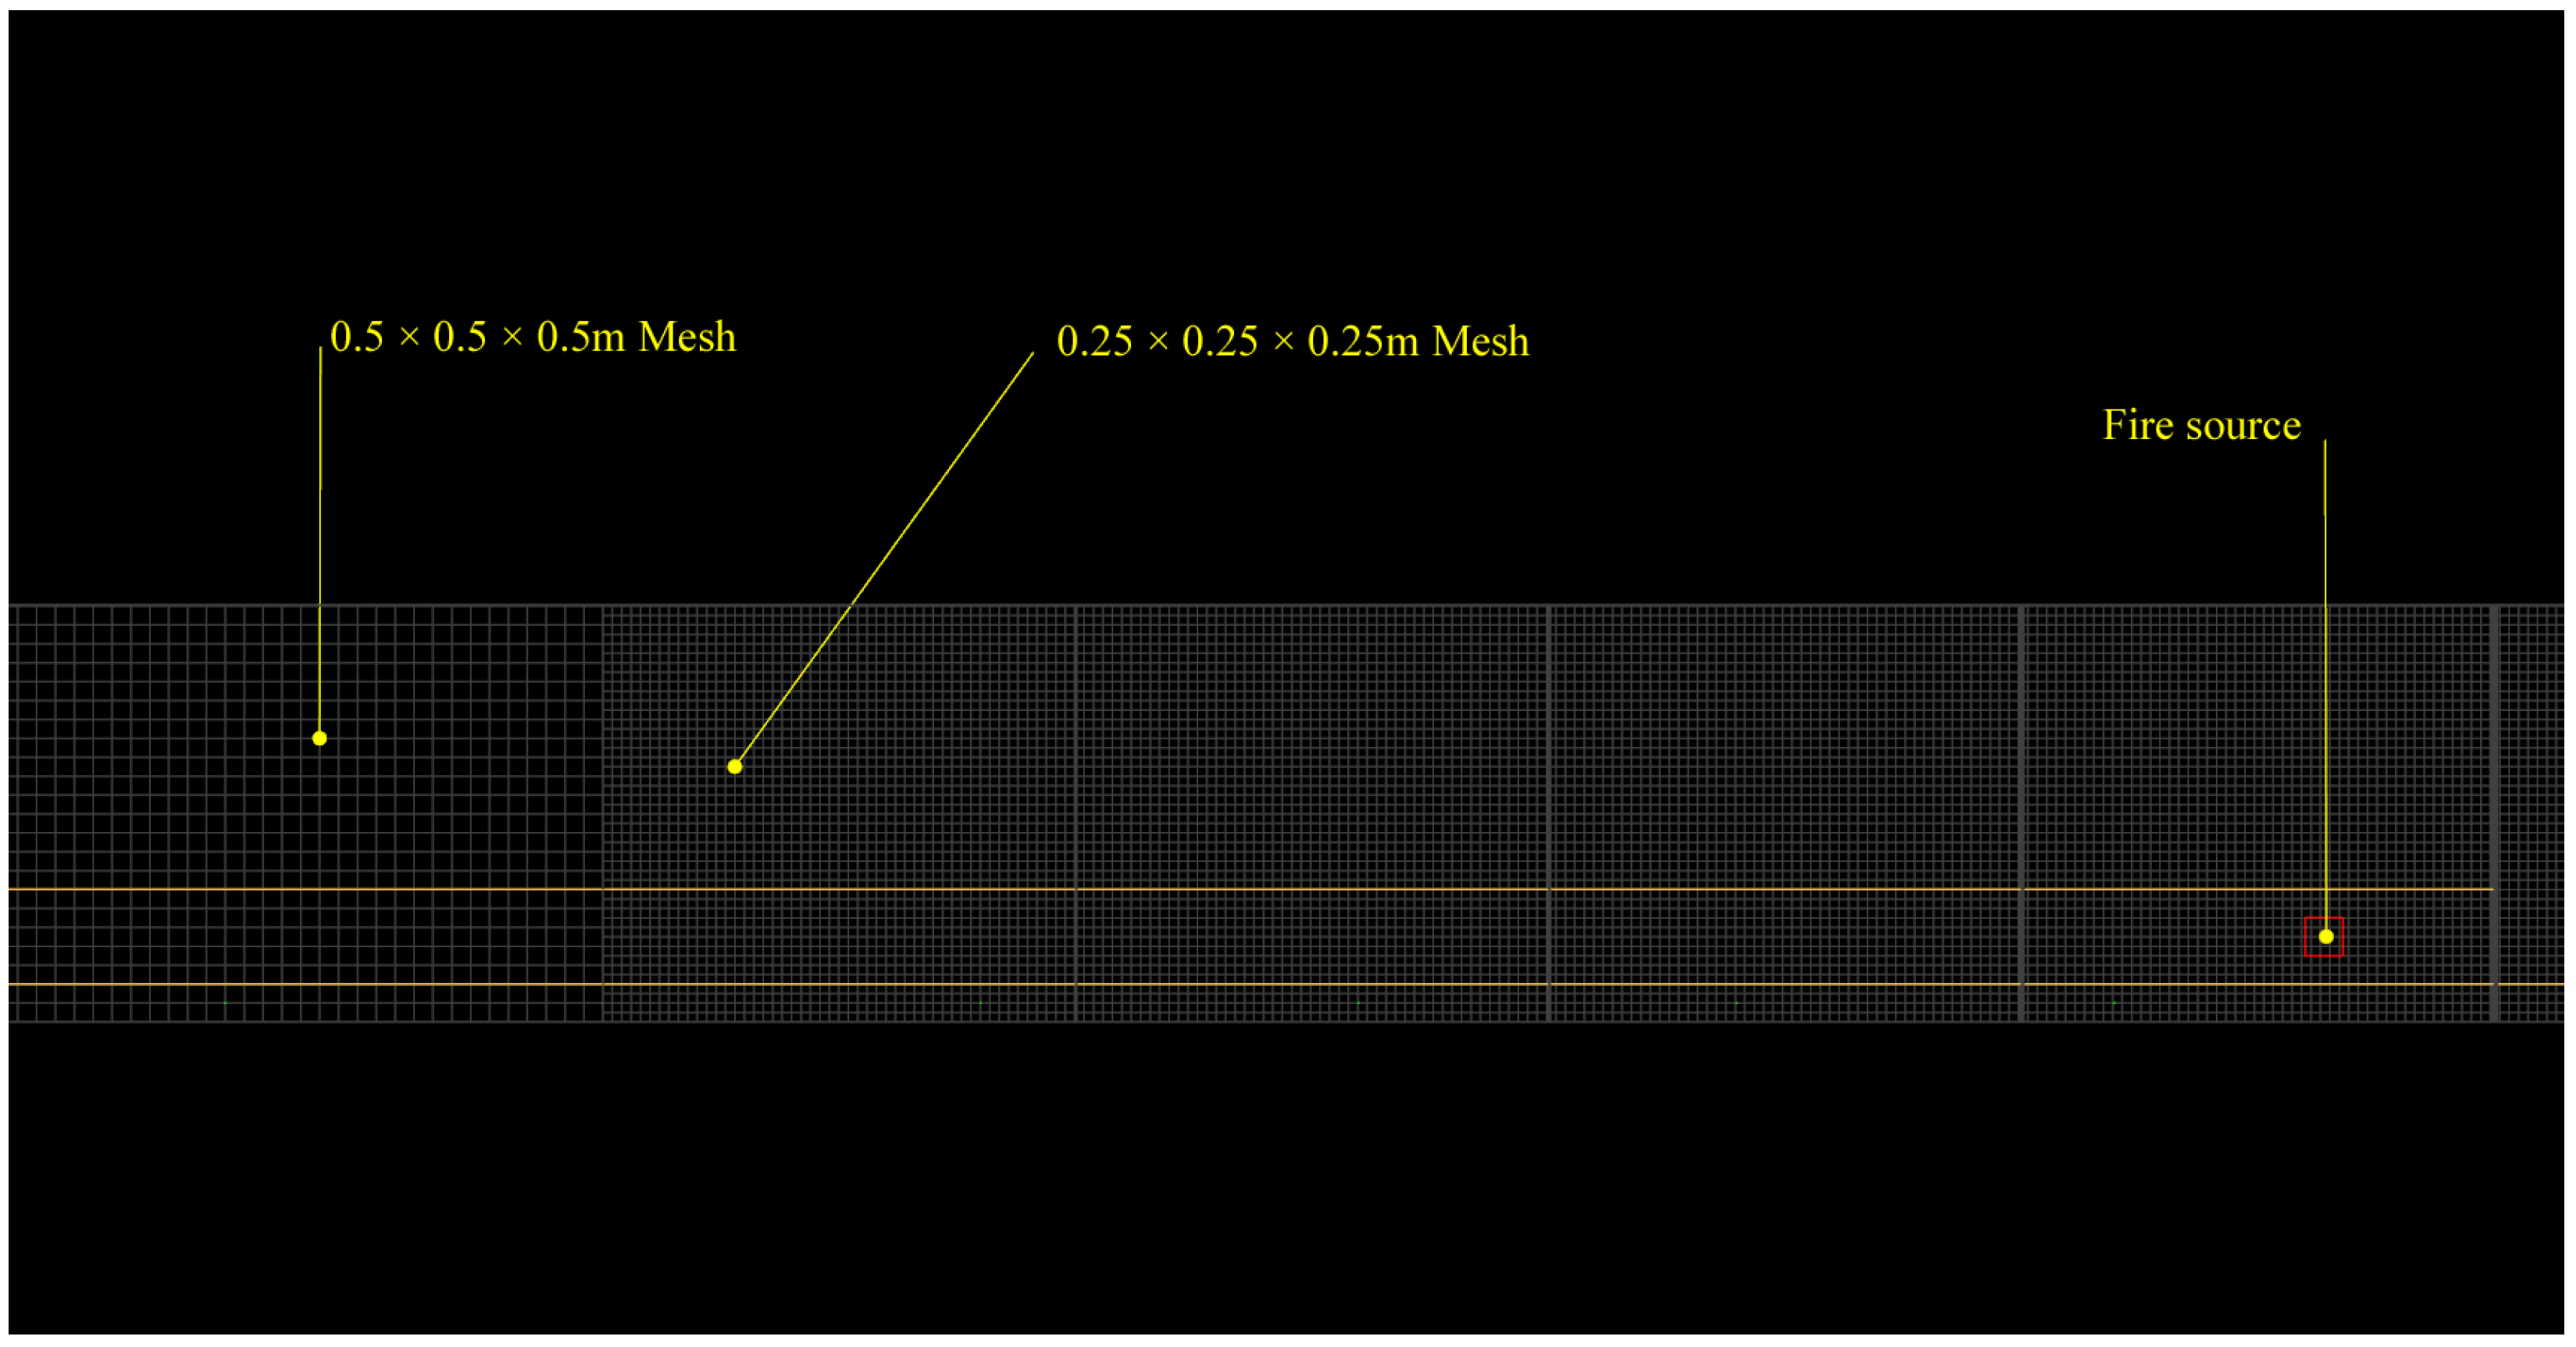
The results did not show great deviation, so a combination of the fine and medium mesh was used as the final mesh for the examination of the three main scenarios. The fine mesh was used for the field around the fire, while, for the rest of the tunnel, the medium mesh was used. For the sake of convenience, a mesh size of 0.25 m was used in the area around the fire (50 m downstream and 50 m upstream), while, for the rest of the tunnel, a mesh size of 0.5 m was used, as shown in Figure 3. The total number of cells was 1,355,200.
The mean value of errors of the U velocity for the coarse and medium meshes was approximately 14%, for the medium and fine mesh it was 5%, and for the medium and final mesh used it was 4%. For the CO concentrations, the mean error values for the coarse and medium mesh was 16%, for the medium and fine mesh was 8%, and for the medium and final mesh was 6% The mesh resolution, which was proposed in the UNSRC and EPRI directive, was used in many other tunnel fire simulations such as [35,36,37].
The work for the numerical simulation was conducted in the National HPC facility—ARIS, with computational time granted from the National Infrastructures for Research and Technology S.A. (GRNET S.A.). For each scenario, 22 cores and 56 GB of memory were used, and the typical time taken to complete each computation was 24 h.
2.2. Validation of Methodology
Kurioka et al. [38] performed experiments using three different tunnel scales, 1:10, 1:2, and a full scale, with rectangular and horseshoe cross-sections. The fire sources used were of square cross section. The aspect ratio of the tunnel cross-section dimensions, HRR, and forced longitudinal ventilation velocity was variable. From the experimental data of the 1/10 scale model, empirical formulas were exported to calculate the flame inclination, the flame height, the maximum temperature of the smoke layer, and its position. The effect of tunnel cross-section dimensions was incorporated into these models. The ratio H3/2/b1/2, where H is the height of the tunnel model and b is the width, was found to be representative for the investigation of fire phenomena in tunnels. It was also confirmed that these empirical formulas were sufficiently applicable to predict phenomena occurring during a fire accident, close to the square fire source field, by comparing the results of experiments in 1:2 and full-scale tunnels. Hu et al. [39] studied, experimentally and computationally, the maximum temperature on the tunnel roof. They first compared the FDS results with the experimental measurements, and then, with the values, they calculated with the model of Kurioka, Oka, Satoh, and Sugawa [38]. The temperature predicted by the FDS was found to converge quite well with both the experimental measurements and the results of the empirical model.
The Li et al. [40] study provided a theoretical analysis of the maximum temperature in the tunnel’s roof, based on the axon-symmetric fire plume theory, taking into account the heat release rate, the longitudinal ventilation velocity, and the geometry of the tunnel. They conducted scale tests to investigate the maximum temperature on the tunnel roof in case of fire. Li and Ingason [41] analyzed the effects of different ventilation systems, ventilation speeds, heat release rates, tunnel geometries, and fire sources on the maximum temperature under the tunnel roof for large fires. They used data from many model-scale tests and large-scale tunnel fire experiments around the world. They proposed some empirical formulas for the maximum temperature on the tunnel’s roof nearby the fire source for low and high ventilation speeds. Rosignuolo et al. [42] merged the empirical relationships from the two studies above and defined a formula that exhibited non-linear regression and calculated temperature values as a function of distance from the fire source. They also distinguished between small and large fires because, in the event of a very large fire, the flame reaches the roof, so that the maximum temperature corresponds to the temperature of the flame, and it is difficult to estimate the mass flow rate. If a portion of the flame volume containing the combustion zone reaches the roof of the tunnel, the maximum temperature on the roof is reaching a constant value. Therefore, the maximum roof gas temperature is limited to a maximum of 1350 °C. The formula that calculates the temperature as a function of distance from the fire source is expressed as follows:
where is the distance from the fire source, is the height of the tunnel, and is the virtual origin, which is calculated as
where is the flame length (m). The maximum temperature of the gas depends on its maximum value on the roof (), which in turn was calculated by defining two different areas, depending on the dimensionless ventilation speed :
where
is the total heat release rate (kW), is the effective height of the tunnel (the height from the fire source to the ceiling) (m), is the ventilation velocity, is the radius of the fire source (m), and V′ is defined as:
where is the characteristic velocity of the plume and is expressed by the following equation:
where is the gravitational acceleration, (m/s2), is the radius of the fire source (m), is the density of air (kg/m3), is the specific heat capacity (kJ/kgK), and is the ambient temperature (K).
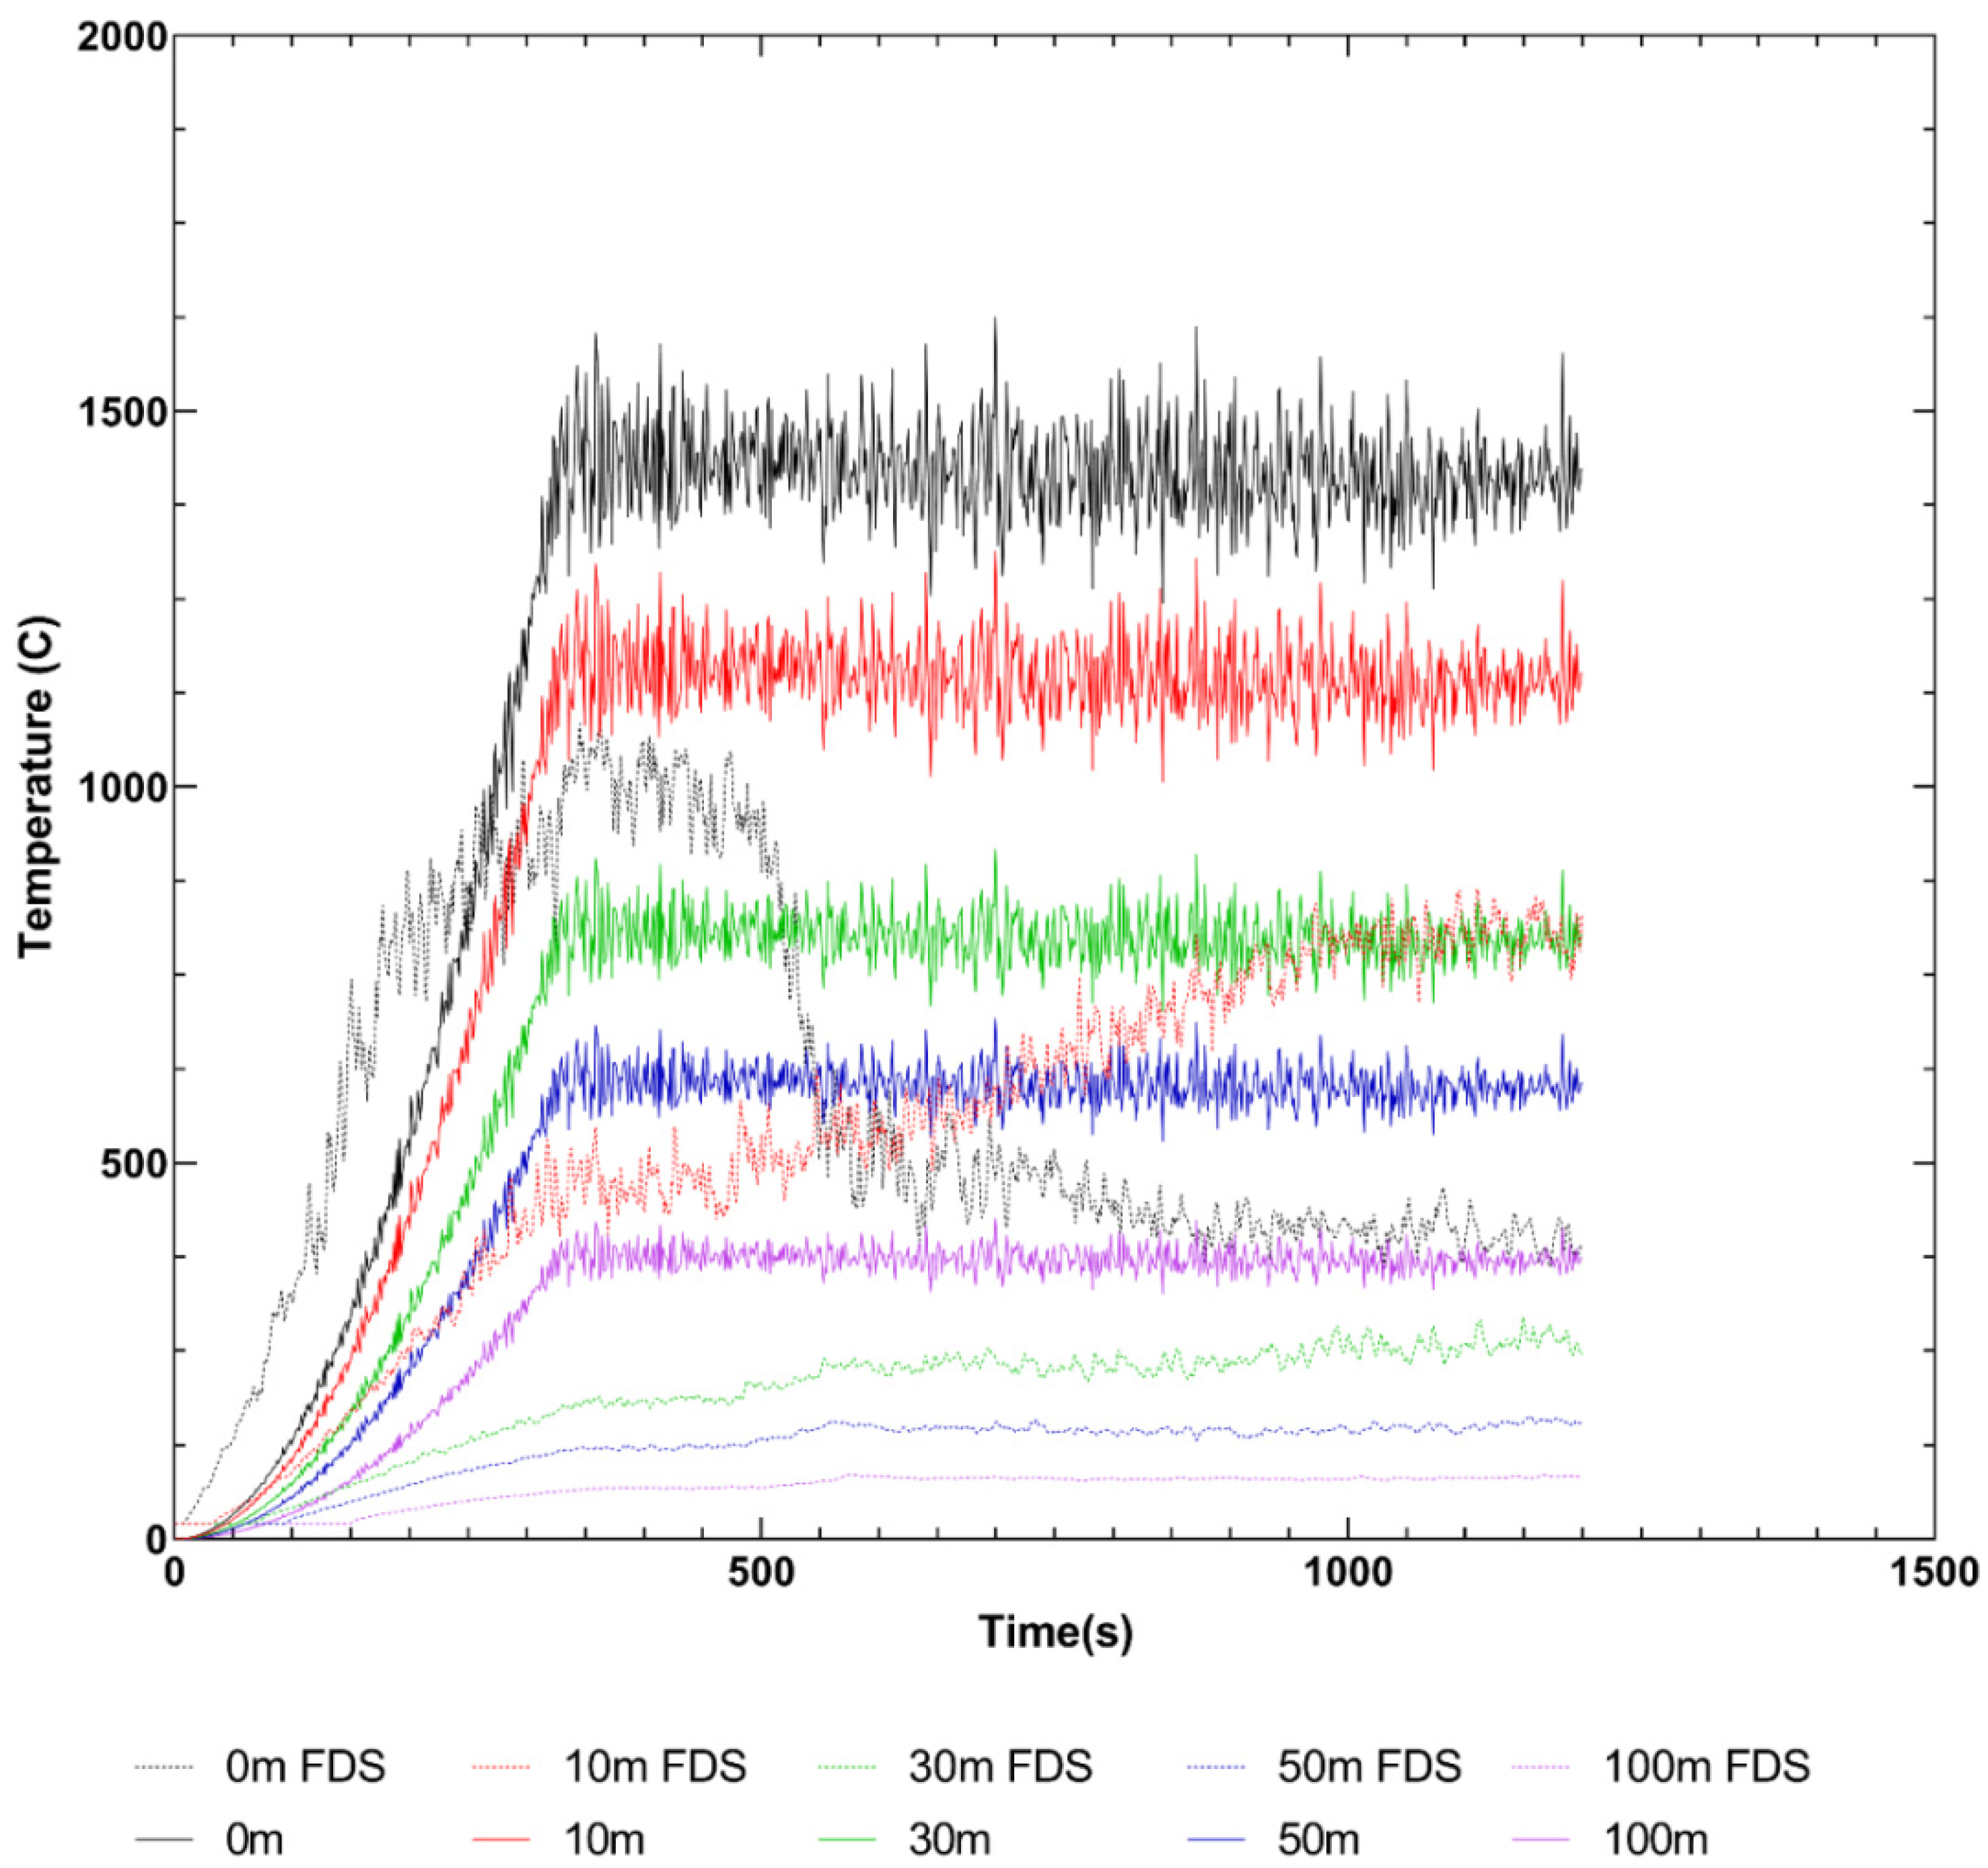
The values calculated with the empirical model were compared to the numerical results for Scenario C, measured with thermocouples at the tunnel ceiling (z = 7 m) above and downwind the fire source (where x = 0 is directly above the fire source). A large difference in temperature values is shown in Figure 4. The figure shows the good agreement of the curves at 0 m during the initial stages of the fire. From this point on, the temperature decreases and follows a scattering trend. There is a consistent difference of around 400 °C between the empirical and the actual temperature values for every location, except for above the fire pool. This difference leads to the assumption that, since the flame length increases up to the point that it is equal to and greater than the effective height of the tunnel and starts crawling horizontally to the ceiling, the smoke layer surrounds the fire source. The results indicate that there was not enough oxygen for the fire to grow further, so the fire became ventilation controlled. Other possible reasons for these differences might be that there are limitations to the validity of parameters such as the geometry of the tunnel and the fire area (the FDS fire source has different dimensions than those used in the experiments).
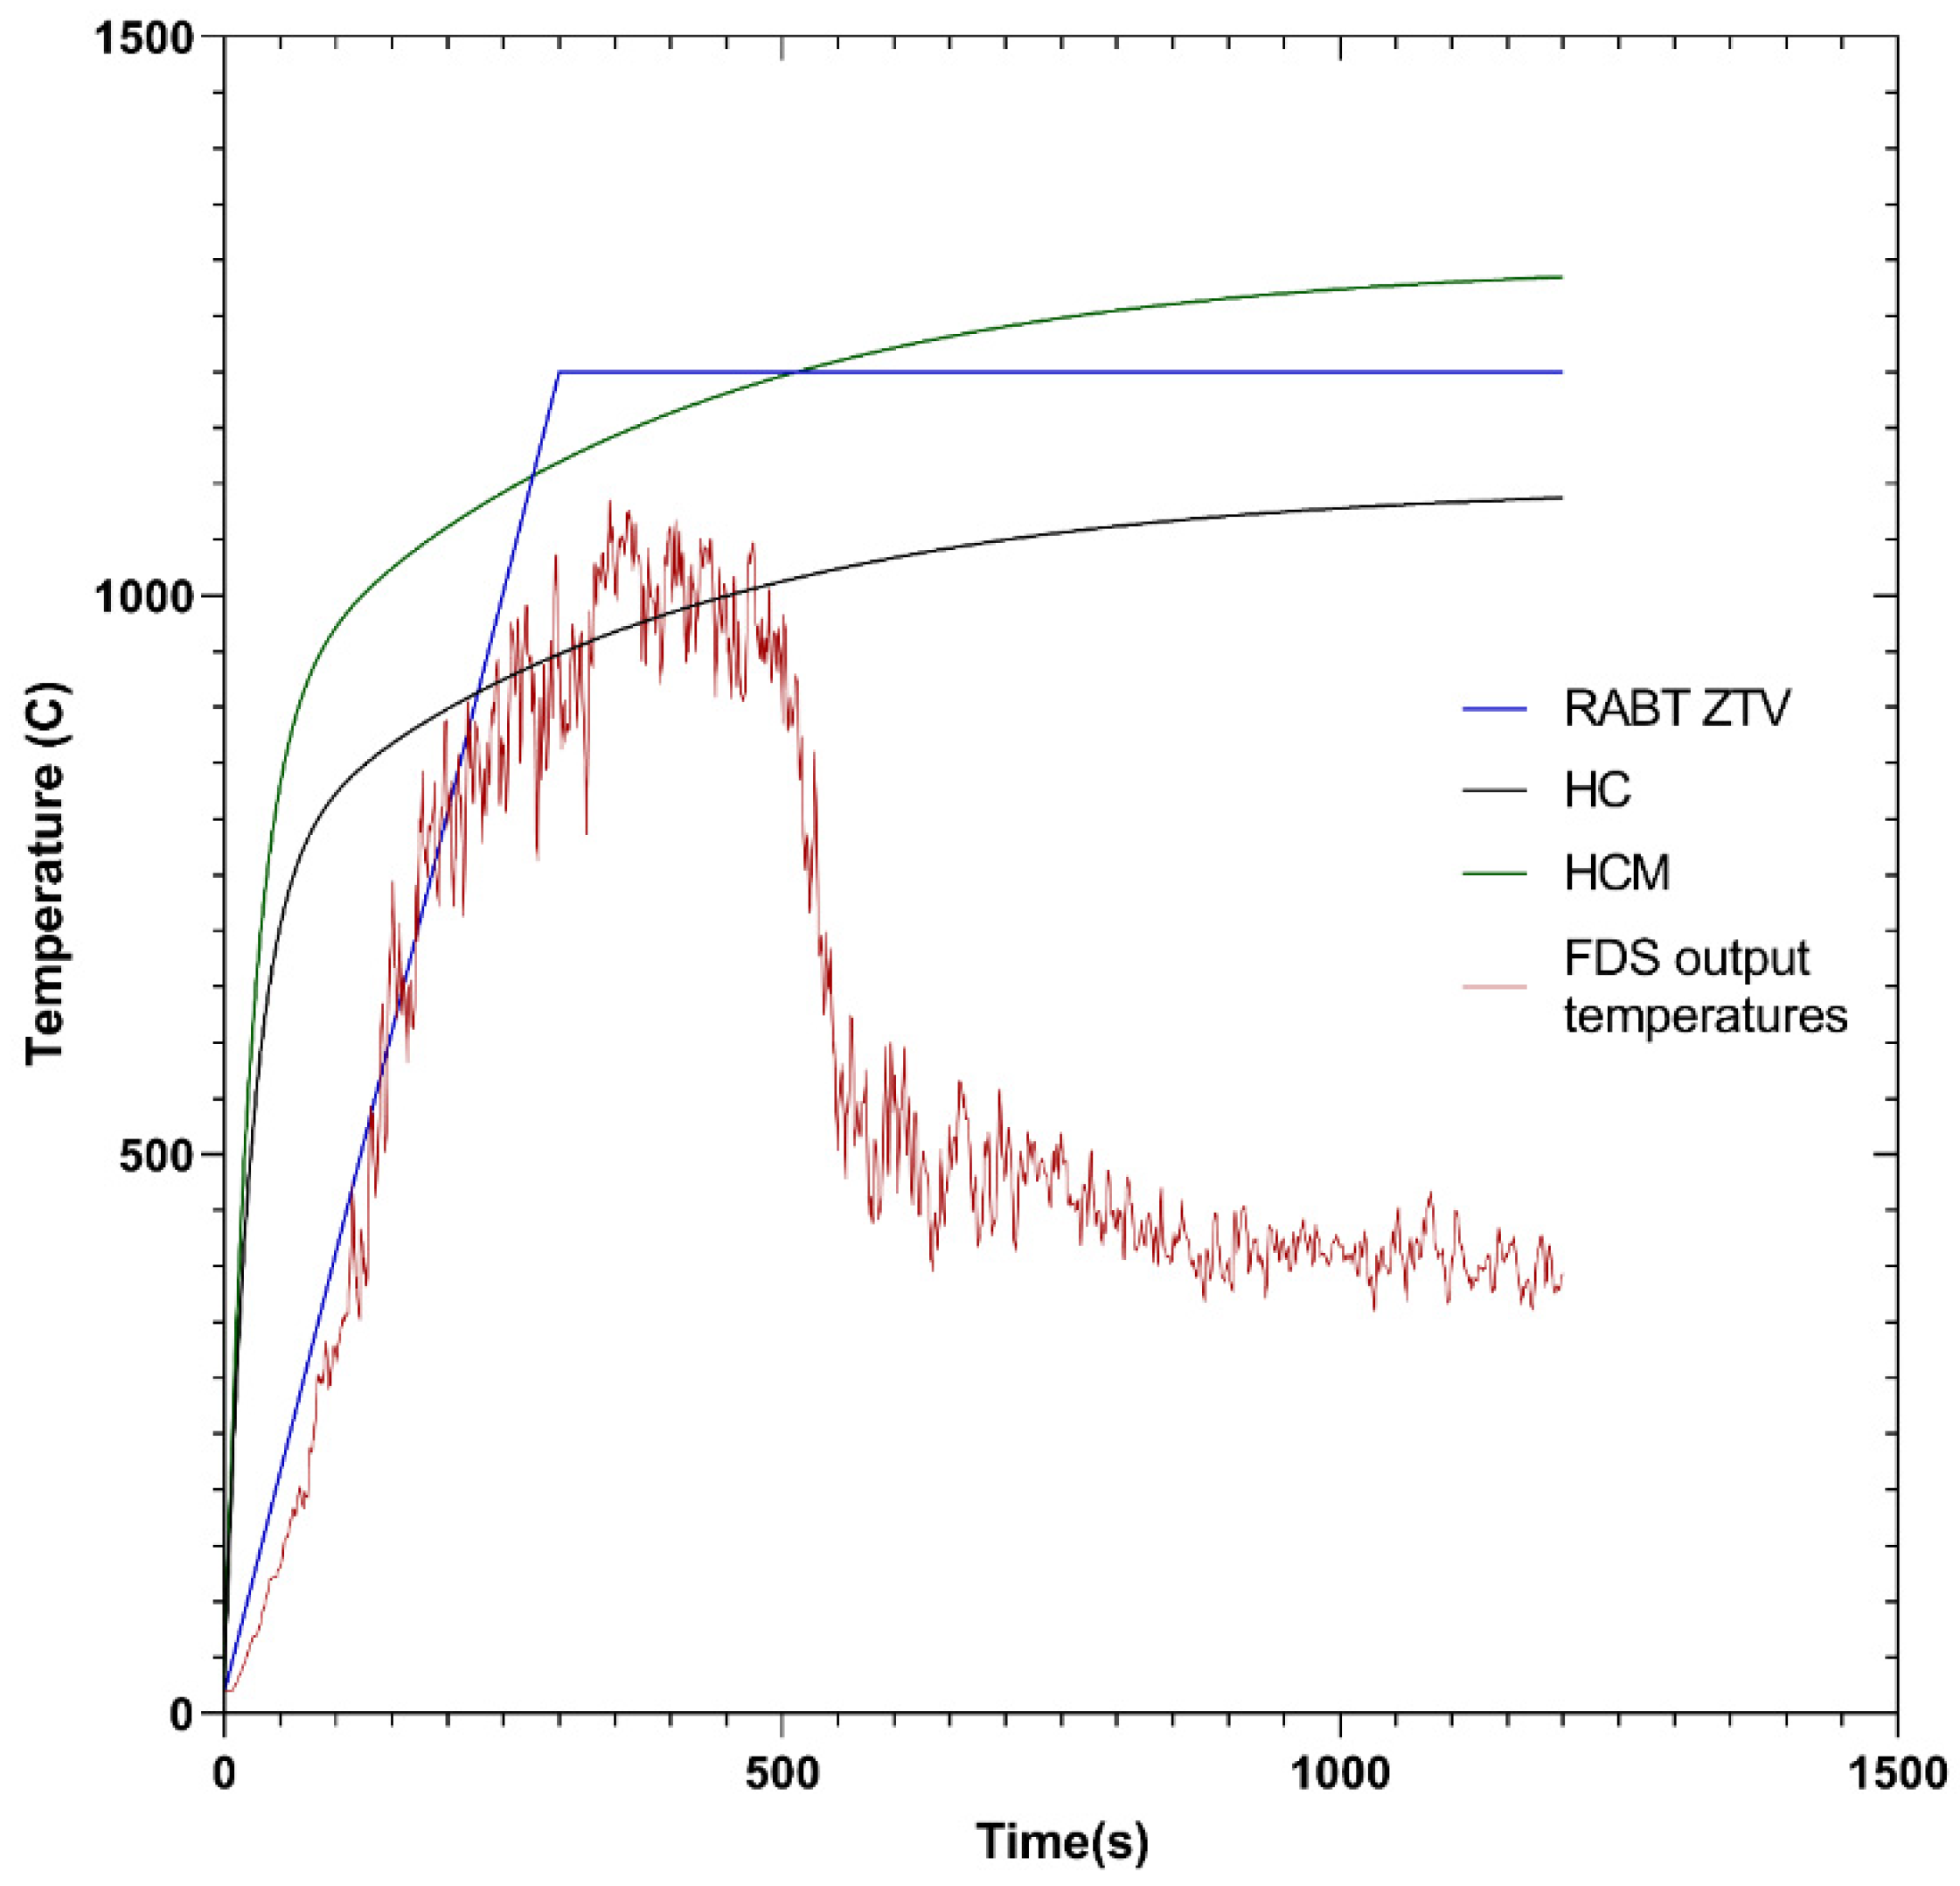
Additionally, for the validation of temperature, the results were compared with the hydrocarbon (HC) fire curve and modified hydrocarbon fire curve (HCM) used for fire resistance testing in structural designs and the RABT-ZTV train fire curve. The HC fire curve is used when there is a risk of liquid fires, e.g., in industrial plants (chemicals), on ships, pontoons, oil platforms, road, and railway tunnels, as well as for petrol and diesel pool fires. The HCM fire curve is derived from the HC curve and adjusted for French regulations. Both HC and HCM curves showed an abrupt temperature gradient in the first minutes, and their difference is the maximum temperature of 1100 and 1300 °C, respectively. The guideline for the equipment and operation of road tunnels (Richtlinie für die Ausstattung und den Betrieb von Straßentunneln) (RABT) defines the so-called RABT tunnel fire. This is often used for the fire protection design of tunnel structures. The RABT tunnel fire curve is an artificial fire curve and is intended to cover the maximum temperatures resulting from tunnel fires [19]. The curve can be used in tunnel design and testing. The HC and HCM fire curve equations are shown below in Equation (14) and Equation (15), respectively.
where is time in minutes.
The RABT-ZTV train fire curve followed a linear growth for the first 5 min, where it reached a maximum temperature of 1200 °C. A comparison of the ceiling gas temperature from the FDS output for Scenario C and the HC, HCM, and RABT-ZTV curves is shown in Figure 5. The FDS output was in good agreement with the RABT-ZTV fire curve for the first minutes, until the activation of the ventilation system, which happened at 480 s. Scenario C was selected because of the delay in the activation of the jet fans, so the temperature rise was more in accordance with the fire curves.
2.3. Evacuation and Tenability Analysis
For each scenario (A, B, and C) three different evacuation times were examined +60 s, +120 s, and +300 s after the start of the fire. The evacuation of passengers was effectuated along the walking platform on the side of the tunnel. The total number of passengers was 524 which corresponds to 80% capacity of an intercity train with 8 wagons, each of which can accommodate 80 passengers. The evacuation simulation and FED index calculation were conducted with Pathfinder, which is an interface for the FDS + EVAC code developed by the NIST [31].
For the three evacuation scenarios, eight occupant sources were created, each one simulating the door of a wagon. The total population number that exited the tunnel was 524 persons. This accounts for approximately 80% capacity of the train, assuming each wagon carries 80 passengers at full capacity. The profile of the passengers was set as the default profile provided, with a height of 1.8 m and a walking speed of 1.19 m/s. For the sake of convenience, only the entrance of the tunnel was marked as the exit point for the passengers to move towards to.
3. FDS Simulation Results
Three different scenarios were examined (A, B, and C) with three different fan activation times after a fire accident, at +180 s, +300 s, and +480 s, respectively. For all the cases, all the fans were activated at the same time. The three different scenarios for the different jet fan activation times were set up with the Pyrosim interface provided by Thunderhead Engineering. The extracted results were temperature, flow velocity, the volume fraction of gases, and heat release rate (HRR) values.
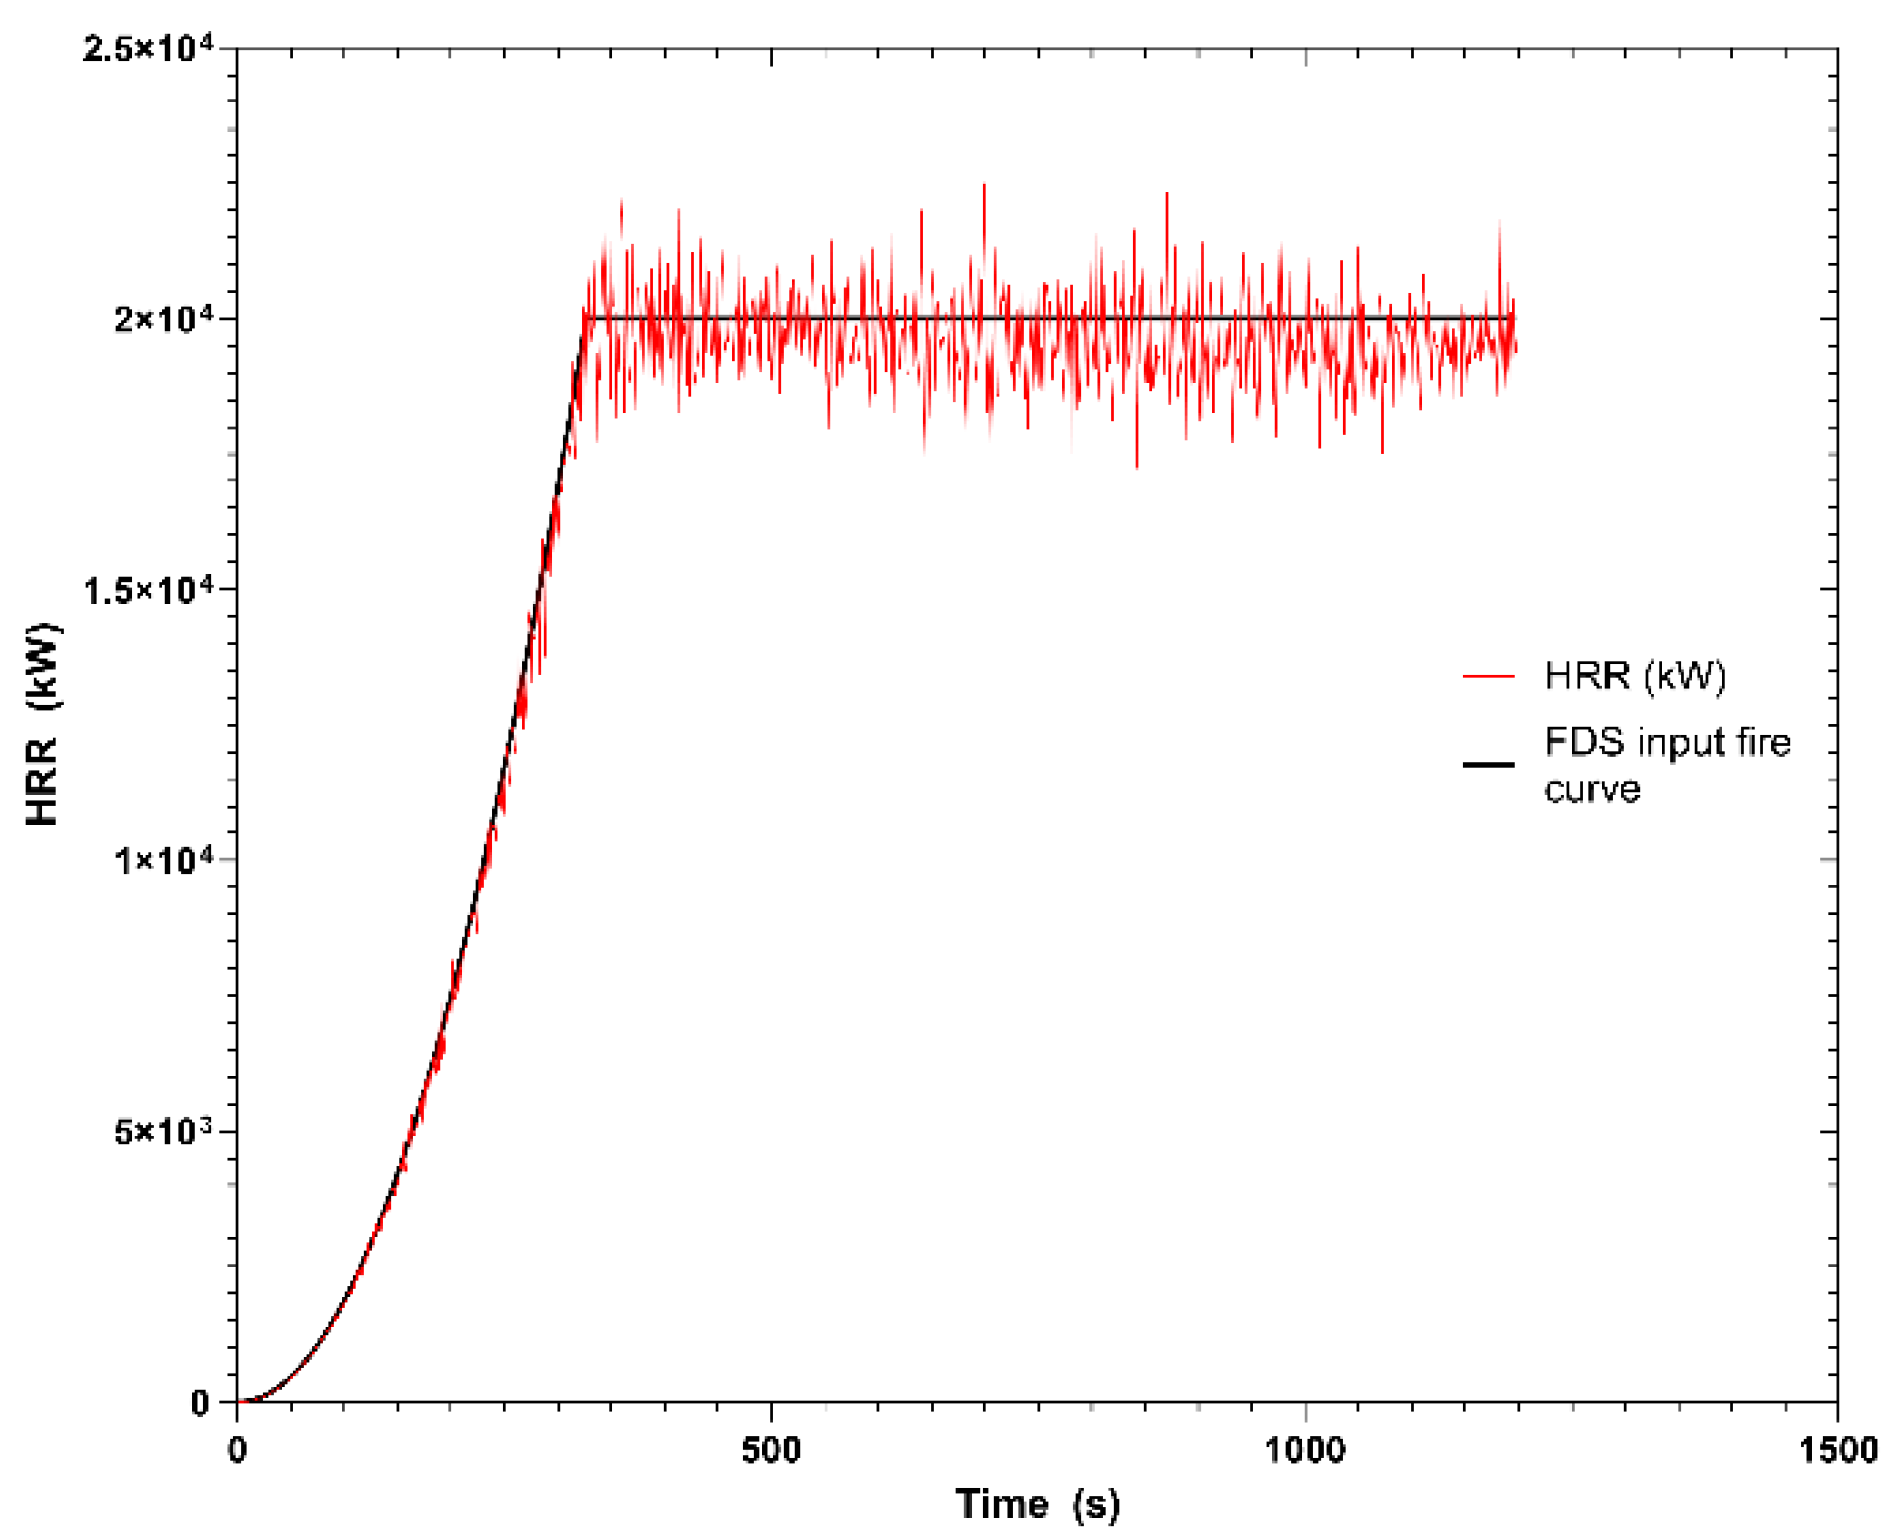
As shown in Figure 6, the input fire curve is in good agreement with the numerical results for the HRR curve.
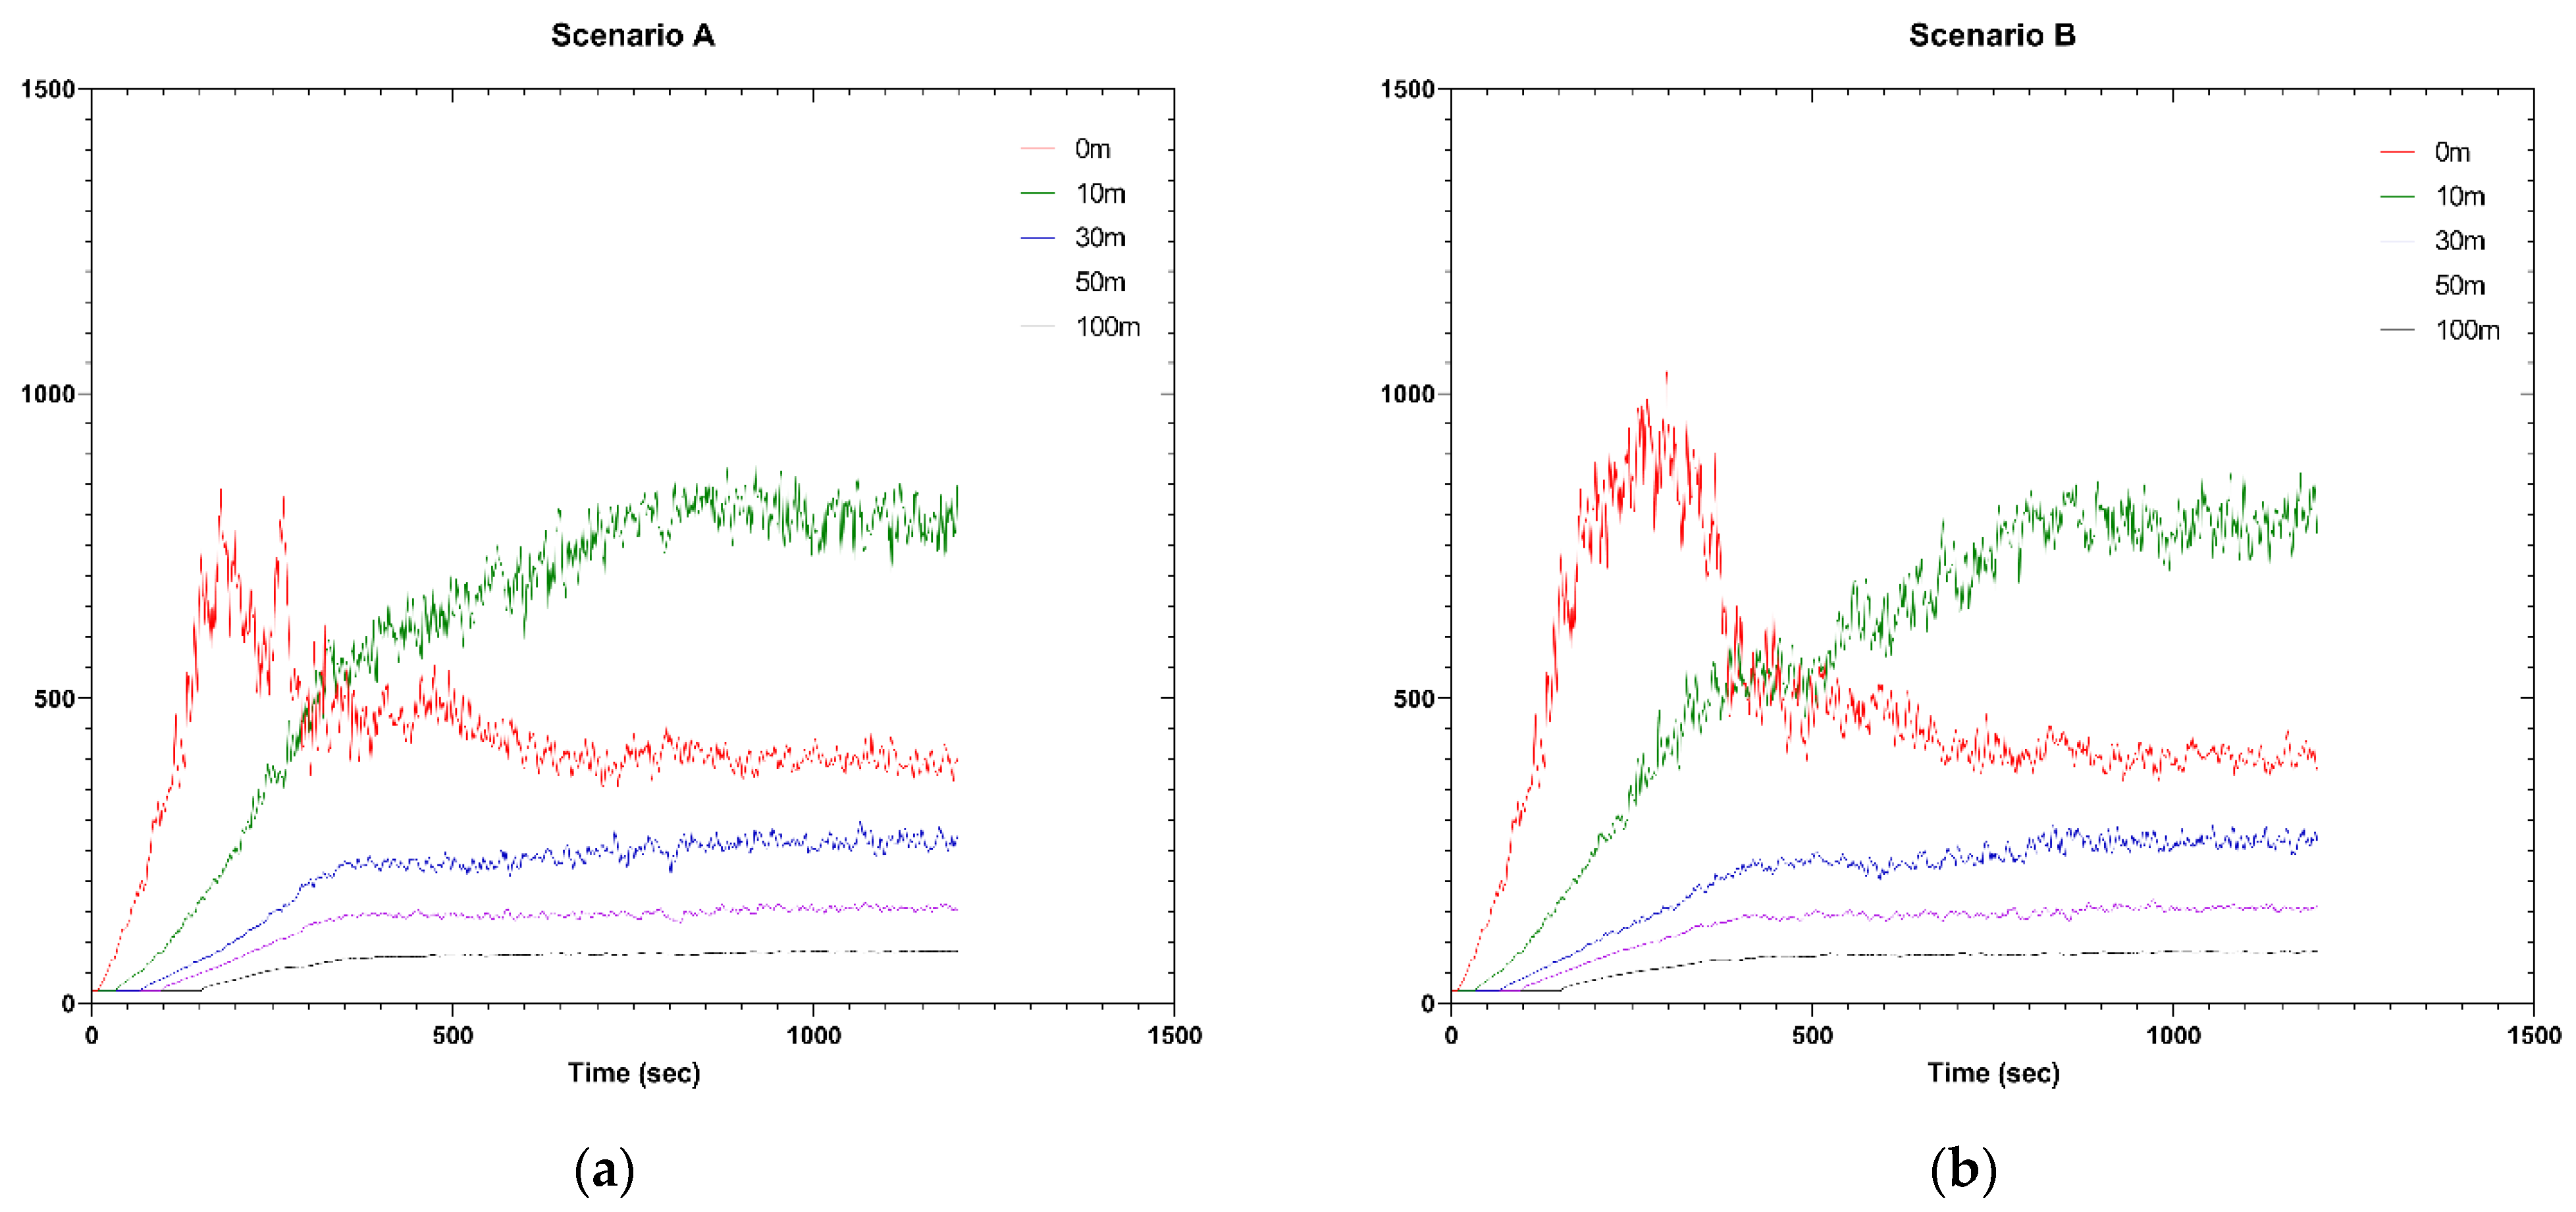
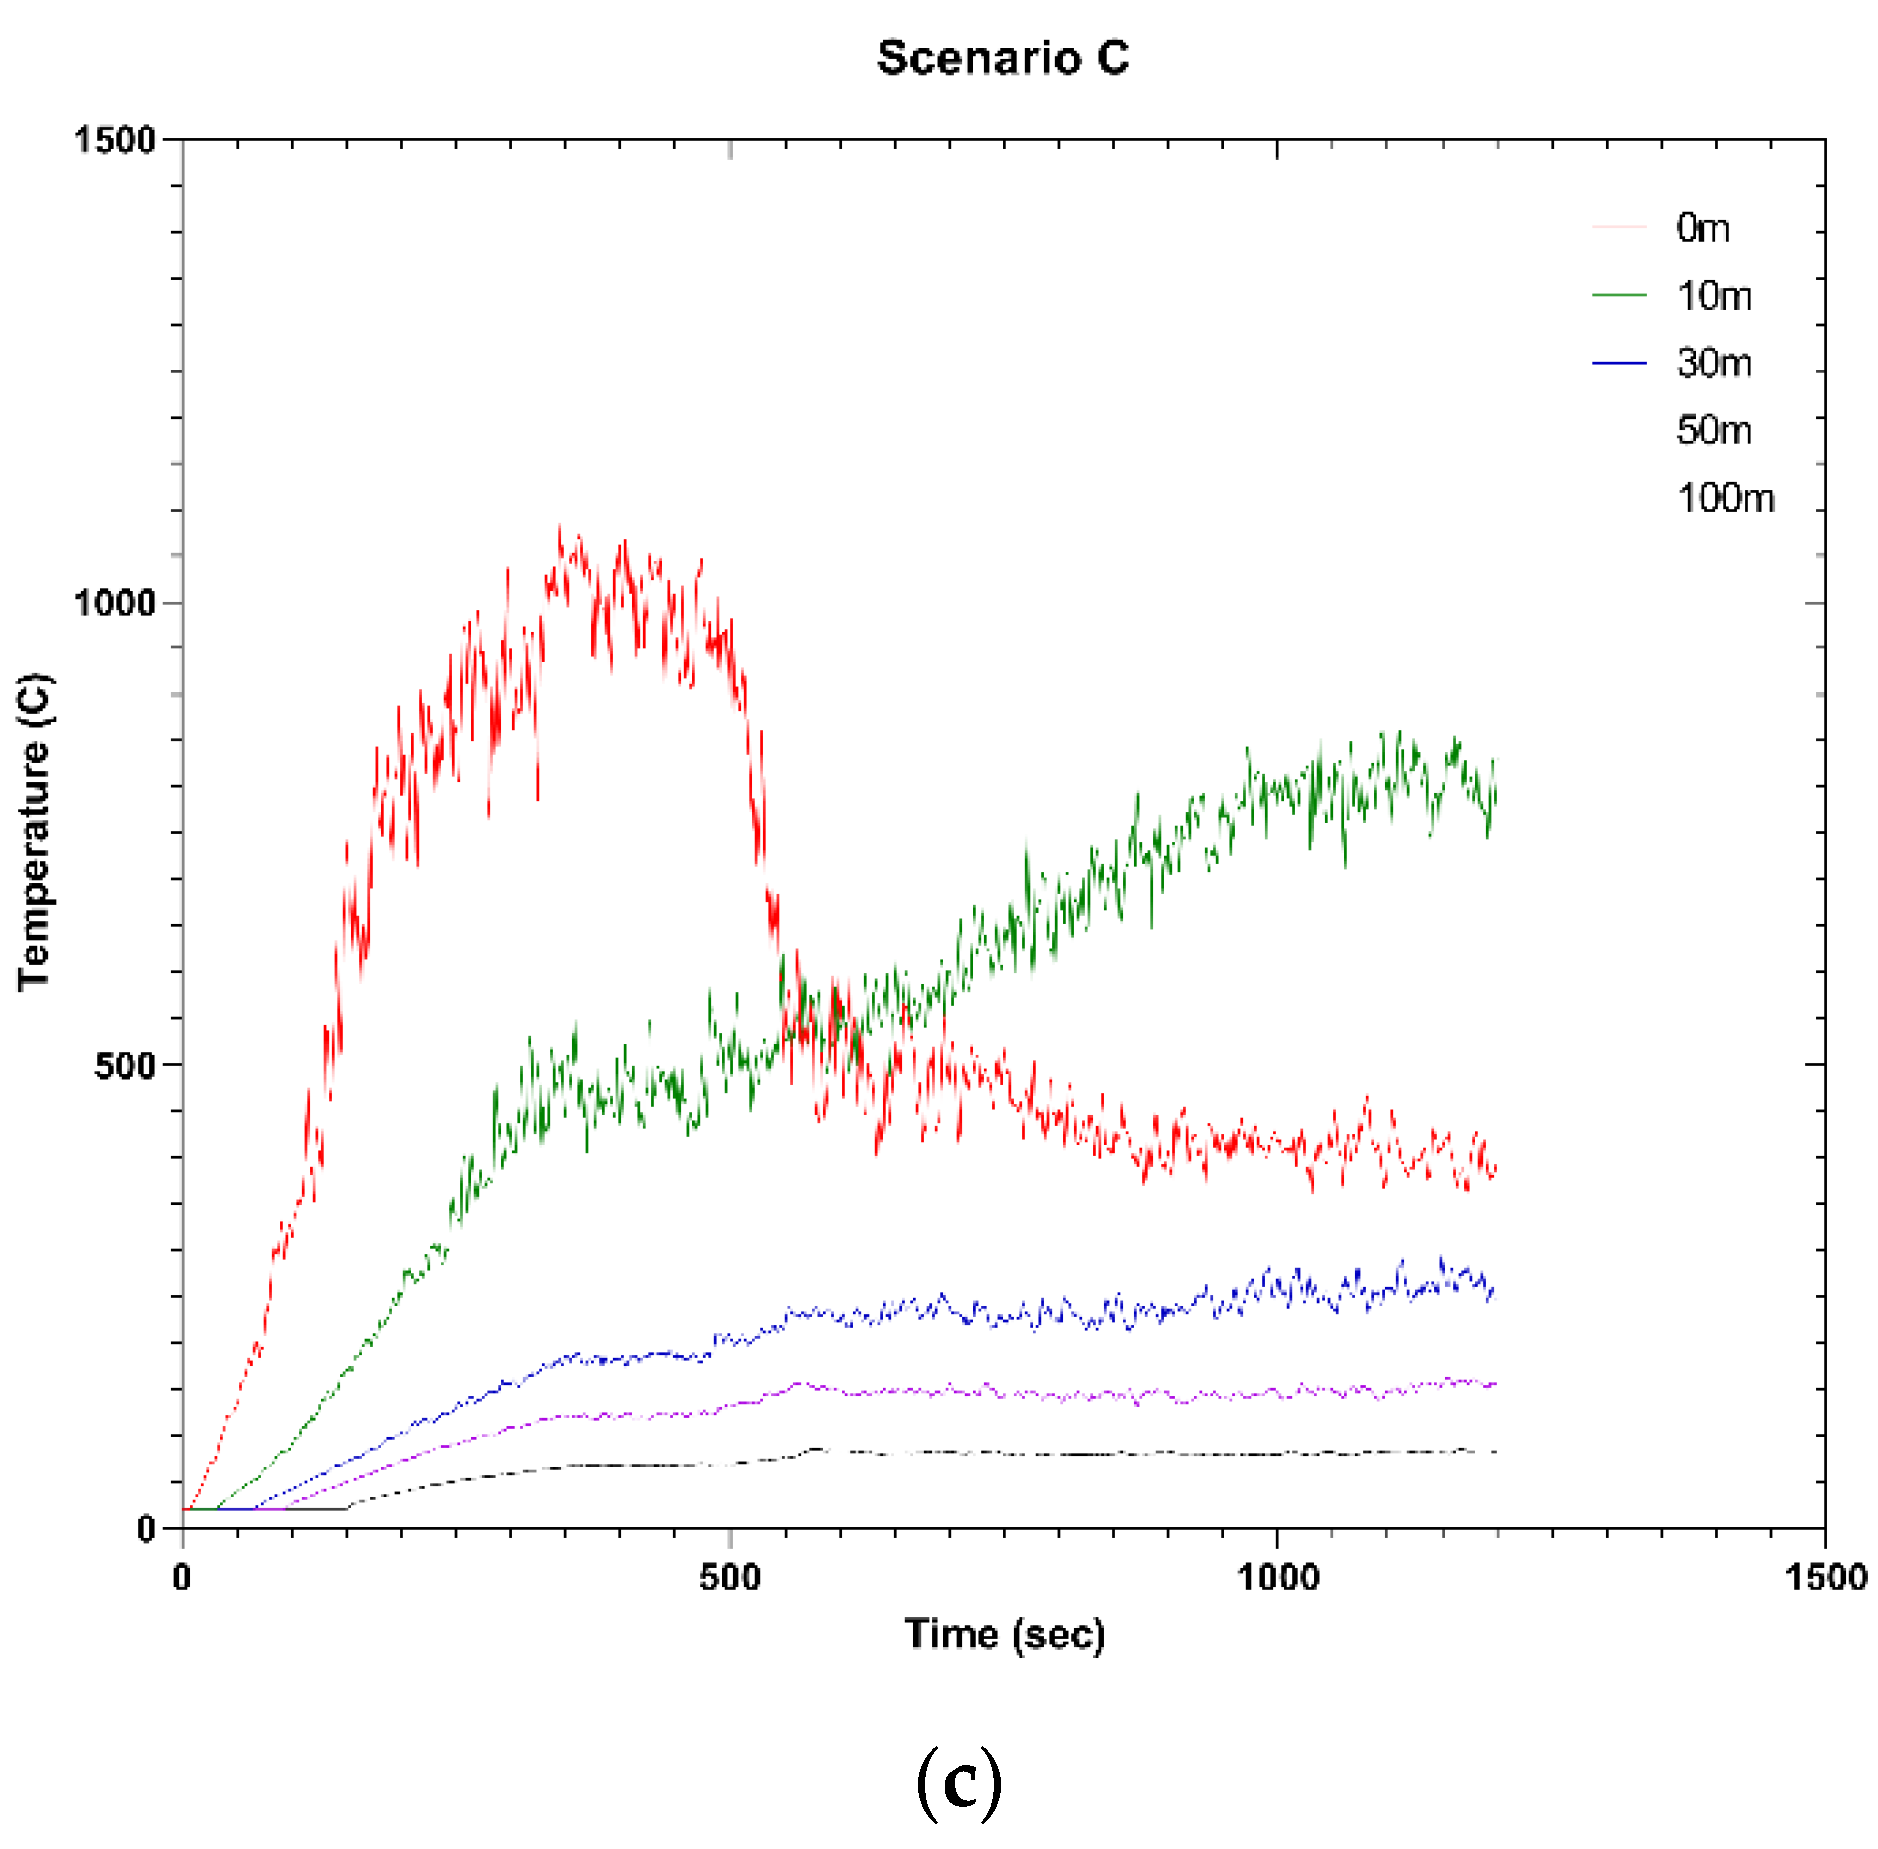
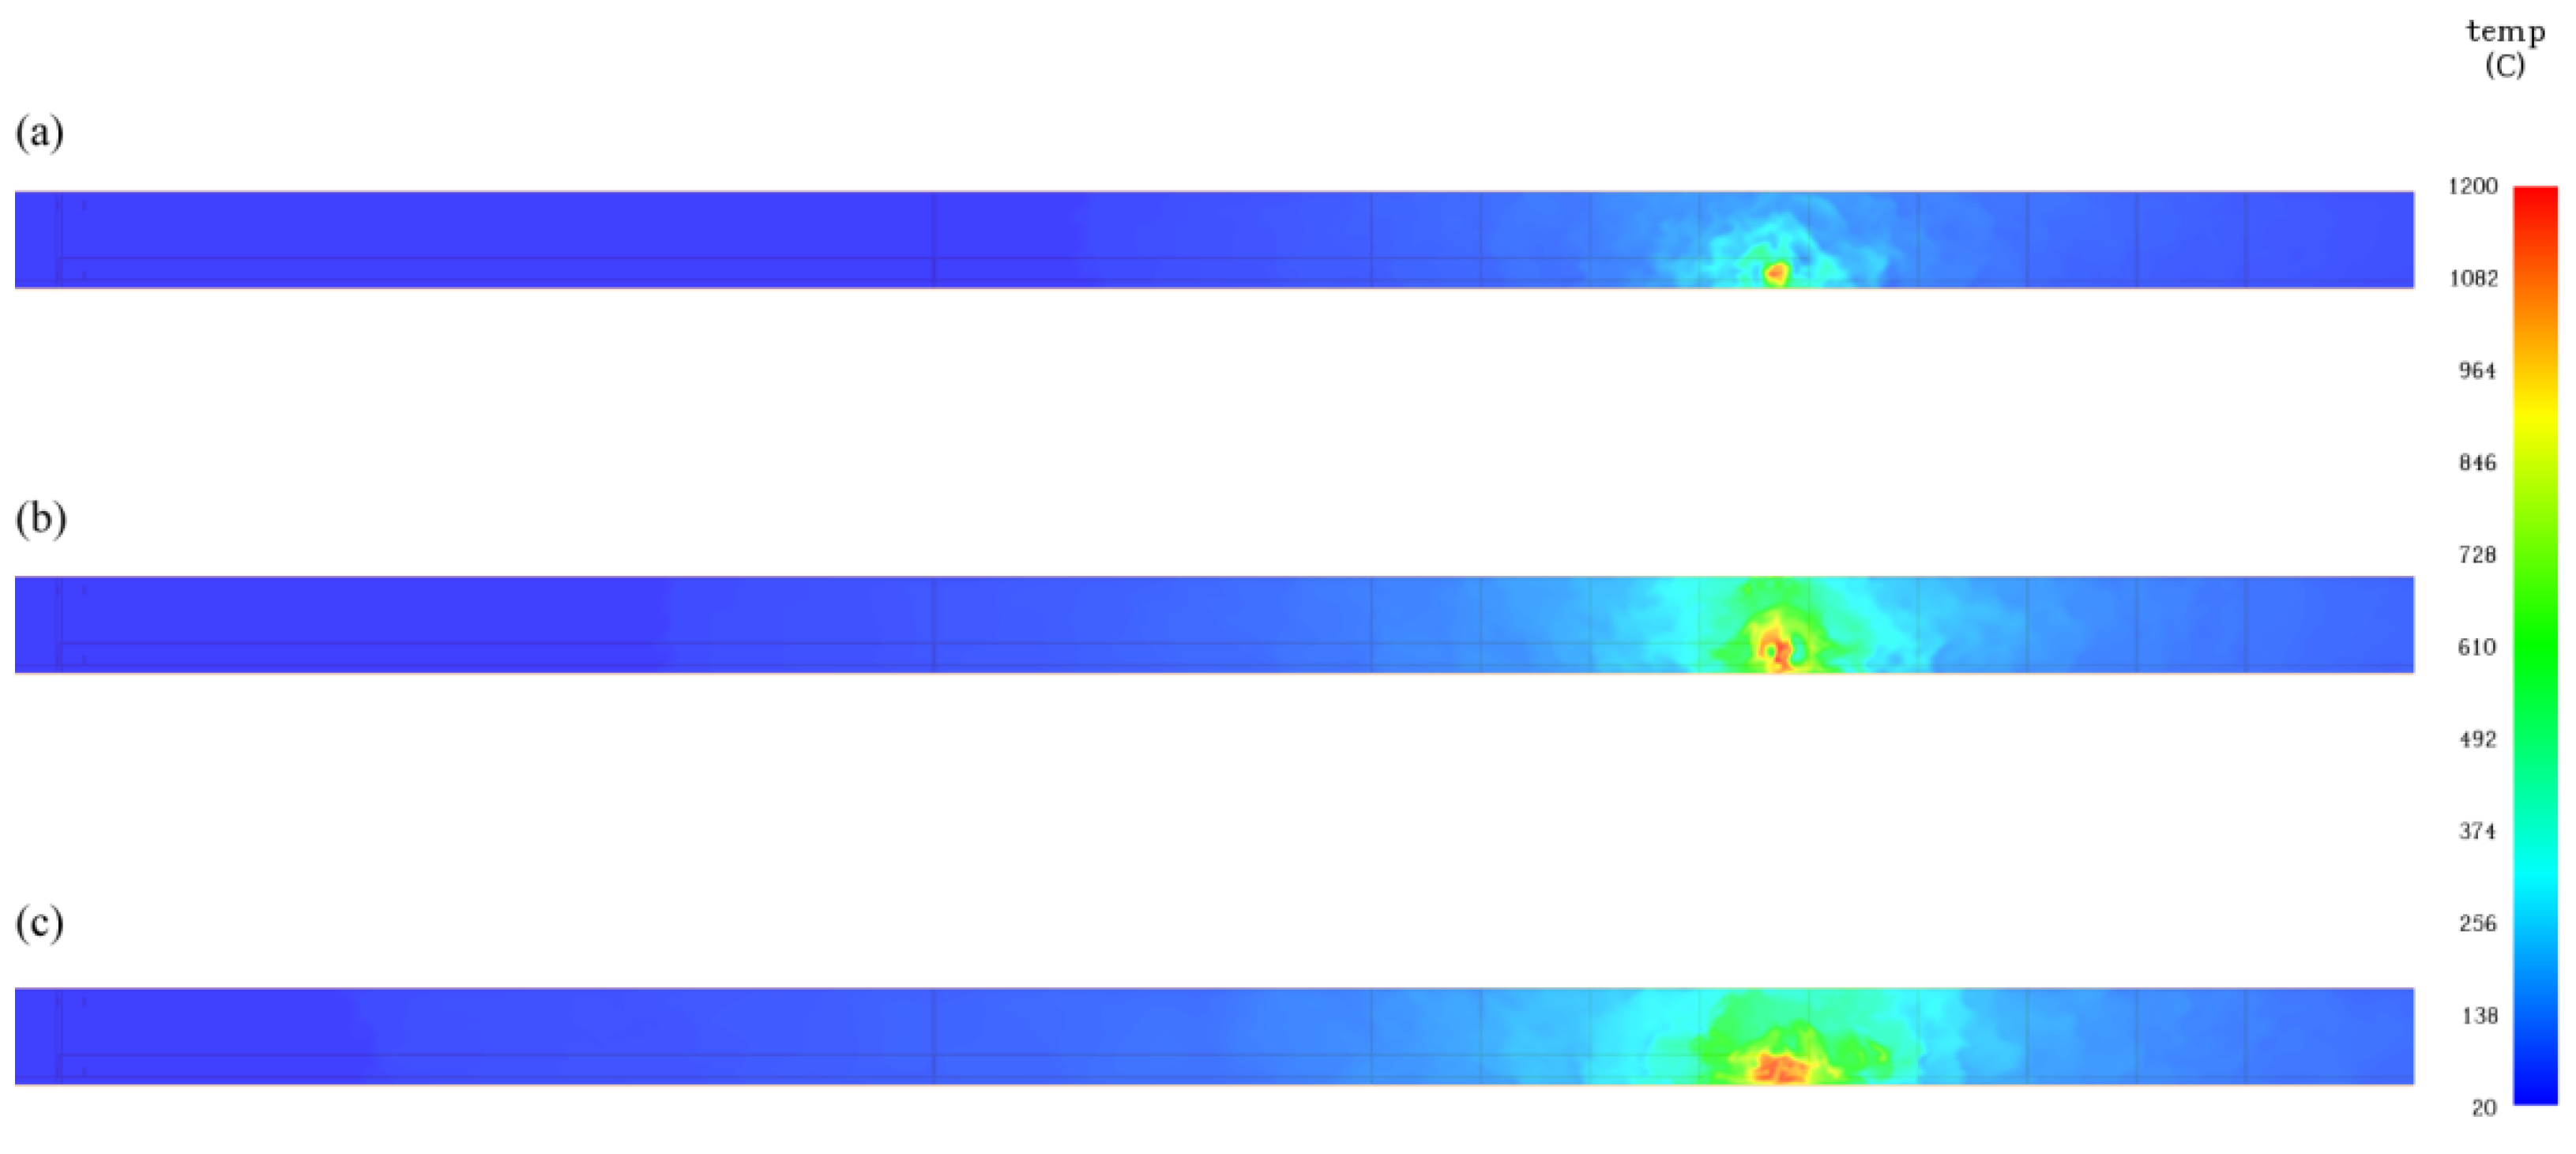
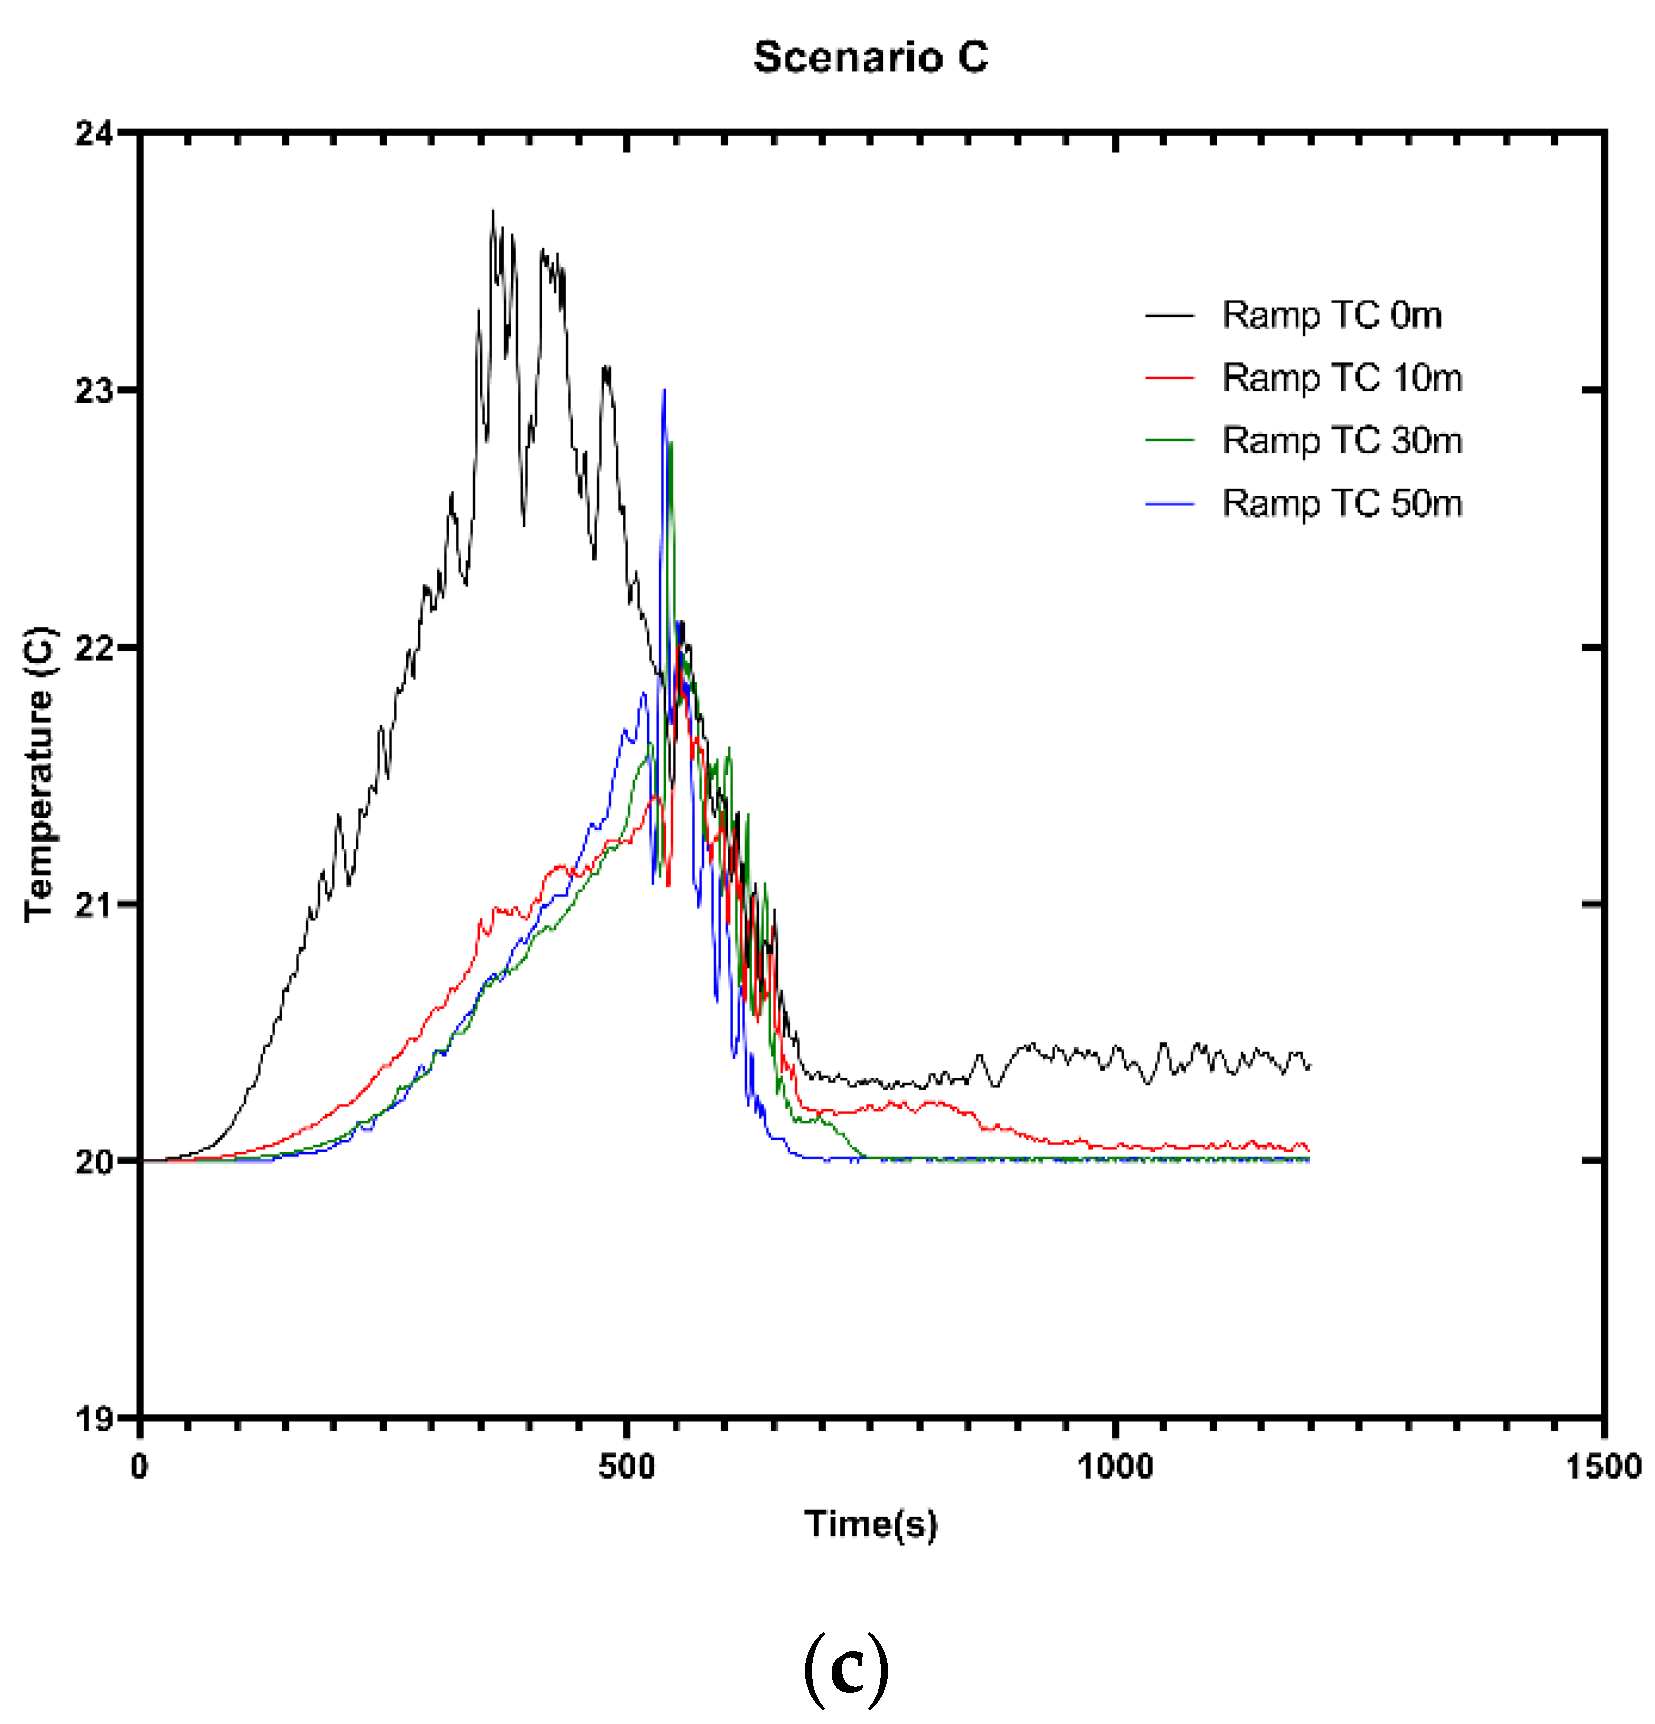
Figure 7 and Figure 8 show that the longer the activation of the ventilation system is delayed, the higher the temperatures appear in the tunnel ceiling. This rapid rise in high temperature can result in spalling, which is the detachment of structural material, such as concrete, often happening in an explosive way. This poses a great threat for the population in the tunnel.
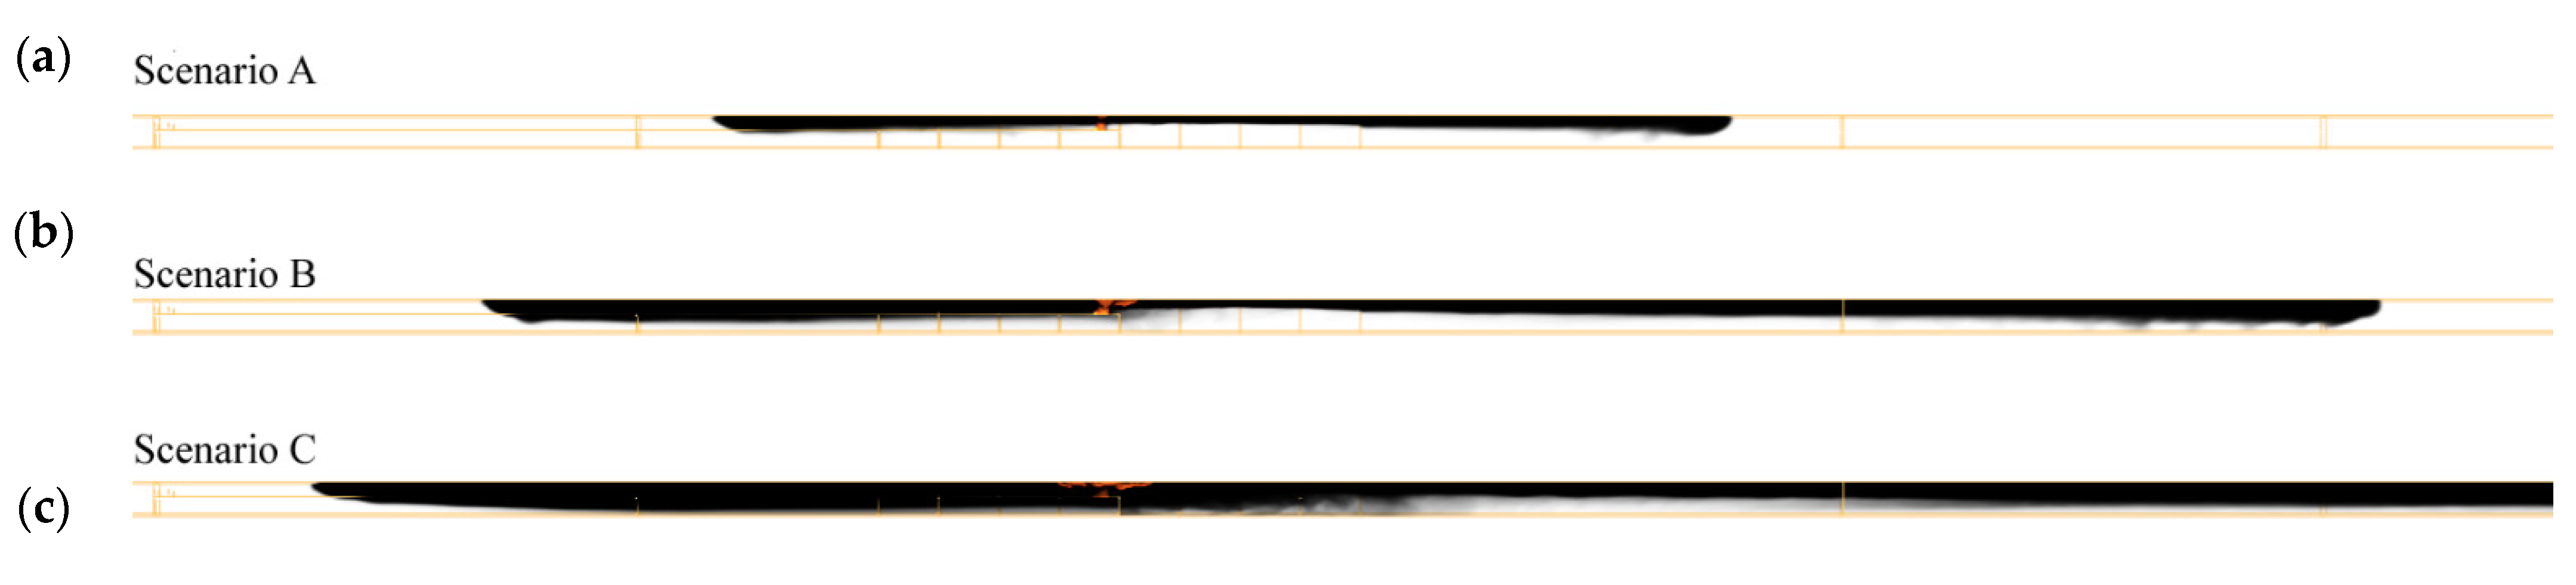
Moreover, a time delay in the ventilation system activation creates a greater smoke dispersion, as shown in Figure 9, and thus a greater dispersion of the harmful combustion products. This can affect the evacuation process due to reduced visibility and soot inhalation.
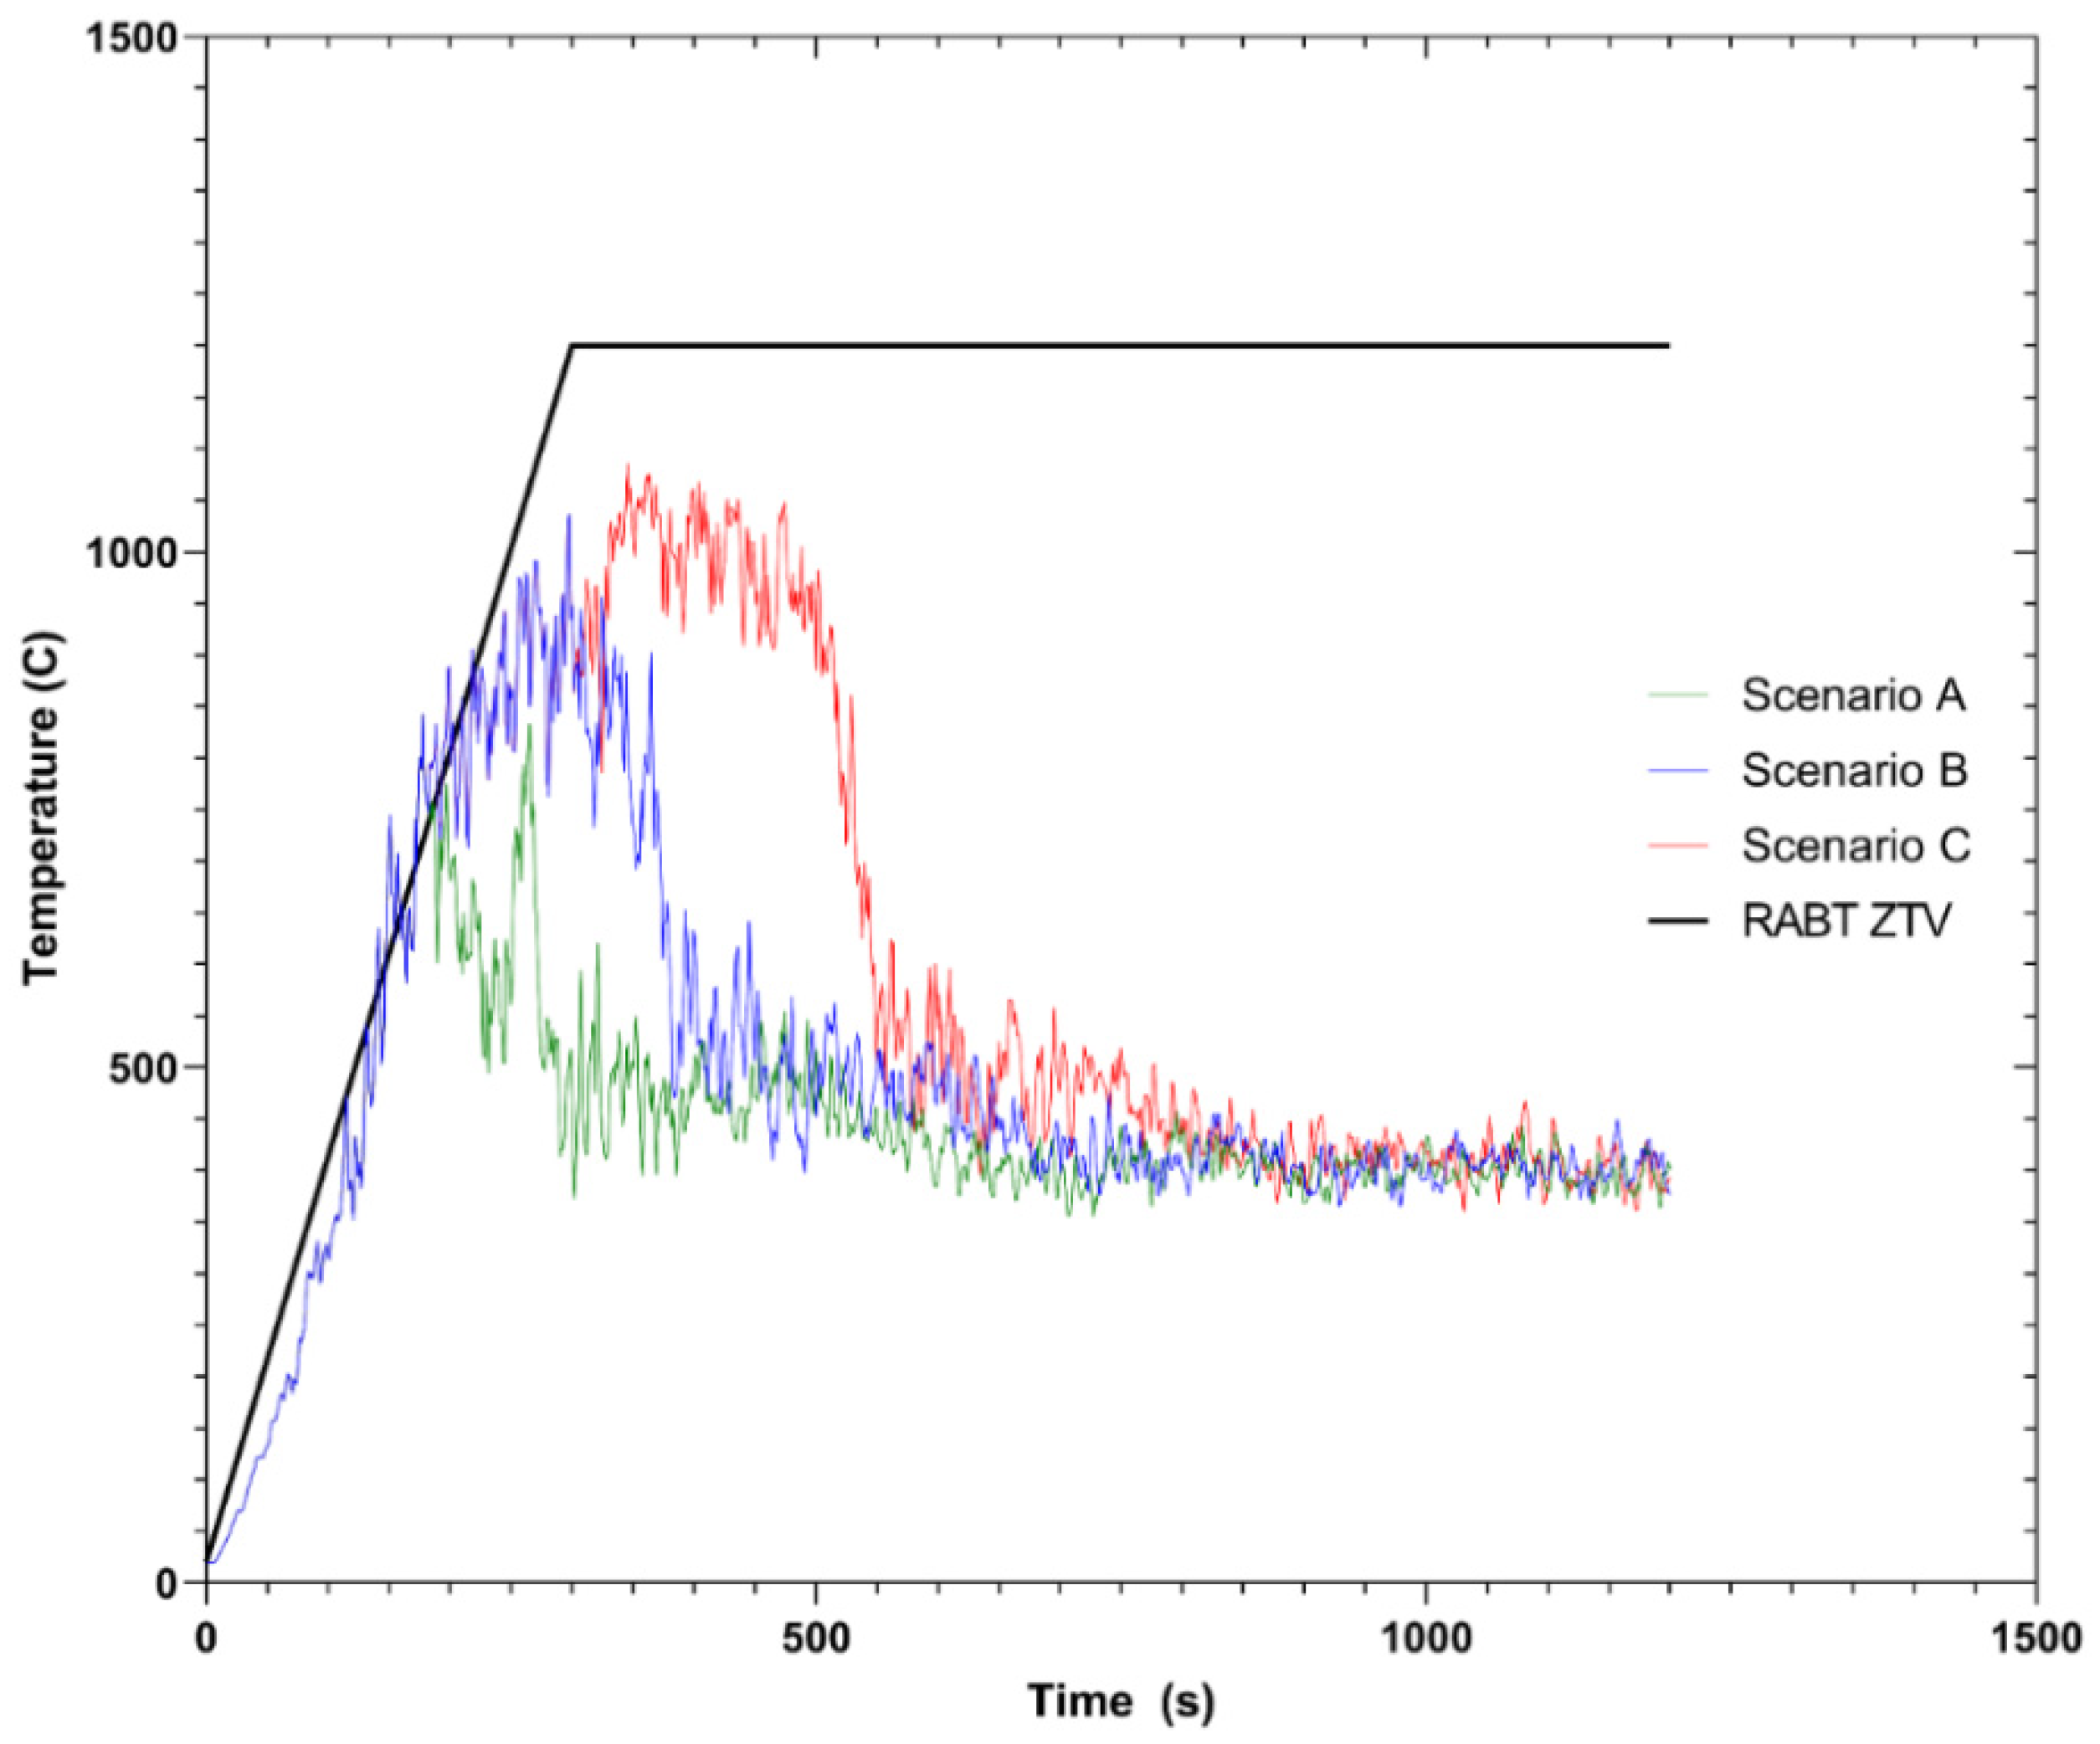
As shown in Figure 10, the temperatures at the ceiling above the fire source are in good agreement with the RABT ZTV fire curve in the first minutes of the simulation. Then, when the ventilation system was activated, the temperature dropped and reached a steady value of around 450 °C.
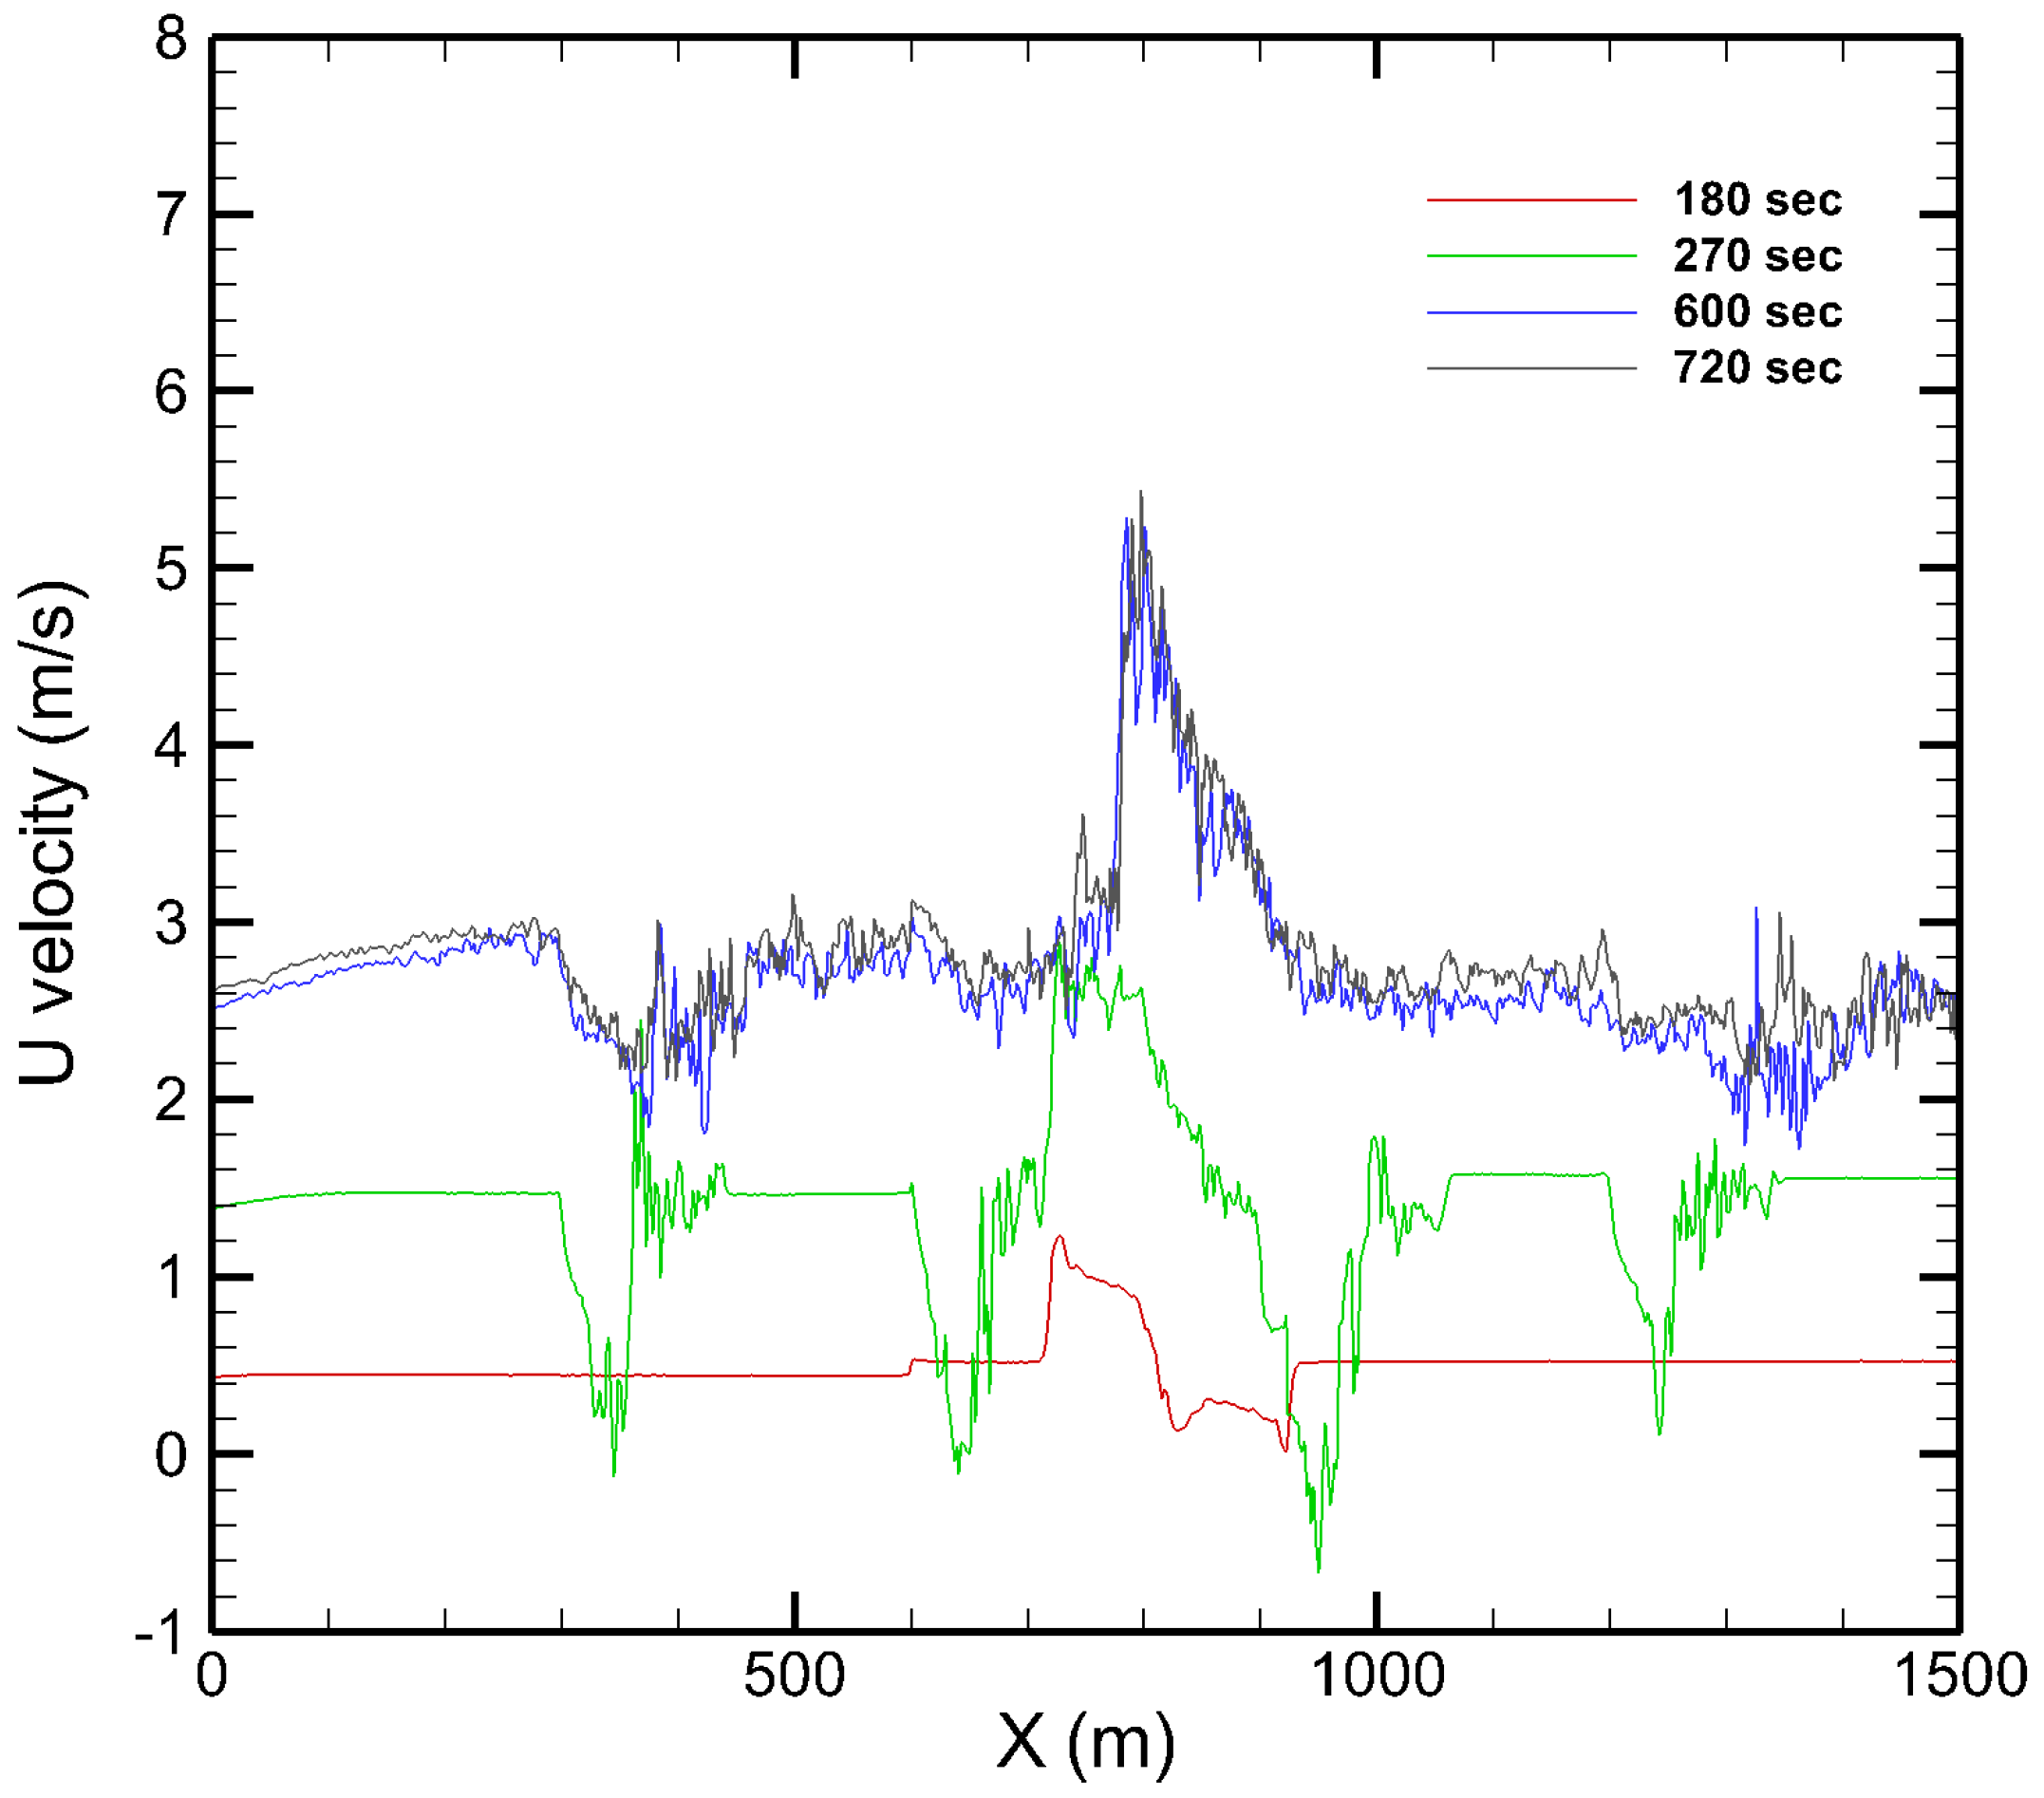
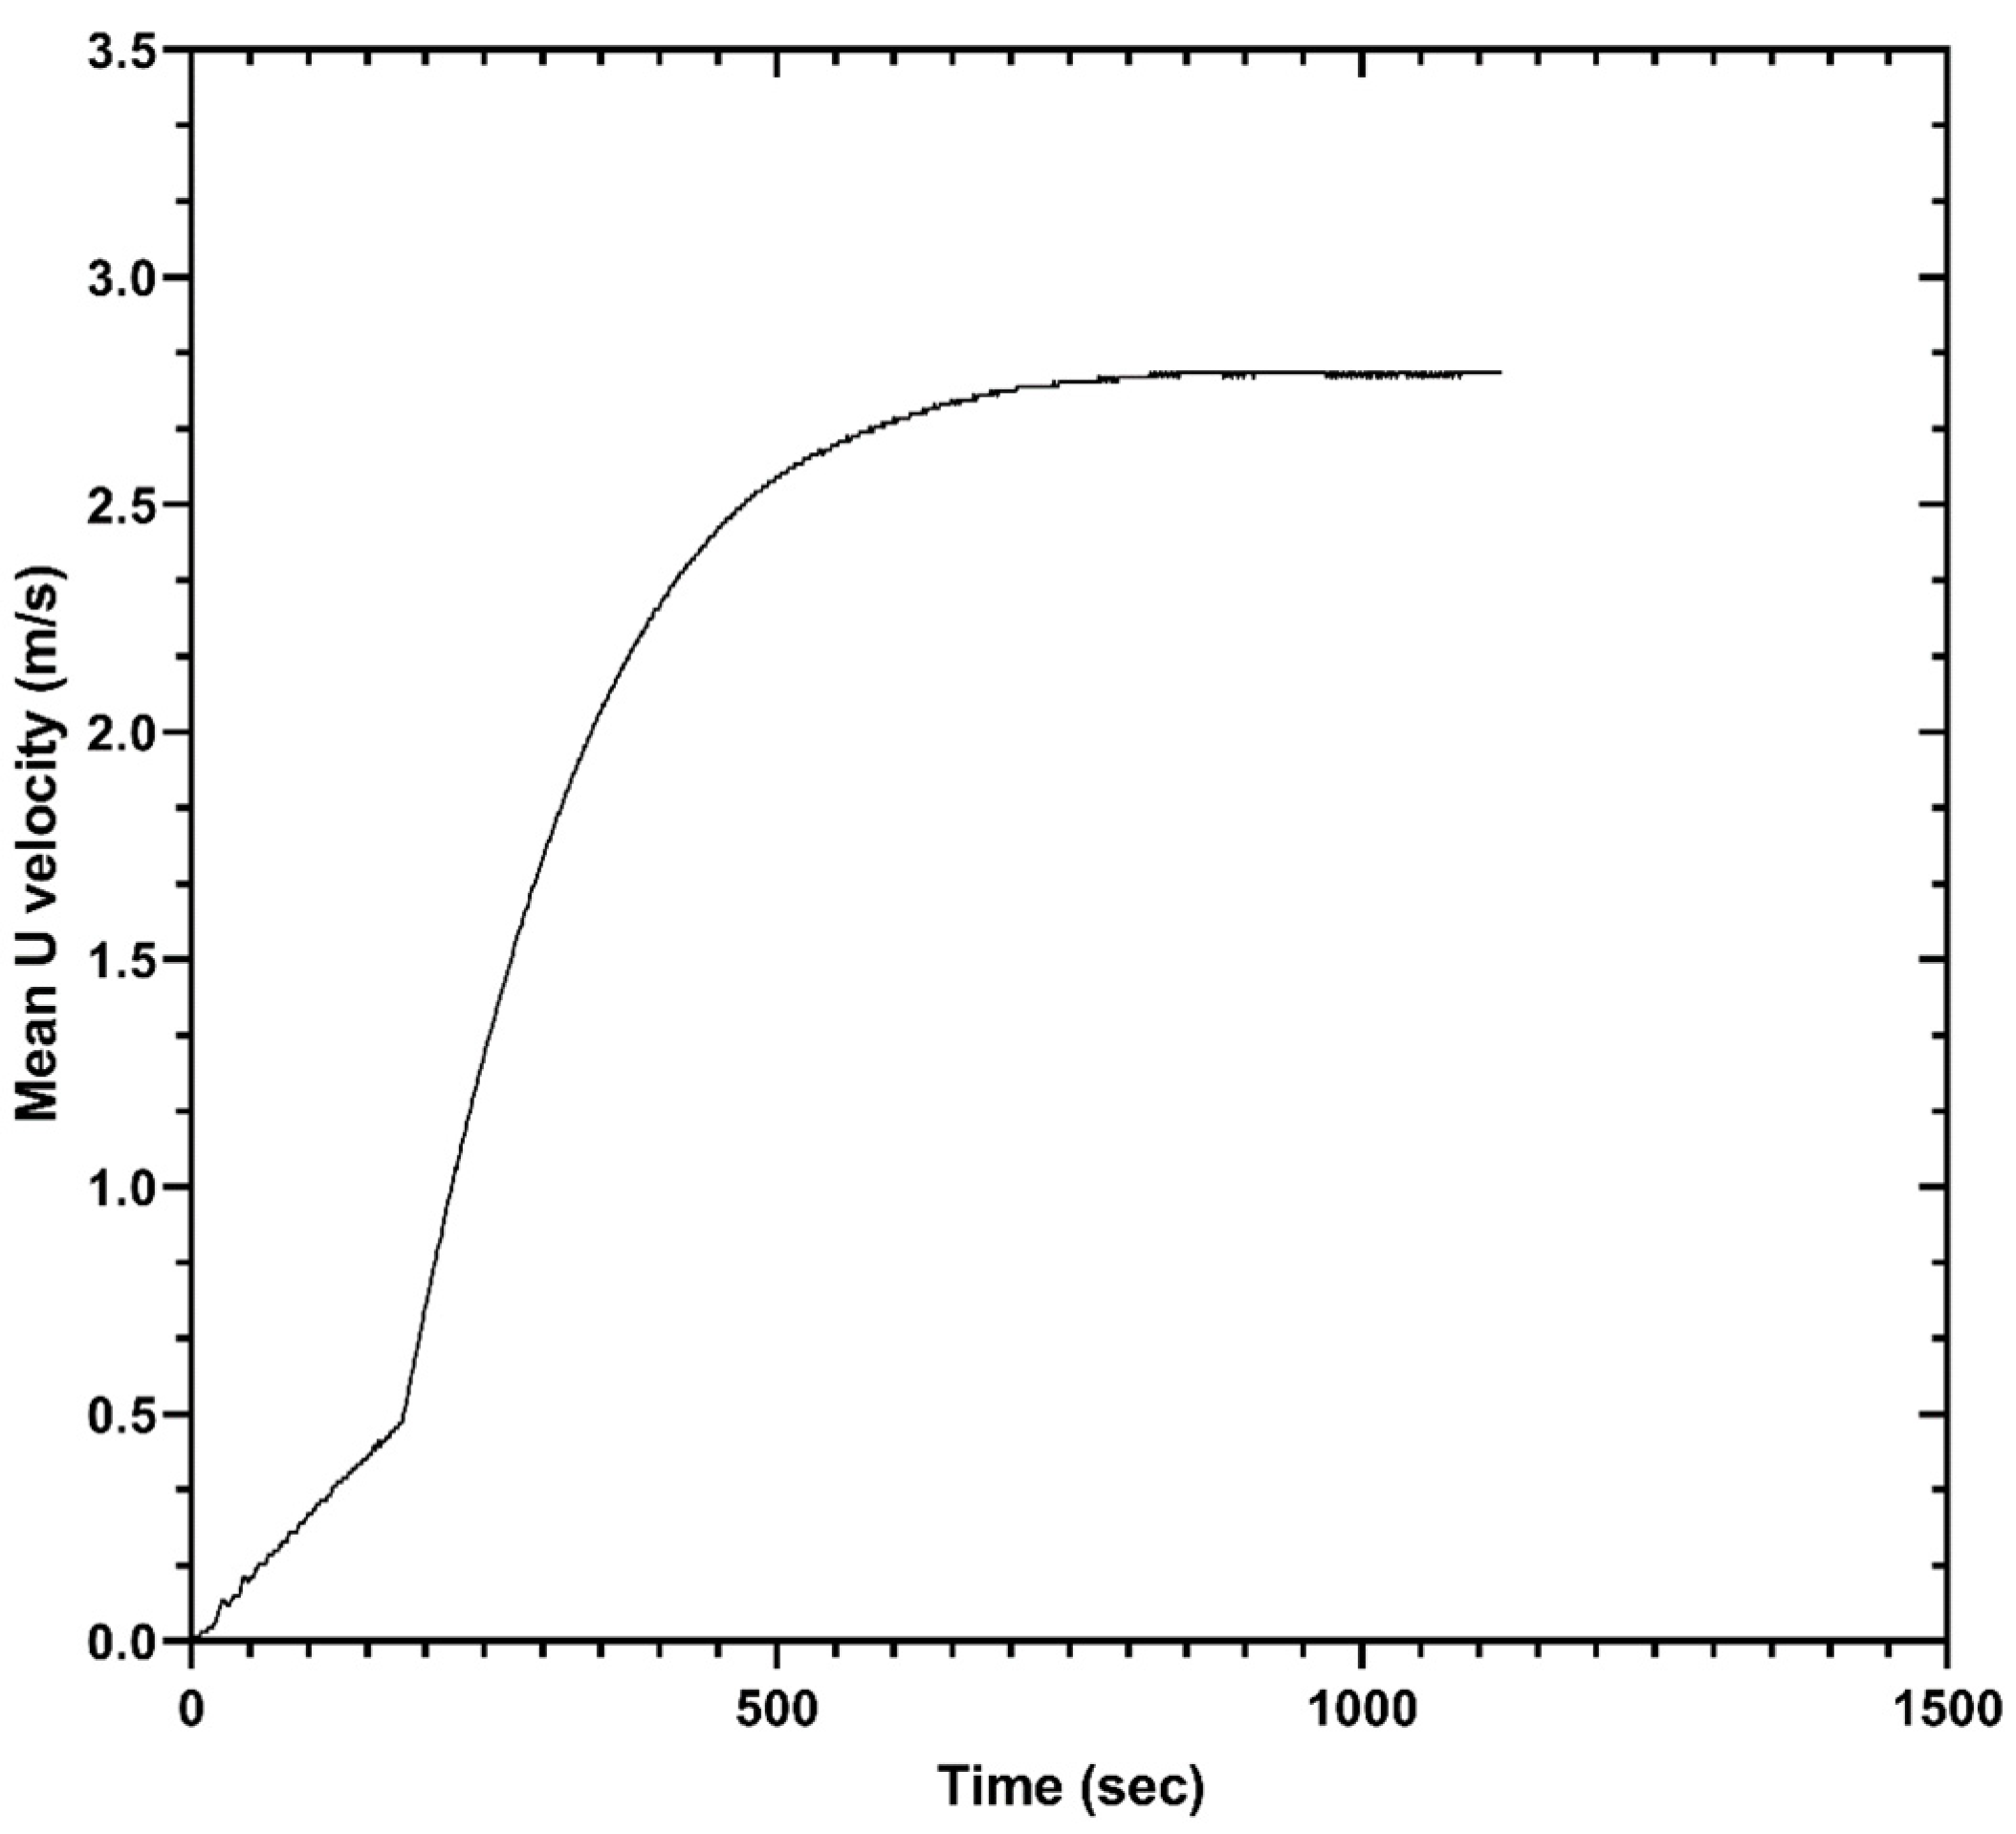
Figure 11 shows that the development of ventilation flow started immediately after the activation of the jet fans. The air flow inside the tunnel needs about 300 s, after the jet fans achieve the nominal power, to reach the critical velocity value, but the thrust of the jet fans, even before they reach full power, is capable of pushing the smoke downwind of the fire source. Moreover, Scenario A showed some smoke layer entertainment, which was due to the pressure difference at the tunnel openings, which created a draft with a velocity around 0.5 m/s (Figure 12 at the 180 s time frame). As shown in Figure 12, the peak at 750 m (fire source) was due to the smoke layer and the presence of the train, which reduced the area of the tunnel in this section, resulting in higher velocities. This phenomenon can be seen in Figure 11, where, near the train location, a great volume of the flow had the critical velocity value. As depicted in Figure 13, the mean longitudinal velocity was in the range of 2.7 m/s and was achieved within 600 s from the jet fan activation time. Ventilation conditions are achieved as long as the jet fans reach their nominal output volume flow, but this does not mean the tunnel airflow velocity has reached the critical value.
4. Temperature and FED Index
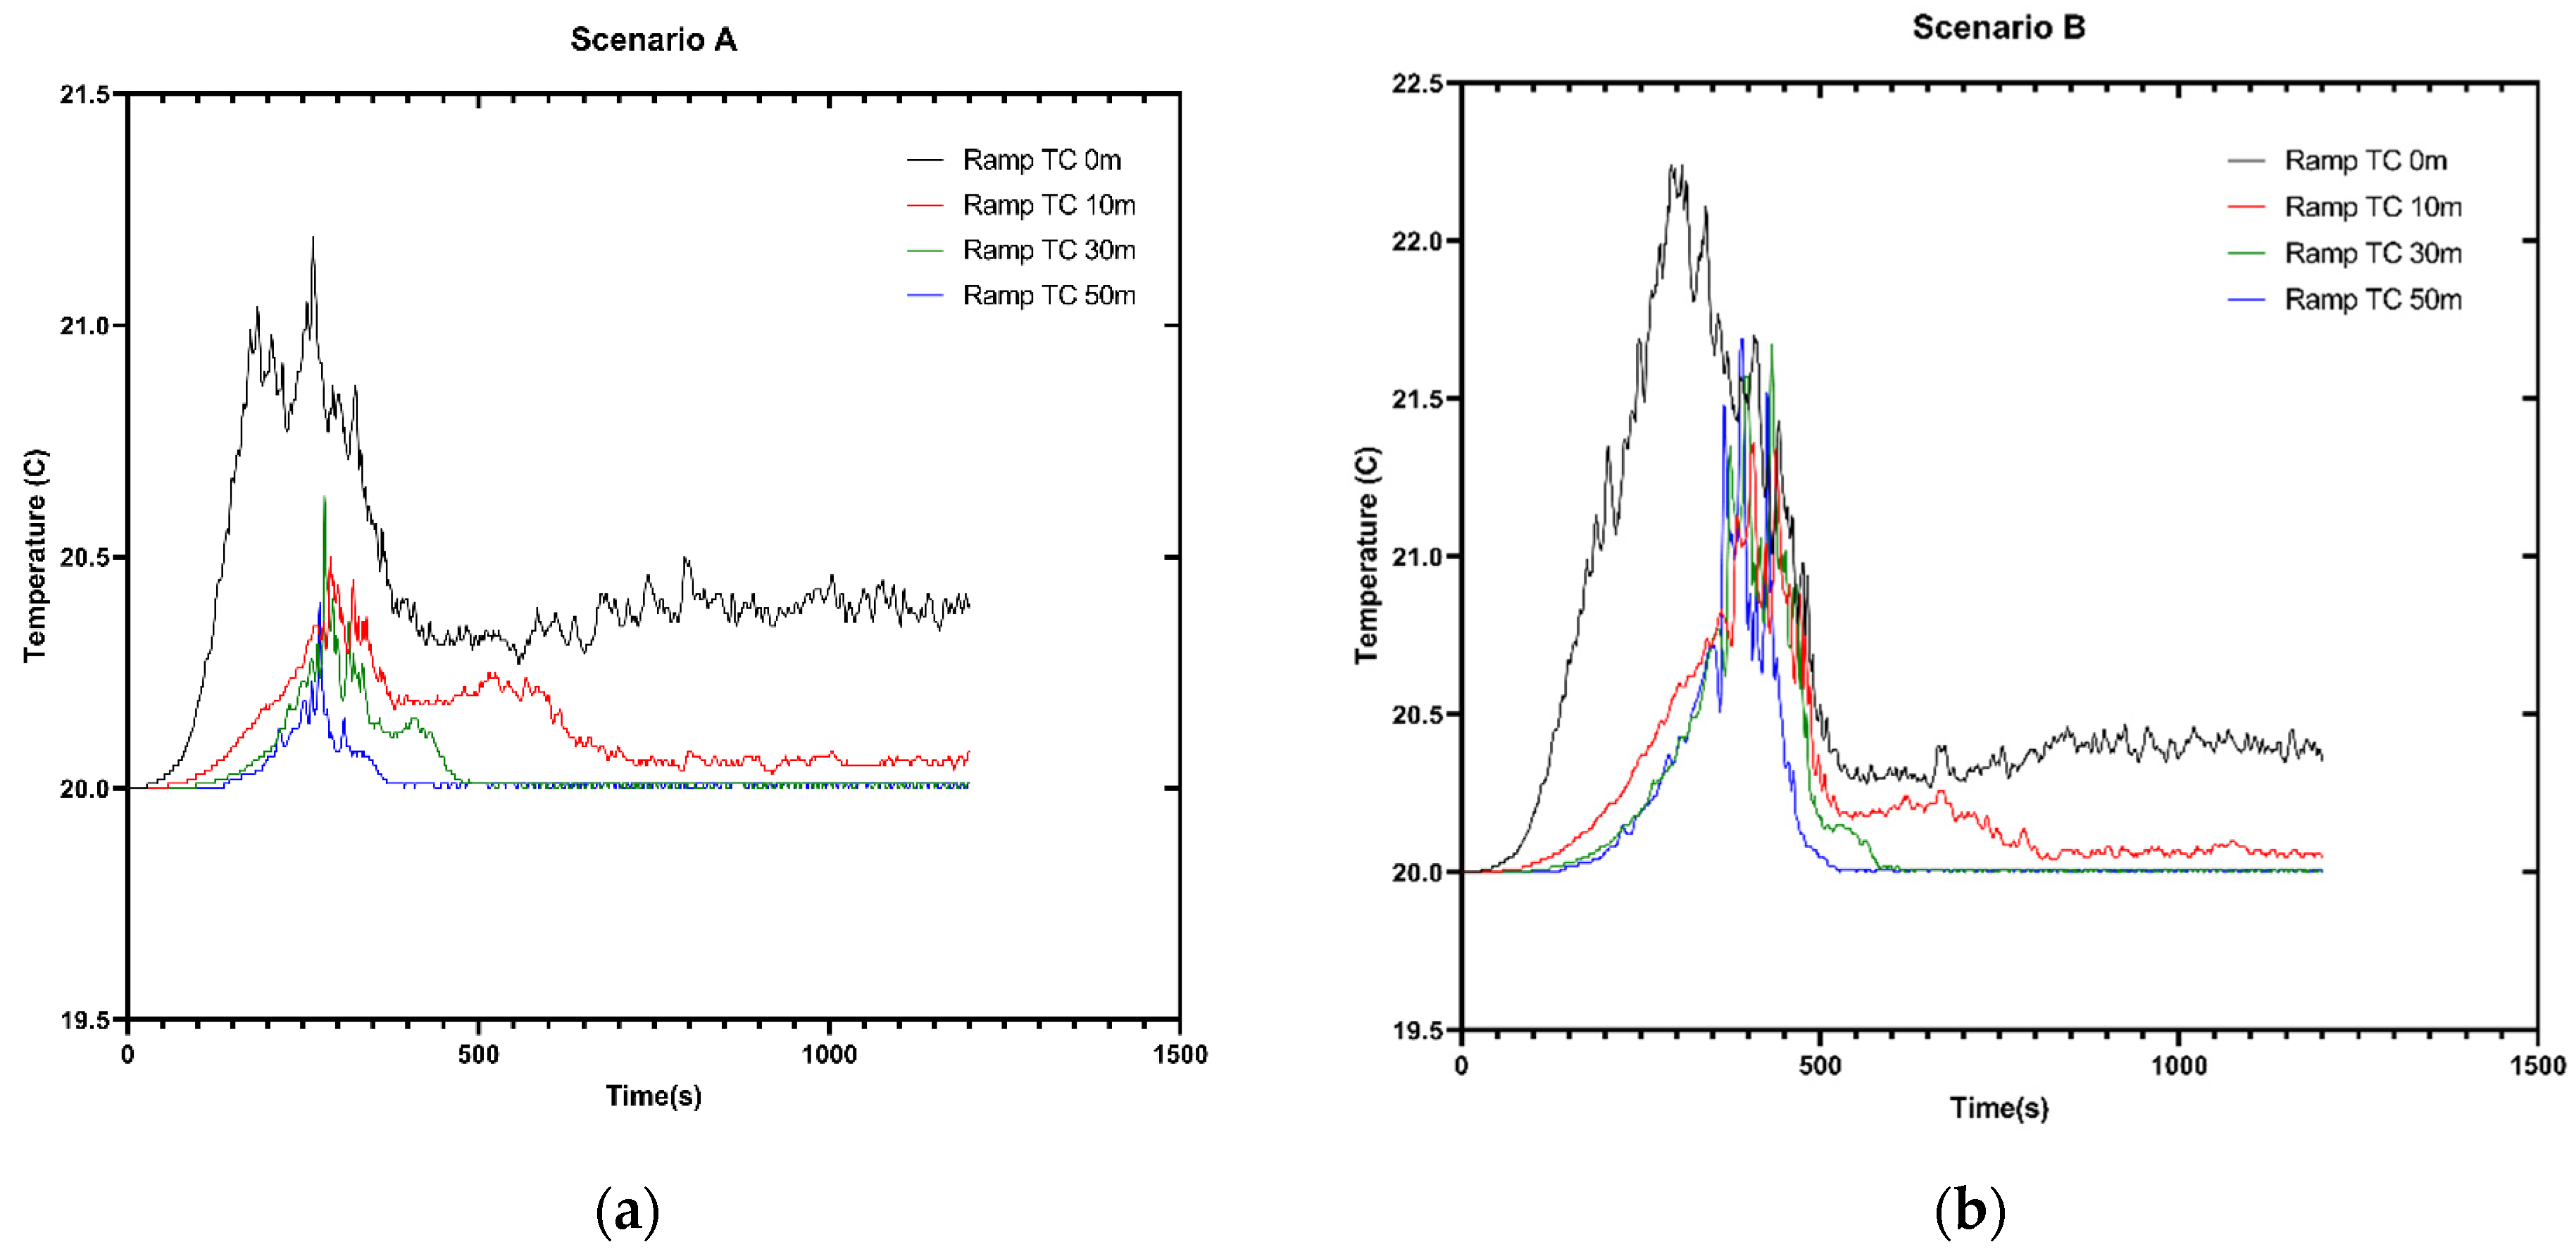
Increased air temperatures may make it difficult for the people to move. This increase affects the train evacuation process. The critical temperature in a confined space, such as a tunnel, is the temperature where a person’s movement and actions are impaired, and it is defined as 60 °C [43]. Figure 14 shows that, for every scenario, the temperature at the walking platform, at a height of 2 m, did not exceed 24 °C. In these conditions, the evacuation can be carried out normally.
The calculation of FED with Pathfinder used the equations described in the SFPE Handbook of Fire Protection Engineering, 5th Edition [44]. Only the concentrations of the narcotic gases CO, CO2, and O2 were used to calculate the FED value.
This calculation does not include the effect of hydrogen cyanide (HCN), and the effect of CO2 is only due to hyperventilation. Carbon dioxide does not have toxic effects at concentrations of up to 5%, but it stimulates breathing, which increases the rate at which the other fire products are taken up.
where is the concentration of carbon monoxide (ppm v/v 20 °C), is the volume of air breathed each minute (L/min), with its value being 25 L/min for an activity level of light work (walking to escape), is time in minutes, and is the exposure dose (% COHb), with its value being 30% for an activity level of light work.
Hyperventilation due to carbon dioxide can increase the rate at which fire products are taken up. The multiplication factor is given by the equation
where is the volume fraction of (v/v). The fraction of an incapacitating dose of low hypoxia is calculated as:
where is time in minutes, and is the oxygen volume fraction (v/v). The measurement location for FED quantity sampling is 90% of occupant height. For example, FED data for an occupant with height = 1.8 m would be sampled 1.62 m above the occupant’s location. When the occupant is not inside an FDS mesh, the FED calculation is paused until the occupant enters another mesh [31].
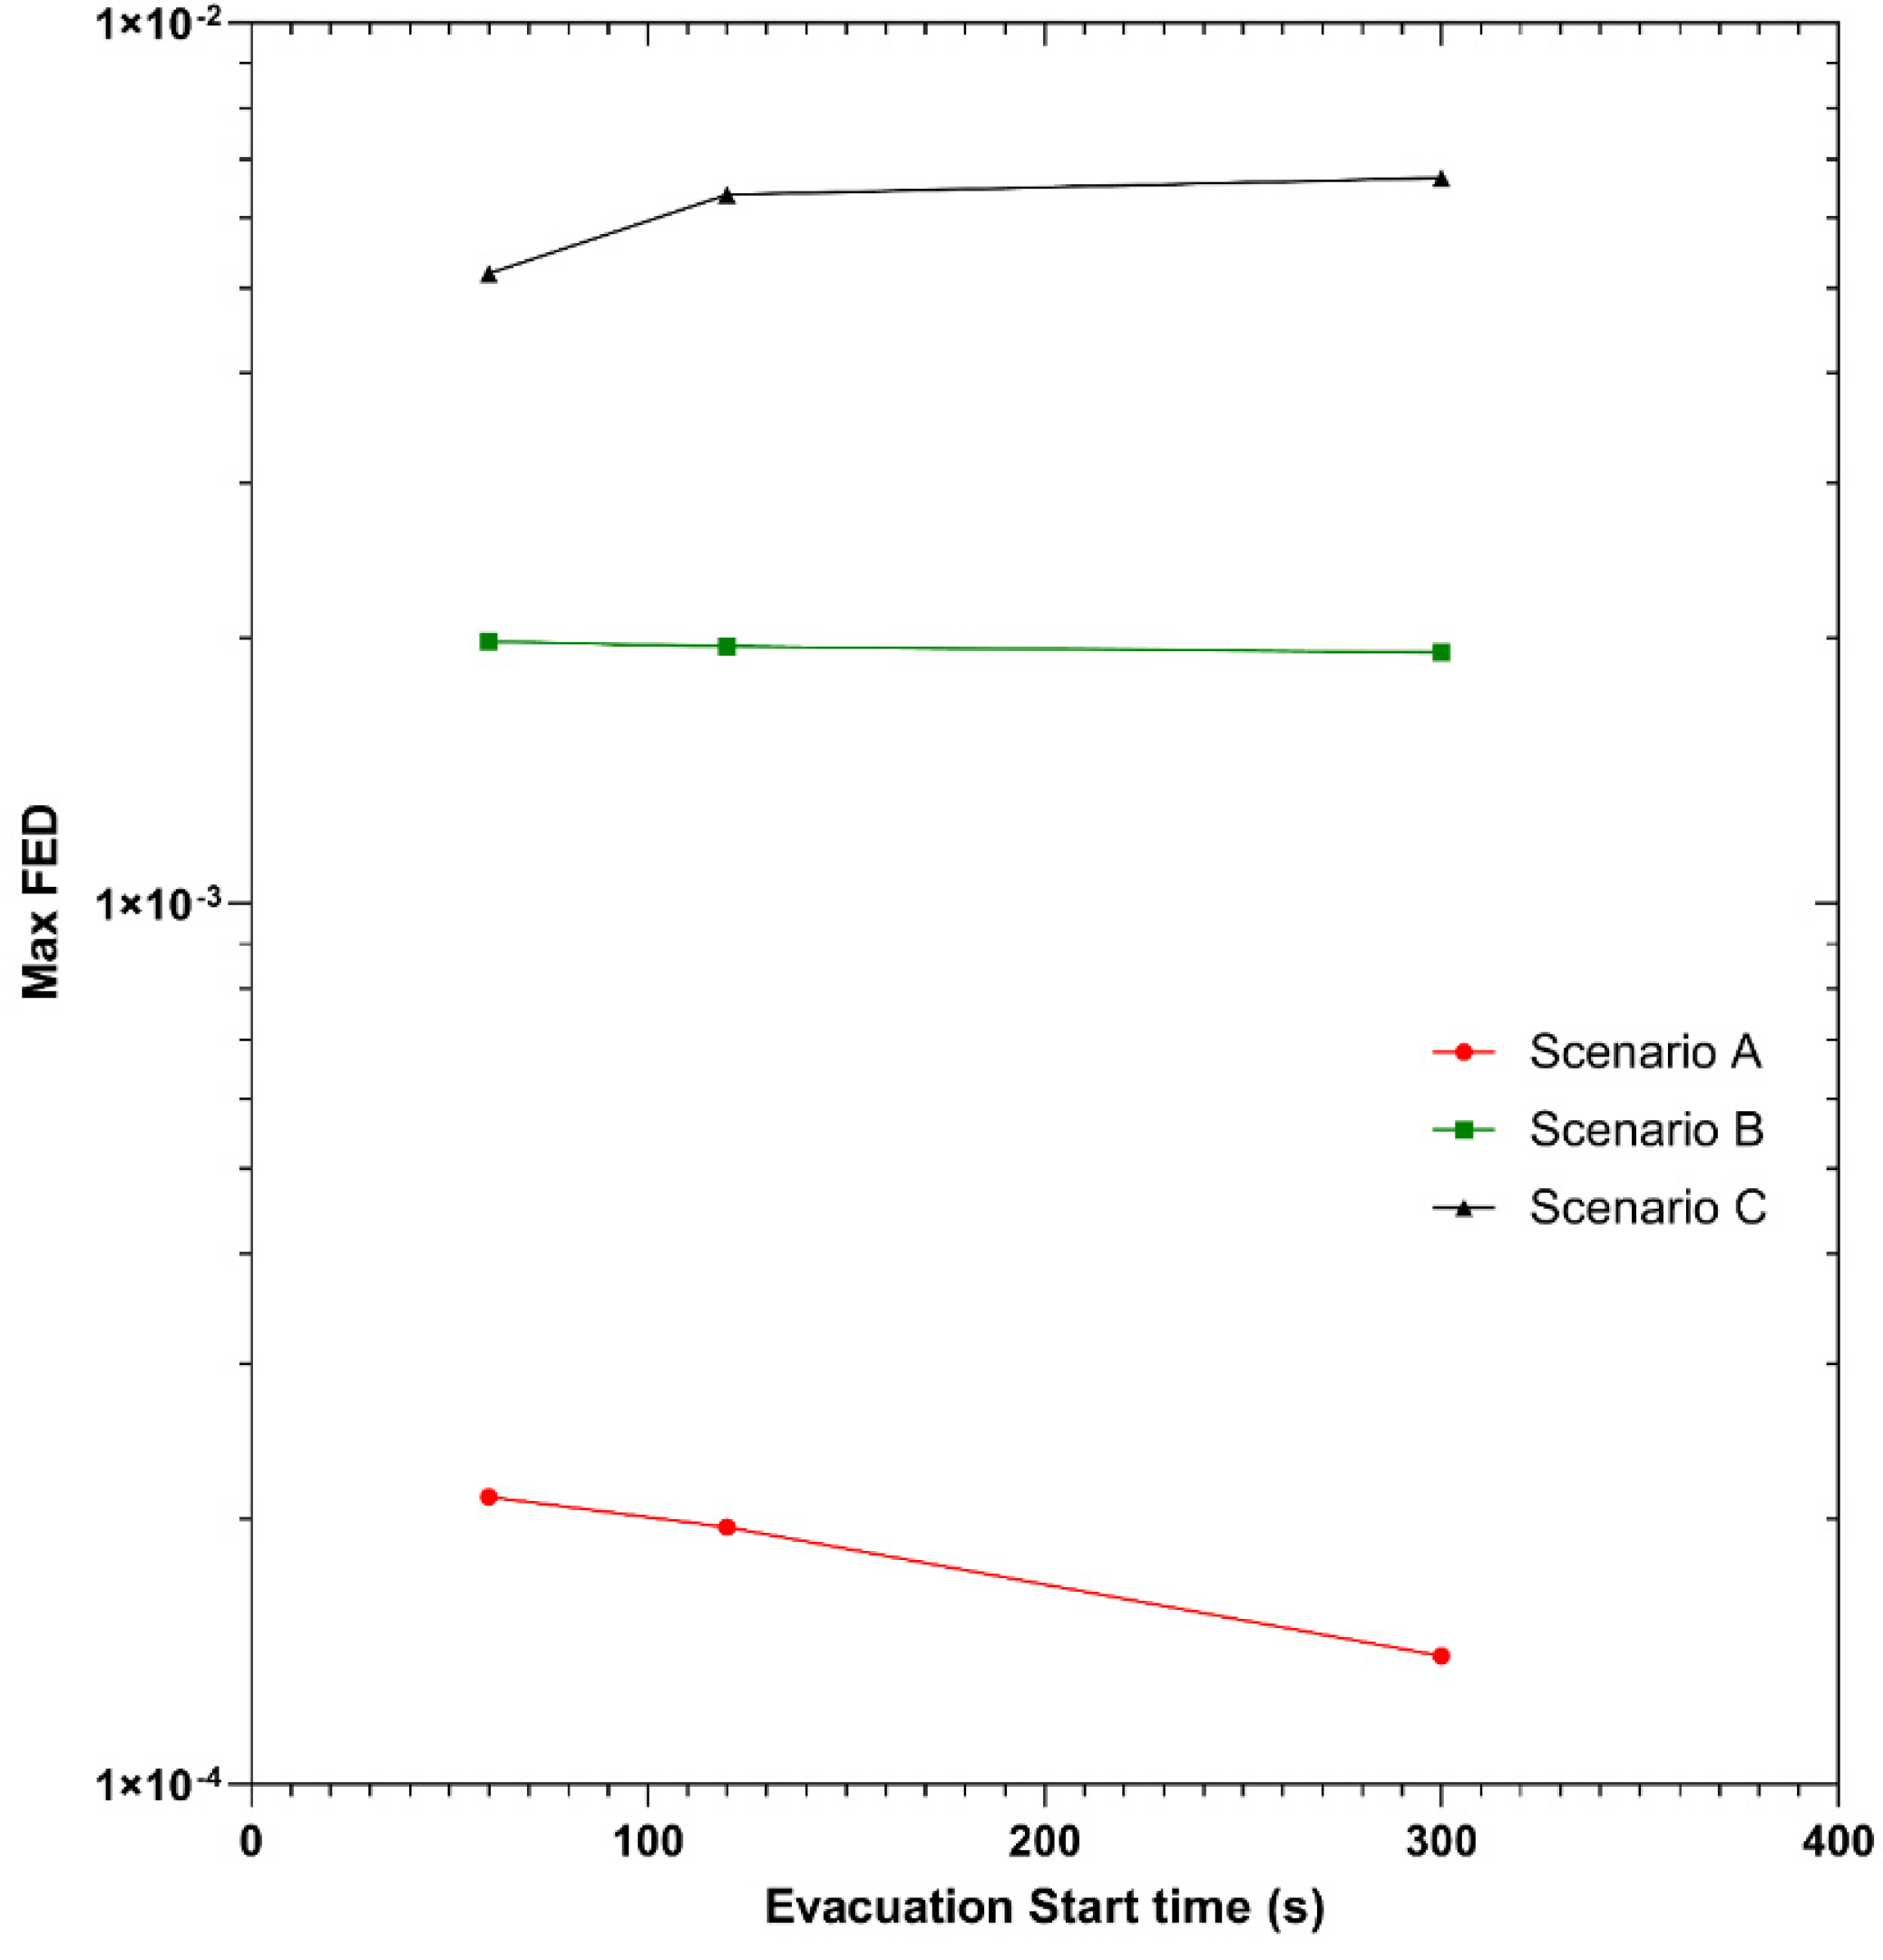
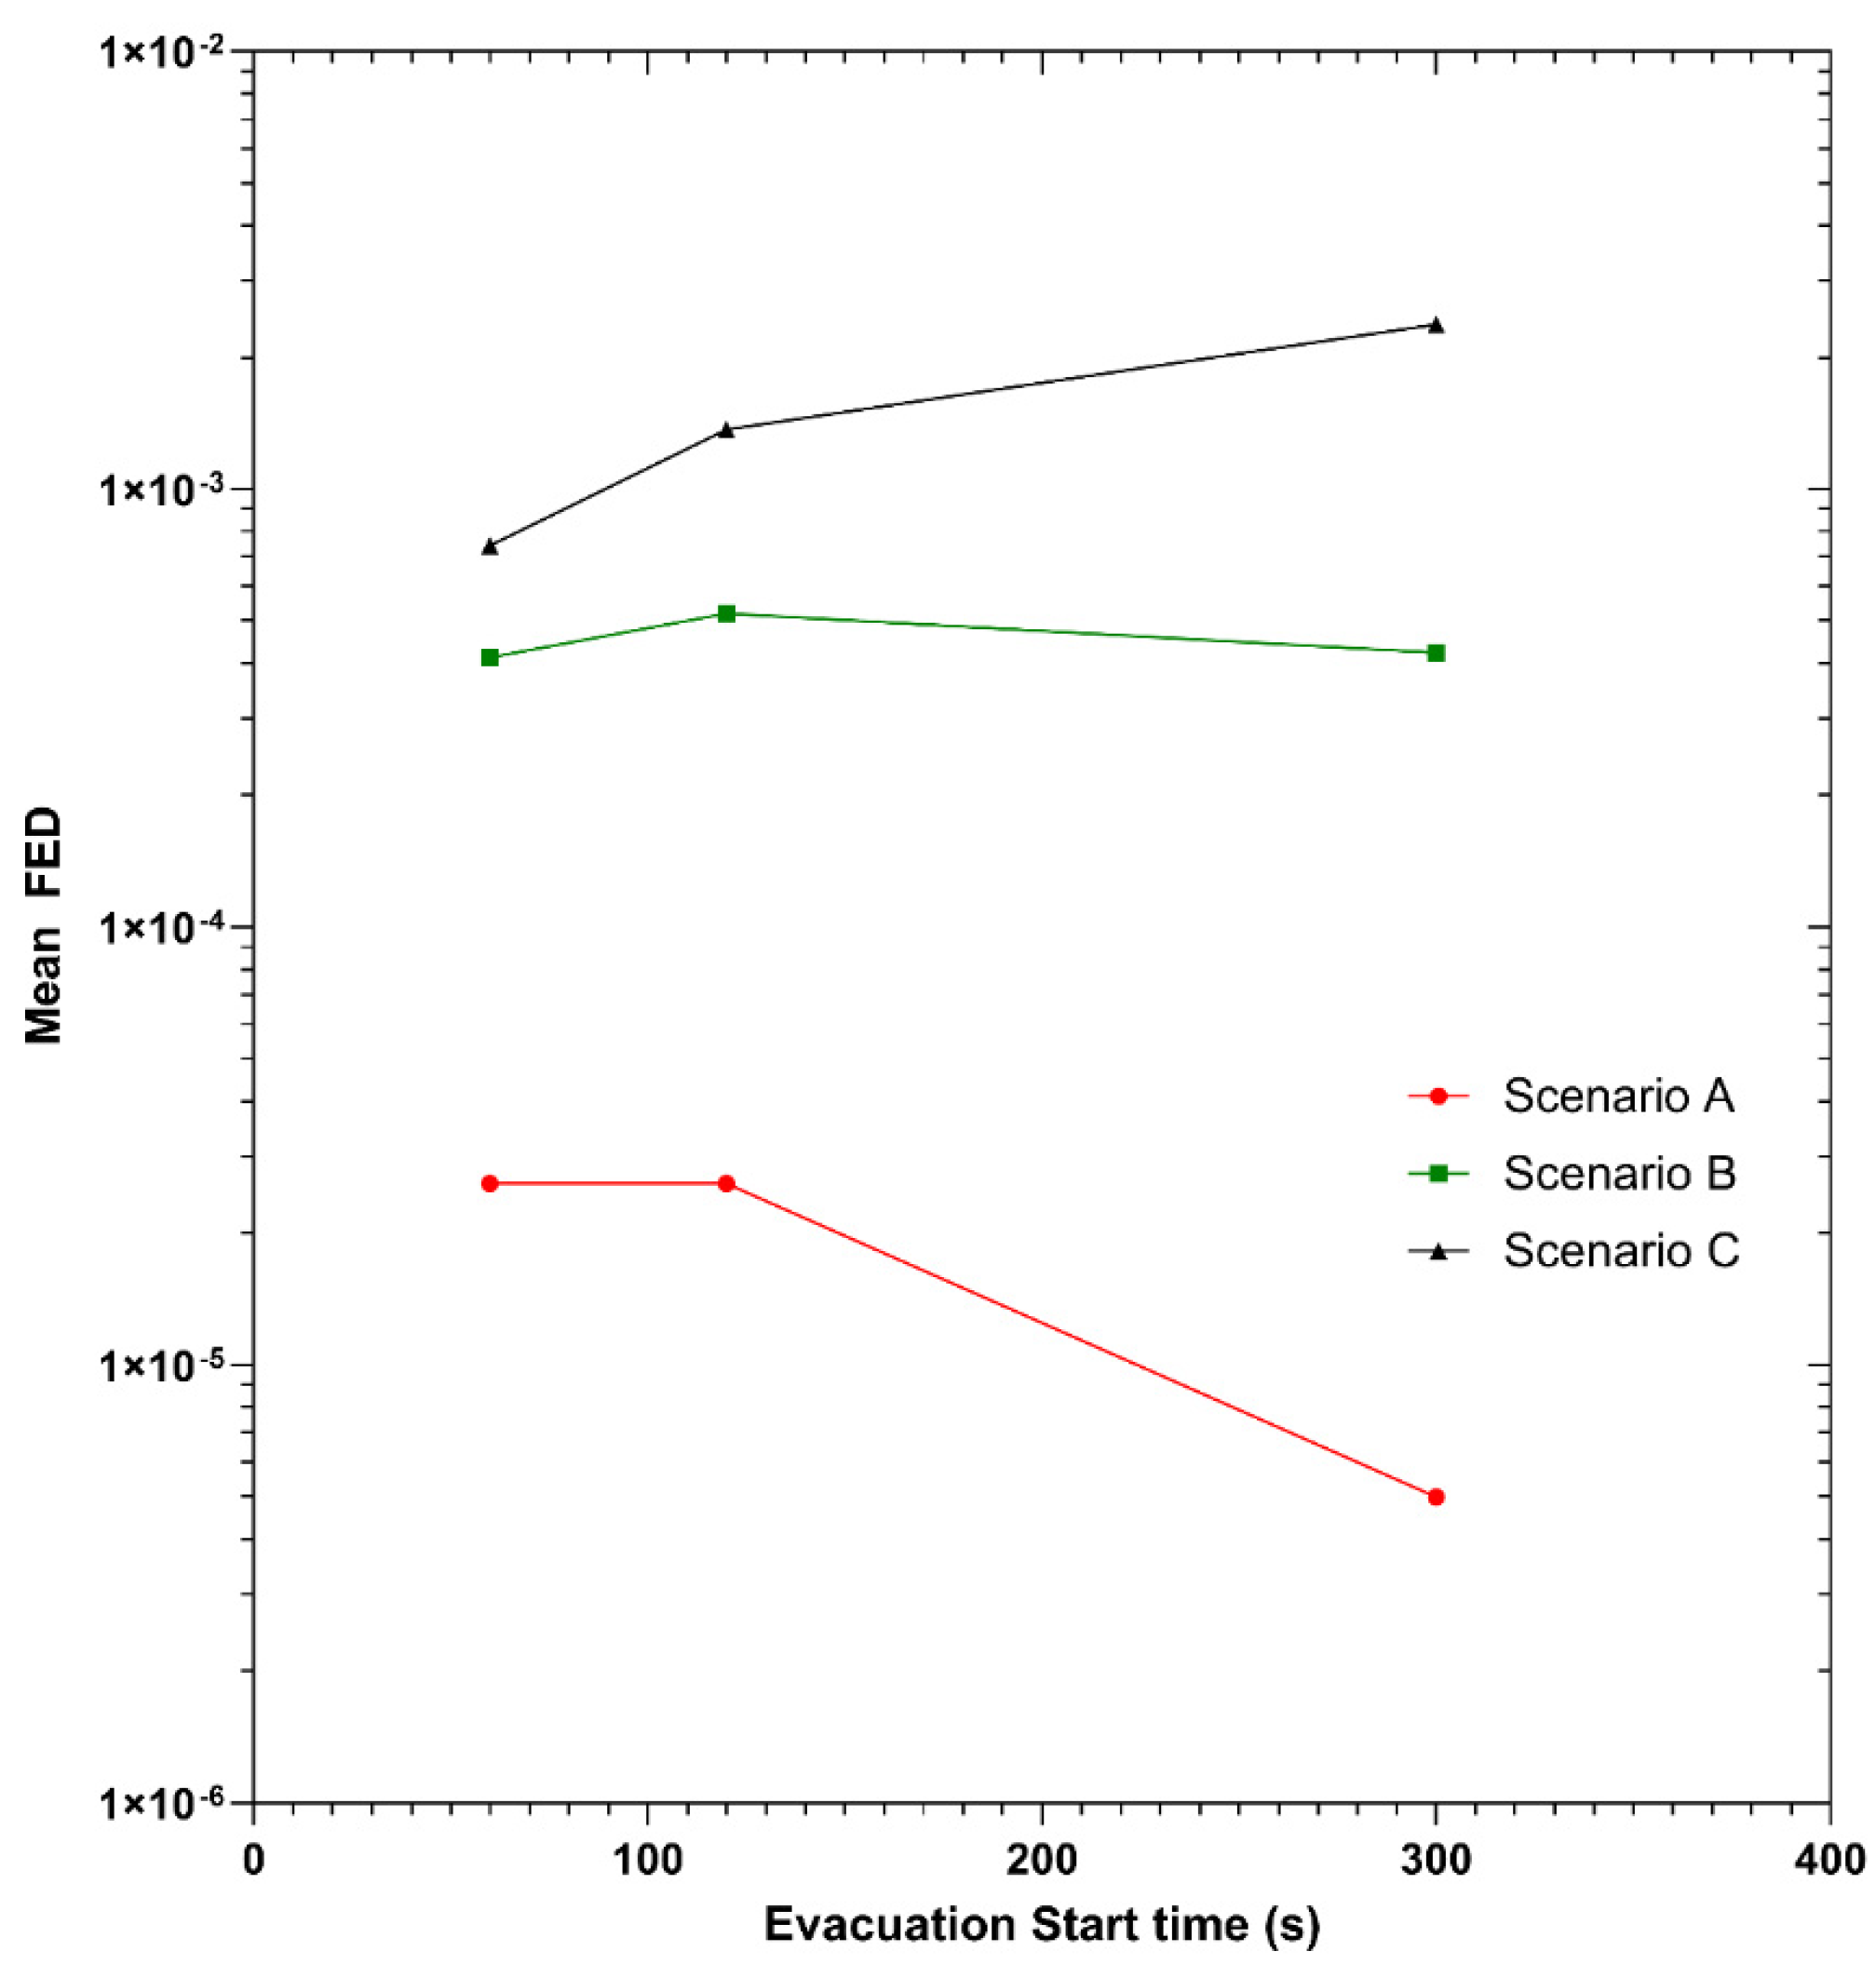
FED values never reached the critical value of 1, where a person is considered incapacitated, but some interesting results were extracted. The maximum values of FED are presented in Table 1 and compared in Figure 15. As shown, the longer the activation of the ventilation system was delayed, the more the uptake of combustion products and toxic gases increases. This is also shown in Table 2 and Figure 16, where the results for the mean fed values for each case are presented. It is important to be mentioned that, while maximum FED values for scenario A are about six times lower than the values for Scenario C, the mean FED values for Scenario A are an order of magnitude lower than Scenario C.
5. Discussion and Conclusions
Three different scenarios with different jet fan activation times, combined with three different evacuation scenarios, were studied. Firstly, validation of the temperature and critical velocity was conducted. The results showed a good agreement between the theoretical and simulation values, thereby the ventilation system was capable of providing sufficient air for smoke extraction.
The evacuation process showed that the passengers were not in danger, but important results regarding the importance of the jet fan activation time were extracted: From the FED values calculated for the nine cases in total, it was concluded that the most important action in a tunnel fire is the ventilation system activation time, after the start of a fire. If the ventilation system is delayed for any reason and the passengers have started evacuating the train, it is safer to wait for the population to travel some distance, possibly way past the train, and then the jet fans should be activated. If the ventilation system is activated in time, it seems safer to delay the initialization of the evacuation until the jet fans have reached their nominal output.
It is important to mention that there was no diversity in the population. Each simulated person had the same characteristics with each other as the movement speed and other factors that affect the evacuation process such as dimensions and comfort distance from each other. This affects results since, in real-life scenarios, the population is mixed (elderly people, people requiring assistance to move, people with baggage and families).
Author Contributions
Conceptualization, T.Z. and K.V.; methodology, T.Z., K.V. and I.S.; software, T.Z. and K.V.; validation, T.Z. and K.V.; formal analysis; T.Z.; resources, K.V. and I.S.; data curation, T.Z.; writing—original draft preparation, T.Z. and K.V.; writing—review and editing, K.V. and I.S.; visualization, T.Z.; supervision, K.V. All authors have read and agreed to the published version of the manuscript.
Funding
This research received no external funding.
Institutional Review Board Statement
Not applicable.
Informed Consent Statement
Not applicable.
Data Availability Statement
The data used in this study are available upon request from the corresponding author. The data can be easily reproduced from the theoretical analysis described in the study.
Acknowledgments
This work was supported by computational time granted from the National Infrastructures for Research and Technology S.A. (GRNET S.A.) in the National HPC facility—ARIS—under project ID pr011045-UrbanFirePlan2. The authors acknowledge and express particular appreciation to Thunderhead Engineering for providing licenses for Pyrosim and Pathfinder software, which was used for the designing, simulation scenarios and visualization of the results.
Conflicts of Interest
The authors declare no conflict of interest.
References
- Ronchi, E. Evacuation Modelling in Road Tunnel Fires. Ph.D. Thesis, Polytechnic University of Bari, Bari, Italy, 2012. [Google Scholar]
- Amundsen, F.H. Studies of driver behaviour in Norwegian road tunnels. Tunn. Undergr. Space Technol. 1994, 9, 9–15. [Google Scholar] [CrossRef]
- Amundsen, F.H.; Ranes, G. Studies on traffic accidents in Norwegian road tunnels. Tunn. Undergr. Space Technol. 2000, 15, 3–11. [Google Scholar] [CrossRef]
- Vasilopoulos, K.; Lekakis, I.; Sarris, I.E.; Tsoutsanis, P. Large eddy simulation of dispersion of hazardous materials released from a fire accident around a cubical building. Environ. Sci. Pollut. Res. 2021, 28, 50363–50377. [Google Scholar] [CrossRef] [PubMed]
- Hong, W.-H. The progress and controlling situation of Daegu Subway fire disaster. Fire Saf. Sci. 2004, 6, s-5. [Google Scholar]
- Zhang, T.; Zhang, Y.; Zhu, H.; Yan, Z. Experimental investigation and multi-level modeling of the effective thermal conductivity of hybrid micro-fiber reinforced cementitious composites at elevated temperatures. Compos. Struct. 2021, 256, 112988. [Google Scholar] [CrossRef]
- Yan, Z.; Zhang, Y.; Guo, Q.; Zhu, H.; Shen, Y.; Guo, Q. Numerical study on the smoke control using point extraction strategy in a large cross-section tunnel in fire. Tunn. Undergr. Space Technol. 2018, 82, 455–467. [Google Scholar] [CrossRef]
- Zhang, T.; Zhang, Y.; Xiao, Z.; Yang, Z.; Zhu, H.; Ju, J.W.; Yan, Z. Development of a novel bio-inspired cement-based composite material to improve the fire resistance of engineering structures. Constr. Build. Mater. 2019, 225, 99–111. [Google Scholar] [CrossRef]
- Zhang, Y.; Zhu, H.; Guo, Q.; Carvel, R.; Yan, Z. The effect of technical installations on evacuation performance in urban road tunnel fires. Tunn. Undergr. Space Technol. 2021, 107, 103608. [Google Scholar] [CrossRef]
- Buntelius, A.G.; Brickel, J.O.; Kuesel, T.R.; King, E.W. Tunnel Engineering Handbook; Chapman & Hall: Chapel Hill, NC, USA, 1996. [Google Scholar]
- Zhang, Y.; Shen, Y.; Carvel, R.; Zhu, H.; Zhang, Y.; Yan, Z. Experimental investigation on the evacuation performance of pedestrians in a three-lane urban tunnel with natural ventilation in a fire scenario. Tunn. Undergr. Space Technol. 2021, 108, 103634. [Google Scholar] [CrossRef]
- Purser, D. Assessment of Hazards to Occupants from Smoke, Toxic Gases, and Heat. In SFPE Handbook of Fire Protection Engineering; Springer: New York, NY, USA, 2008; pp. 2–96. [Google Scholar]
- NFPA 502; Standard for Road Tunnels, Bridges and Other Limited Access Highways. NFPA: Quincy, MA, USA, 2011.
- Carlson, E.-S.; Kumm, M.; Zakirov, A.; Dederichs, A. Evacuation tests with elevated platforms in railway tunnels. Fire Saf. J. 2019, 108, 102840. [Google Scholar] [CrossRef]
- Ingason, H.; Kumm, M.; Nilsson, D.; Lönnermark, A.; Claesson, A.; Li, Y.Z.; Fridolf, K.; Åkerstedt, R.; Nyman, H.; Dittmer, T. The METRO Project-Final Report; Mälardalen University Press: Vasteras, Sweden, 2012. [Google Scholar]
- Barbato, L.; Cascetta, F.; Musto, M.; Rotondo, G. Fire safety investigation for road tunnel ventilation systems—An overview. Tunn. Undergr. Space Technol. 2014, 43, 253–265. [Google Scholar] [CrossRef]
- Brandt, R.; Haerter, H. On the Four Elements of Tunnel Safety: Fire, Air, Water and Earth. In Proceedings of the 7th International Conference Tunnel Safety and Ventilation, Graz, Austria, 12–13 May 2014; pp. 12–13. [Google Scholar]
- Klote, J.H.; Ferreira, M.J.; Kashef, A.; Turnbull, P.G.; Milke, J.A. Handbook of Smoke Control Engineering; American Society of Heating Refrigerating and Air-Conditioning Engineers: Peachtree Corners, GA, USA, 2012. [Google Scholar]
- Haukur, I.; Li, Y.Z.; Lönnermark, A. Tunnel Fire Dynamics; Springer: New York, NY, USA, 2015. [Google Scholar]
- Gehandler, J. Road tunnel fire safety and risk: A review. Fire Sci. Rev. 2015, 2, 2–4. [Google Scholar] [CrossRef] [Green Version]
- Carvel, R.; Beard, A. The Handbook of Tunnel Fire Safety; Thomas Telford: London, UK, 2005; 514p. [Google Scholar]
- Hu, L.H.; Huo, R.; Chow, W.K. Studies on buoyancy-driven back-layering flow in tunnel fires. Exp. Therm. Fluid Sci. 2008, 32, 1468–1483. [Google Scholar] [CrossRef]
- Oka, Y.; Atkinson, G.T. Control of smoke flow in tunnel fires. Fire Saf. J. 1995, 25, 305–322. [Google Scholar] [CrossRef]
- Li, Y.Z.; Lei, B.; Ingason, H. Study of critical velocity and backlayering length in longitudinally ventilated tunnel fires. Fire Saf. J. 2010, 45, 361–370. [Google Scholar] [CrossRef]
- Riess, I.; Bettelini, M. The Prediction of Smoke Propagation Due to Tunnel Fires. In Proceedings of the ITC Conference Tunnel Fires and Escape from Tunnels, Lyon, France, 5–7 May 1999; p. 999. [Google Scholar]
- Wu, Y.; Bakar, M.Z.A. Control of smoke flow in tunnel fires using longitudinal ventilation systems—A study of the critical velocity. Fire Saf. J. 2000, 35, 363–390. [Google Scholar] [CrossRef]
- Lee, S.R.; Ryou, H.S. An Experimental Study of the Effect of the Aspect Ratio on the Critical Velocity in Longitudinal Ventilation Tunnel Fires. J. Fire Sci. 2005, 23, 119–138. [Google Scholar] [CrossRef]
- Lee, Y.-P.; Tsai, K.-C. Effect of vehicular blockage on critical ventilation velocity and tunnel fire behavior in longitudinally ventilated tunnels. Fire Saf. J. 2012, 53, 35–42. [Google Scholar] [CrossRef]
- Gannouni, S.; Ben Maad, R. Numerical analysis of smoke dispersion against the wind in a tunnel fire. J. Wind Eng. Ind. Aerodyn. 2016, 158, 61–68. [Google Scholar] [CrossRef]
- Tanaka, F.; Takezawa, K.; Hashimoto, Y.; Moinuddin, K.A.M. Critical velocity and backlayering distance in tunnel fires with longitudinal ventilation taking thermal properties of wall materials into consideration. Tunn. Undergr. Space Technol. 2018, 75, 36–42. [Google Scholar] [CrossRef]
- McGrattan, K.; Hostikka, S.; McDermott, R.; Floyd, J.; Vanella, M. Fire Dynamics Simulator User’s Guide; NIST Special Publication: Gaithersburg, MD, USA, 2019. [Google Scholar]
- McGrattan, K.; Hostikka, S.; Floyd, J.; McDermott, R.; Vanella, M. Fire Dynamics Simulator User's Guide; NIST Special Publication: Gaithersburg, MD, USA, 2013. [Google Scholar]
- U.S.NRC; EPRI. Verification and Validation of Selected Fire Models for Nuclear Power Plant Applications: Fire Dynamics Simulator (FDS); U.S.NRC: Palo Alto, CA, USA, 2007. [Google Scholar]
- Versteeg, H.K.; Malalasekera, W. An Introduction to Computational Fluid Dynamics: The Finite Volume Method; Pearson Education: New York, NY, USA, 2007. [Google Scholar]
- Liu, C.; Zhong, M.; Tian, X.; Zhang, P.; Li, S. Study on emergency ventilation for train fire environment in metro interchange tunnel. Build. Environ. 2019, 147, 267–283. [Google Scholar] [CrossRef]
- Król, A.; Król, M. Numerical investigation on fire accident and evacuation in a urban tunnel for different traffic conditions. Tunn. Undergr. Space Technol. 2021, 109, 103751. [Google Scholar] [CrossRef]
- Cheng, C.H.; Chow, C.L.; Chow, W.K. A simulation study of tenability for passengers in a railway tunnel with arson fire. Tunn. Undergr. Space Technol. 2021, 108, 103679. [Google Scholar] [CrossRef]
- Kurioka, H.; Oka, Y.; Satoh, H.; Sugawa, O. Fire properties in near field of square fire source with longitudinal ventilation in tunnels. Fire Saf. J. 2003, 38, 319–340. [Google Scholar] [CrossRef]
- Hu, L.H.; Huo, R.; Peng, W.; Chow, W.K.; Yang, R.X. On the maximum smoke temperature under the ceiling in tunnel fires. Tunn. Undergr. Space Technol. 2006, 21, 650–655. [Google Scholar] [CrossRef]
- Li, Y.; Lei, B.; Ingason, H. The maximum temperature of buoyancy-driven smoke flow beneath the ceiling in tunnel fires. Fire Saf. J. 2011, 46, 204–210. [Google Scholar] [CrossRef]
- Li, Y.Z.; Ingason, H. The maximum ceiling gas temperature in a large tunnel fire. Fire Saf. J. 2012, 48, 38–48. [Google Scholar] [CrossRef]
- Rosignuolo, F.; Souza, R.; Knaust, C.; Andreini, M. A Comparison Between Empirical Models and FDS Simulation to Predict the Ceiling Gas Temperature Distribution In a Tunnel Fire. In Proceedings of the World Tunnel Congress 2017—Surface Challenges—Underground Solutions, Bergen, Norway, 9–15 June 2017. [Google Scholar]
- Shan-jun, M.O.; Li, Z.-R.; Liang, D.; Li, J.-X.; Zhou, N.-J. Analysis of Smoke Hazard in Train Compartment Fire Accidents Base on FDS. Procedia Eng. 2013, 52, 284–289. [Google Scholar] [CrossRef] [Green Version]
- Hurley, M.J.; Gottuk, D.; Hall, J.R.; Harada, K.; Kuligowski, E.; Puchovsky, M.; Torero, J.; Watts, J.M.; Wieczorek, C. SFPE Handbook of Fire Protection Engineering, 5th ed.; Springer: New York, NY, USA, 2016; pp. 1–3493. [Google Scholar]
Figure 1.
Side view of the simulation tunnel, tunnel dimensions, jet fans, train, and fire source location.
Figure 1.
Side view of the simulation tunnel, tunnel dimensions, jet fans, train, and fire source location.

Figure 2.
(a) Comparison of the grid convergence index (GCI) for the U mean velocity and (b) mean carbon monoxide concentration for the medium and fine mesh in the symmetry plane of the tunnel, with coordinates (x = 1100 m, y = 5.5 m, and z = from 0 to 7 m) and 28 sampling points.
Figure 2.
(a) Comparison of the grid convergence index (GCI) for the U mean velocity and (b) mean carbon monoxide concentration for the medium and fine mesh in the symmetry plane of the tunnel, with coordinates (x = 1100 m, y = 5.5 m, and z = from 0 to 7 m) and 28 sampling points.

Figure 3.
Grid meshes and fire source. The medium grid of 0.5 m was used for the majority of the tunnel, while the fine mesh of 0.25 was used near the field of the fire.
Figure 3.
Grid meshes and fire source. The medium grid of 0.5 m was used for the majority of the tunnel, while the fine mesh of 0.25 was used near the field of the fire.

Figure 4.
Temperatures at the tunnel ceiling (z = 7 m) above (x = 0 m) and downwind the fire source (x = 10, 30, 50 and 100 m) for Scenario C, calculated using the empirical model and the actual temperatures from the FDS output.
Figure 4.
Temperatures at the tunnel ceiling (z = 7 m) above (x = 0 m) and downwind the fire source (x = 10, 30, 50 and 100 m) for Scenario C, calculated using the empirical model and the actual temperatures from the FDS output.

Figure 5.
Tunnel ceiling temperature (z = 7 m) above the fire source (x = 795 m), and comparison of the FDS output for Scenario C and the HC, HCM, and RABT ZTV standard fire curves.
Figure 5.
Tunnel ceiling temperature (z = 7 m) above the fire source (x = 795 m), and comparison of the FDS output for Scenario C and the HC, HCM, and RABT ZTV standard fire curves.

Figure 6.
FDS input fire curve and FDS results fire curve.

Figure 7.
Tunnel ceiling (z = 7 m) gas temperature above (x = 0 m) and downwind (x = 10, 30, 50, and 100 m) from the fire source (a) for Scenario A, (b) Scenario B, and (c) Scenario C.
Figure 7.
Tunnel ceiling (z = 7 m) gas temperature above (x = 0 m) and downwind (x = 10, 30, 50, and 100 m) from the fire source (a) for Scenario A, (b) Scenario B, and (c) Scenario C.


Figure 8.
Tunnel ceiling (z = 7 m) temperatures for each scenario at the jet fan activation time frame: (a) Scenario A at +180 s, (b) Scenario B at +300 s, and (c) Scenario C at +480 s after the fire accident.
Figure 8.
Tunnel ceiling (z = 7 m) temperatures for each scenario at the jet fan activation time frame: (a) Scenario A at +180 s, (b) Scenario B at +300 s, and (c) Scenario C at +480 s after the fire accident.

Figure 9.
Smoke dispersion along the tunnel and backlayering at the jet fan activation time frame for (a) Scenario A at +180 s, (b) Scenario B at +300 s, and (c) Scenario C at +480 s.
Figure 9.
Smoke dispersion along the tunnel and backlayering at the jet fan activation time frame for (a) Scenario A at +180 s, (b) Scenario B at +300 s, and (c) Scenario C at +480 s.

Figure 10.
FDS ceiling temperatures above the fire source (x = 795 m, z = 7 m) for all three scenarios in comparison with the RABT ZTV fire curve.
Figure 10.
FDS ceiling temperatures above the fire source (x = 795 m, z = 7 m) for all three scenarios in comparison with the RABT ZTV fire curve.

Figure 11.
Development of the critical ventilation velocity of 2.7 m/s (isosurface with the green colour), at the train location, for (a) +90 s, (b) +180 s, and (c) +300 s after the activation of the jet fans. The jet fans reached their maximum output 90 s after their activation, while the development of the flow was reached approximately after 300 s.

Figure 12.
Lengthwise U velocity at symmetry plane y = 5.5 m and z = 3.5 m for Scenario A at different time frames (t = +180 s, +270 s, +600 s, and +720 s).
Figure 12.
Lengthwise U velocity at symmetry plane y = 5.5 m and z = 3.5 m for Scenario A at different time frames (t = +180 s, +270 s, +600 s, and +720 s).

Figure 13.
Lengthwise mean U velocity for Scenario A, upwind from the fire source.

Figure 14.
Temperature distribution upwind from the fire source at y = 0.5 m (middle of the walking platform) and at a height of 2 m for (a) Scenario A, (b) Scenario B, and (c) Scenario C. Temperatures do not exceed 24 °C.
Figure 14.
Temperature distribution upwind from the fire source at y = 0.5 m (middle of the walking platform) and at a height of 2 m for (a) Scenario A, (b) Scenario B, and (c) Scenario C. Temperatures do not exceed 24 °C.


Figure 15.
Max FED index for the three different scenarios and evacuation times.

Figure 16.
Mean FED index for the three different scenarios and evacuation times.


Table 1.
Max FED index for the three different scenarios and evacuation times.
| Max FED | |||
|---|---|---|---|
| Evacuation Start Time (s) | Scenario A | Scenario B | Scenario C |
| 60 | 2.12 × 10⁻⁴ | 1.98 × 10⁻³ | 5.20 × 10⁻³ |
| 120 | 1.96 × 10⁻⁴ | 1.96 × 10⁻³ | 6.38 × 10⁻³ |
| 300 | 1.40 × 10⁻⁴ | 1.93 × 10⁻³ | 6.67 × 10⁻³ |
Table 2.
Mean FED index for the three different scenarios and evacuation times.
| Mean FED | |||
|---|---|---|---|
| Evacuation Start Time (s) | Scenario A | Scenario B | Scenario C |
| 60 | 2.60 × 10⁻⁵ | 4.14 × 10⁻⁴ | 7.43 × 10⁻⁴ |
| 120 | 2.60 × 10⁻⁵ | 5.21 × 10⁻⁴ | 1.37 × 10⁻³ |
| 300 | 5.00 × 10⁻⁶ | 4.23 × 10⁻⁴ | 2.38 × 10⁻³ |
Publisher’s Note: MDPI stays neutral with regard to jurisdictional claims in published maps and institutional affiliations. |
© 2022 by the authors. Licensee MDPI, Basel, Switzerland. This article is an open access article distributed under the terms and conditions of the Creative Commons Attribution (CC BY) license (https://creativecommons.org/licenses/by/4.0/).
Share and Cite
MDPI and ACS Style
Zisis, T.; Vasilopoulos, K.; Sarris, I. Numerical Simulation of a Fire Accident in a Longitudinally Ventilated Railway Tunnel and Tenability Analysis. Appl. Sci. 2022, 12, 5667. https://doi.org/10.3390/app12115667
AMA Style
Zisis T, Vasilopoulos K, Sarris I. Numerical Simulation of a Fire Accident in a Longitudinally Ventilated Railway Tunnel and Tenability Analysis. Applied Sciences. 2022; 12(11):5667. https://doi.org/10.3390/app12115667
Chicago/Turabian StyleZisis, Thomas, Konstantinos Vasilopoulos, and Ioannis Sarris. 2022. "Numerical Simulation of a Fire Accident in a Longitudinally Ventilated Railway Tunnel and Tenability Analysis" Applied Sciences 12, no. 11: 5667. https://doi.org/10.3390/app12115667
Note that from the first issue of 2016, this journal uses article numbers instead of page numbers. See further details here.