A Comparative Study of the CMT+P Process on 316L Stainless Steel Additive Manufacturing

1
School of Mechanical and Automotive Engineering, South China University of Technology, Guangzhou 510641, China
2
Guangdong Welding Technology Research Institute (Guangdong China Uzbekistan Research Institute), Guangzhou 510650, China
*
Author to whom correspondence should be addressed.
Appl. Sci. 2020, 10(9), 3284; https://doi.org/10.3390/app10093284
Submission received: 26 February 2020
/
Revised: 17 April 2020
/
Accepted: 30 April 2020
/
Published: 8 May 2020
(This article belongs to the Special Issue Additive Manufacturing in Industry)
Abstract
:Adopting the cold metal transfer plus pulse (CMT + P) process, 316L stainless steel wire was treated with a single channel multi-layer deposition experiment under different linear energy. The microstructures of different regions on the deposited samples were observed by optical microscope and scanning electron microscope, and the element distribution in the structure was analyzed by energy dispersive spectrometer. The mechanical properties and microhardness were measured by tensile test method and microhardness tester, respectively, and the anisotropy of tensile strength in horizontal and vertical directions were calculated. Finally, the fracture morphology of the tensile samples were observed by SEM. Experiment results showed that when the difference between the actual and the optimal wire feeding speed matching the specific welding speed was too large, this led to an unstable deposition process as well as flow and collapse of weld bead metal, thus seriously deteriorating the appearance of the deposition samples. The results from metallographic micrograph showed that rapid heat dissipation of the substrate caused small grains to generate in the bottom region of deposition samples, then gradually grew up to coarse dendrites along the building direction in the middle and top region caused by the continuous heat accumulation during deposition. Tensile test results showed that with the increase of linear energy, the horizontal and vertical tensile strength of the as-deposited samples decreased. In addition, the higher linear energy would deteriorate the microstructure of as-deposited parts, including significantly increasing the tendency of oxidation and material stripping. The microhardness values of the bottom, middle and top regions of the samples fluctuated along the centerline of the cross-section, and the values showed a trend of decreasing first and then rising along the building direction. Meanwhile, the yield strength and tensile strength of each specimen showed obvious anisotropy due to unique grain growth morphology. On the whole, the results from this study prove that CMT+P process is a feasible MIG welding additive manufacturing method for 316L stainless steel.
1. Introduction
Additive manufacturing (AM) is a new technology for manufacturing components by continuously depositing material on the substrate. This method is considered as an alternative, cost-effective method for the production of traditional metal components, and can save delivery time and costs [1]. In recent years, many scholars have devoted themselves to researching additive manufacturing technologies including selective laser sintering (SLS) [2,3], selective laser melting (SLM) [4,5,6,7], electron beam melting (EBM) [8], wire arc additive manufacturing (WAAM) [9], etc. Among them, WAAM has the advantages over traditional parts manufacturing methods in that it can reduce the waste of raw materials, has better performance, low cost, high molding efficiency [10], and is easy for commercial production. In past decades, WAAM has become an important research hotspot all over the world [11].
Shassere et al. [12] used a molten electrode gas shielded welding method to deposit C-Mn steel upright walls with the mechanical properties similar to welds. Han et al. [13] proved that the gas metal arc welding (GMAW) process could deposit AZ91D alloy walls with a higher corrosion resistance than the AZ91D castings. Li et al. [14] used the WAAM to deposit Al-7Si-0.6Mg alloy with well-formed upright walls in which almost no obvious anisotropy was observed. Cong et al. [15] adopted the melt inert-gas welding (MIG) process to deposit Al-6.3% Cu alloy thin-walled and bulk parts in which pore content could be controlled effectively. Martina et al. [16] used inert gas welding process to deposit the vertical wall of martensitic stainless steel 17-4PH without obvious defect, and the deposition rate reached 9.5 kg/h.
GMAW additive technology can achieve low-cost, high-efficiency manufacturing and repairing of large components [17], however, unsuitable process parameters will result in serious heat accumulation, which will deteriorate the molding accuracy and performance [18]. The above research was mainly based on the traditional pulse current to study the influence of various process parameters such as current, voltage, scanning speed and inter layer cooling time on the surface dimensional stability and microstructure of the as-deposited parts, which made it difficult to accurately control the heat input, realize the smooth transition of the droplet, and finally obtain the workpiece with good dimensional accuracy.
The cold metal transfer plus pulse (CMT+P) process is a combination of pulse welding process and traditional CMT welding process (that is, in a welding cycle, several pulse welding droplet transitions follow some traditional CMT welding droplet transitions, and then the cycle is repeated). Most studies have shown that, CMT+P has obvious advantages over double pulse current, in terms of improvement of fusion zone width, grain size and liquefying crack [19,20,21]. Meanwhile, with the help of reverse wire drawing, the droplet smoothly transits into the molten pool depending on surface tension, thus ensuring the stability of deposition process and improvement of the heat input during the welding process.
To sum up, CMT+P has many advantages over other processes, but most of the current research focuses on the comparative study of the weld structure formed by this process and other processes under specific welding current conditions. However, there are few reports on the research of stainless steel additive manufacturing by unifying the process parameters as a single factor of linear energy. 316L stainless steel has the advantages of good formability, moderate price, easy access, high strength, good corrosion resistance, etc., which makes it widely used in industrial fields [22]. In this paper, the CMT P process was used to carry out the experiments of single channel multilayer continuous deposition of 316L stainless steel wire, compared to the thin deposited wall study by CMT+P process reported in reference [15], we adopted more research samples and more abundant characterization methods to study the effect of the linear energy on the morphology, microstructure, microhardness and tensile mechanical properties of parts, the aim of this paper was to find the optimal linear energy suitable for arc-welding deposition wall by CMT+P through the comparative study of different parameters, which provided a reference for the application of this technology in additive manufacturing.
2. Materials and Equipment
The chemical elements of 1.2 mm diameter 316L stainless steel wire and base plate are shown in Table 1 and a sheet of 250 mm long, 100 mm wide and 5 mm thick were selected in this study. Before the experiment, the substrates were polished and cleaned with acetone. The arc-welding depositional additive manufacturing system used in the experiment was shown in Figure 1. The system was constructed by the model of TransPuls Synergic 5000 CMT R welding machine, VR 7000 CMT wire feeder of Fronius company in Austria, KUKA six axis robot and robot control cabinet of KUKA System Co., Ltd.
3. Experimental Methods
The welding parameters of the welding machine in this experiment was built-in unitary adjustment, therefore, other parameters of the welding process can be adjusted only by adjusting the welding current. The welding voltage and wire feeding speed can automatically match the selected current value to ensure the smooth progress of the deposition process. The linear energy formula of CMT+P technology MIG welding of steel material was as follows:
where represents the line energy during welding (kJ/cm), represents the welding voltage (V), represents the welding current (A), represents the scanning speed (m/s), represents the welding thermal efficiency, generally equal to 0.9 in MIG welding [23].
In each deposition experiment, the scanning speed of each selected current value in the first layer was set to 30 cm/min, so as to facilitate the full fusion of the deposited layer and the substrate, and the scanning speed of the rest layers was set to 60 cm/min. The shielding gas is 99.999% high-purity argon, and the gas flow rate was 20 L/min, and the system could adjust the arc length automatically. A reciprocating stacking method was adopted for deposition of 30 layers. After each layer of bead with a length of 160 mm was finished, the welding torch was raised by 2.0 mm and then the next layer was scanned until the deposition was completed, however, after the first layer welding was completed, the torch was raised by 2.3 mm. The experimental parameters selected are shown in Table 2.
After the deposition, in order to avoid the influence of the two ends of the sample on the characterization performance, a width of about 15 mm at both ends was cut. The effective upright wall with a width of about 130 mm in the middle of the sample was the material property characterization area. The sampling location and the size of the tensile sample were shown in Figure 2.
The greasy dirt on the surface of each metallographic sample was eliminated using acetone. Firstly, the metallographic sandpaper of #160, #360, #600, #800 were used for rough grinding, and then the # 1500, # 2000, # 3000 sandpaper were used for fine grinding. Followed by polishing diamond polishing agent with particle size of 2.5 μm. After that, aqua regia (HCl: HNO3 = 3:1) was used as the metallurgical sample corrosive agent to corrode each sample for 20 s, and finally they were rinsed and dried with water and alcohol. The microstructure of each metallographic sample was observed with optical metallographic microscope.
Micro-Vickers hardness tester HMV-2T was used to test 20 points respectively on the bottom (1–5 layers), middle (13–17 layers) and top (26–30 layers) in the cross-section of the four as-deposited wall, in order to ensure the consistency of experimental tests, the locus of all test points were along the center lines of cross sections, because microstructures changed along the horizontal direction of the cross section would affect the micro-hardness test results. The test load was 500 g, the load time was 15 s, and the test was conducted at intervals of 0.5 mm along the deposition direction.
The horizontal tensile samples were cut from the left half of each deposition sample and recorded as H1, H2, H3, and vertical tensile Samples named V1, V2, V3 were taken from the right. Among these, the initial cutting points of the H1, H3 tensile specimen were 3.5 mm from the substrate and top of the deposited wall, respectively, while the H2 tensile specimen was cut from middle of the deposited wall, in addition, V3, V2 and V1 tensile specimens were successively cut from 5 mm away from the right side wall, interval was 8 mm. The CMT5105 microcomputer-controlled electronic universal testing machine was used to perform tensile mechanical experiments at room temperature. The tensile rate is 2 mm/min. The tensile mechanical results were averaged, and nova nanosem 430 scanning electron microscope was used for morphological observation of the tensile fracture.
4. Results and Analysis
4.1. Macro-Morphology
The appearance of the sample after arc-welding deposition is shown in Figure 3a. Figure 3b showed the original shape of the middle part of the four deposition samples without surface cleaning and polishing. It can be seen that obvious metal flow and collapse are observed on the wall surface of sample #1. However, there are no obvious defects on the other three samples with good appearance. This may be mainly attributed to scanning speed adopted being faster than optimal speed matching the selected welding current during deposition of sample #1, resulting in extremely unstable weld beads formed at the first few deposited layers, which caused non-uniform heating and unstable droplet transition on these deposited layers. Thus, the stable arc-welding deposition requires a specific matching relation between welding speed and wire feeding speed at selected current.
Because of using the lowest wire feeding speed, which resulted in the smallest deposition volume of sample #1 as shown in Figure 3c. While, as the line energy gradually increase from 2.37 kJ/cm to 2.85 kJ/cm, the weld beads on the deposited surface gradually become indistinct on three other samples, and the height of them are close to 50 mm, higher than the sample depicted in reference [24], in which the deposition sample deposited using 50 layers of 316L stainless steel wire with diameter of 0.8 mm by laser cladding is about 60 mm, therefore, the deposition efficiency in this experiment is relatively higher than that in the reference.
Due to the rapid cooling effect of the substrate, the width of the first few layers close to the substrate in each sample are relatively small which is seen in Figure 3c in the bottom of the samples, with the increase of the deposited layer and heat accumulation, the heat dissipation and cooling of the molten pool became relatively slow, which caused the upper dimension to widen, this results are similar to that observed in reference [25].
4.2. Microstructure
Take sample #2 as an example, the metallographic microstructure of different areas of the as-deposited sample are shown in Figure 4. It can be seen from the figure that the deposition process of MIG welding layer by layer makes the microstructure of the formed parts show periodic layer distribution, and the adjacent deposition layers are metallurgical combined as shown in Figure 4b. The latter layer remelted the grains of the previous layer, which resulted in the epitaxial growth of grains at the fusion line between layers.
In the bottom region, the rapid heat dissipation effect of the substrate made the austenite grains in this region small and the overall growth direction of the grains perpendicular to the deposition direction, with obvious consistency as shown in Figure 4a, the growth morphology of grains observed is consistent with the results in reference [26]. However, austenite gradually formed coarse columnar crystals in the middle region as shown in Figure 4c, which was mainly due to the non-equilibrium solidification of the alloy with the rapid solidification during the deposition process, and because of the heat accumulation of the workpiece, the cooling speed of the droplet after the transition into the molten pool became slower, the dendrites had enough time to grow up and grow into the liquid phase to form columnar crystals.
With the increase of heat accumulation, the dendrite size became larger, the secondary dendrite arm began to appear in the upper part as shown in Figure 4e, and the dendrite arm spacing increased significantly. However, the growth of secondary dendrite length was limited by the primary coarse dendrites around it, which made it unable to grow to the side indefinitely. In general, austinite content was constantly varied along the building direction on cross-section. Originally, in the bottom region, a certain amount of primary ferrite formed in austinite matrix due to sub-rapid solidification during the deposition of the first few layers near the substrate, then primary ferrite continuously dissolved into austenite matrix accompanied by the growth process of austenite grains due to processive heat accumulation during arc-welding deposition process, which resulted in the increase of austenite phase content in the middle and top region of as-deposited wall.
In the side wall region depicted in Figure 4d, the strong heat dissipation effect of the surrounding air promoted the formation of fine equiaxed grains in the outermost layer of the workpiece, and the grains gradually formed coarse dendrites towards the center of the specimen until they met with the dendrites in the center of the specimen, thus inhibiting the growth.
On the whole, due to the continuous growth of grains caused by the continuous heat accumulation, the average grain size gradually increased from about 10.5 μm in the bottom region to about 25.3 μm in the middle region and then to about 43.5 μm in the upper region.
The metallographic micrograph of the middle region of each sample is shown in Figure 5, from which the austenite and ferrite structures can be observed. According to the ternary phase diagram of Fe-Cr-Ni, the normal temperature structure of 316L after equilibrium solidification is uniform and single austenite phase, whereas when the temperature gradient is large, the cooling speed is fast, and the heating process is repeated, which probably cause the formation of non-equilibrium phase easily in the structure [27]. During MIG deposition, due to the heat effect of the latter layer on the former layer, some ferrite dissolved in austenite, and the remaining ferrite became reticular and vermicular [28]. Meanwhile, as shown in the figure, the columnar grains in the middle of the four samples grew vertically upward along the building direction, which further indicated that the grain structure of 316L samples grew along the direction of the maximum temperature gradient.
When the linear energy was 2.0 and 2.62 kJ/cm, the main phase was γ – austenite, forming in the middle of the samples #1 and #2, and the formation of δ – ferrite, some of them are vermicular, at the austenite grain boundary as shown in Figure 5#1-c and #2-c, and metallographic observation position was shown in the Figure 4c. When the linear energy increased to 2.62 and 2.85 kJ/cm, vermicular ferrites almost disappeared, the austenite columnar crystals in Figure 5#3-c and #4-c were coarse, the secondary dendrite arm was almost invisible, the dendrite gradually changes into cellular crystal, and the content of δ ferrites was decreasing. The main reason may be that the higher the linear energy was, the larger the heat input was, which resulted in the grain growth, meanwhile, the middle part of the deposited sample was subjected to repeated heating and the heat dissipation condition was worse than other areas, which promoted the diffusion of solute atoms in the structure, and the primary and secondary dendrite arms of γ austenite grains were easy to coarsen and grow at high temperature. As is well-known, an adequate amount of ferrite present in the austenite matrix can reduce material brittleness, effectively prevent crack initiation thus properly improve mechanical property, meanwhile, grain coarsening caused by high heat input also obviously bring out negative influence on material mechanical property, so, in terms of microstructure, samples #1 and #2 are better than samples #3 and #4.
At the same time, Figure 5#1-c depicted that the growth state of grains in sample #1 was more disordered than that in other samples, and the growth process of grains in some regions was interrupted, which resulted in the overall grain size of sample #1 was smaller than that of the other three samples. The fact could be attributed to that during the sample #1 deposition process, grain solidification and growth along the temperature gradient direction were restrained and disturbed in the molten pool with unstable droplet transition, which made the flow field in the molten pool with unstable deposition more disordered than that with stable deposition, resulting in the formation of the special crystal growth morphology.
The SEM picture of the top region of sample #4 is shown in Figure 6a. In the figure, the microstructure is mainly composed of austenite. Only a small amount of ferrite was observed on the austenite grain boundary. This may be mainly due to the high temperature formed by the heat accumulation during the continuous arc-welding deposition process, which promoted the ferrite to dissolve into the growing austenite. This observation result is consistent with experimental phenomena in Figure 5. In addition, there are some small lumpy and broken particles marked with arrows and ellipses. Two of the particles were selected for element quantitative analysis by energy spectrum, the result was shown in Figure 6b.
The Figure 6b shows that there are a lot of oxygen elements in the two particles, with the percentages of 58.97% and 53.83%, respectively, which proved that although shielding gas was used, oxides could form in the deposited samples during the arc welding deposition process. This may be mainly due to the oxides formed at high temperature had not been cleaned in time between layers during the continuous deposition process. Meanwhile, gas protection region moved away with the movement of the welding gun, which further increased the degree of oxidation of the exposed molten pool under the action of high temperature. Cr and Mn also account for a large proportion in these particles, which was related to the oxidation products of the alloy elements at high temperature.
The micromorphology of four as-deposited samples obtained by SEM are displayed in Figure 7. The morphology was clean in which almost no obvious oxidation was observed, as shown in sample #1. However, with the linear energy increased to 2.37 kJ/cm, some oxide occurred and were distributed on the austenite matrix because of the higher temperature manufacturing environment caused by the higher linear energy, but only a small amount of oxides was observed in sample #2. With the linear energy further increased to 2.62 kJ/cm, larger size and larger quantities of oxides appeared, and a phenomenon of a certain degree of material stripping could be observed on the grain boundaries, as shown in sample #3, which would have adverse effects on the material mechanical properties, because their presence destroyed the continuity of the metal matrix, increasing the risk of brittle fracture of materials under tension. When the linear energy further came to 2.85 kJ/cm, the stripping of the material even evolved into a large amount of deeper and larger cracks, which would significantly decrease the tensile strength, this phenomenon was consistent with the subsequent tensile test results. Thus, the microstructure of samples #1 and #2 are better than that of samples #3 and #4, but, although sample #1 have a good micromorphology, bad macroscopic appearance requires a large amount of machining costs to remove it. Thus, all things considered, the linear energy of 2.62 kJ/cm was the most appropriate parameter for 316L stainless steel CMT+P-AM process.
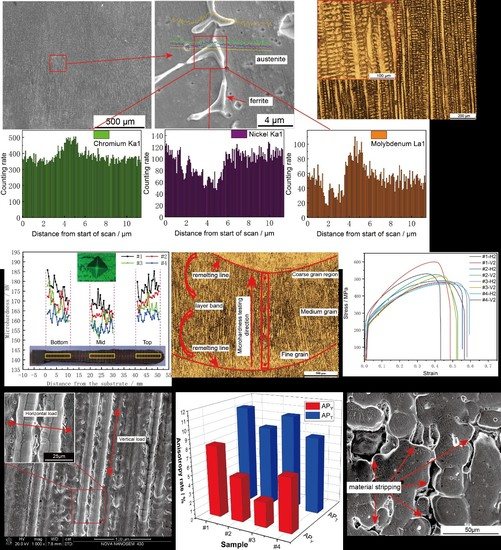
In the middle of sample #1, the SEM image was taken for observation and the energy spectrometer was used to analyze the specific region as shown in Figure 8. The EDS scanning result in the figure showed that when the scanning beam spot passes through ferrite, the counting rate of Cr and Mo increased significantly, while that of Ni decreased obviously. The similar element distribution on the phase-interface between ferrite and austenite was also observed in other three samples. These show that the content of Cr and Mo in ferrite is more than that in austenite, and the content of Ni is less than that in austenite. Cr and Mo probably promote the formation of ferrite, while Ni is the opposite.
4.3. Micro-Hardness
Figure 9 shows the microhardness values distribution of different parts of the four samples, and the hardness from the bottom (1–5 layers) to the middle (13–17 layers) shows a fluctuating downward trend. This may be due to the heterogeneous nucleation of the previous solidified layer on the later layer of alloy liquid during solidification and the flow field stirring caused by drop impact on the bottom of molten pool during the deposition process of MIG welding, which promoted the formation of fine dendrites near the fusion line. Taking the microstructure of sample #2 as the schematic diagram of microhardness test, as shown in Figure 10. The dendrite size increased gradually with the distance from the fusion line along the building direction. The microhardness value near the fusion line is higher than that in the coarse and medium grain area far away from the fusion line due to the effect of fine grain strengthening, which makes the values gradually decreasing in a deposited layer, and changing periodically in the cross-section.
At the beginning of the deposition of the alloy, the fine grain strengthening caused by the chilling effect of the substrate became the main contributor to the hardness improvement. As the deposition process continued, the grain size increased significantly in the middle area as shown in Figure 4, and the microhardness decreased gradually in this area. The austenite grains in the upper part of the deposited samples were coarse, combined with the solid solution strengthening effect caused by rapid solidification at the top of as-deposited wall, which made the hardness rise in the top area (26–30 layers). Meanwhile the heat accumulation caused by the continuous reciprocating deposition process also formed the age hardening of solid solution, which probably increased the hardness of the top area as shown in Figure 4 [29]. At the same time, when the deposition process was completed, the heat dissipation rate of the air at the top of the sample was faster, which probably led to a greater compressive stress. This may also be one of the reasons for the rebound of hardness in the upper region of the samples
It can be observed from the figure that during the change of the linear energy from 2.0 to 2.85 kJ /cm, the average microhardness of the four samples were 173.13, 167.52, 164.15, and 160.19 HV, respectively. The microhardness of the same area of the four as-deposited samples also decreased.
4.4. Tensile Strength
The strain-stress curves of the horizontal and vertical tensile specimens named H2 and V2 respectively of four as-deposited wall was shown in Figure 11. The tensile strength of vertical tensile specimen was significantly higher than the corresponding horizontal tensile specimen within every deposited wall, while the elongation was just the opposite. Among these, for example, the tensile strength of #1-V2 is 13.22% higher than that of #1-H2, and the value within the other three pairs of specimens (V2 and H2 tensile specimens of #2, #3, and #4) are 7.4%, 7.56%, and 3.22%, respectively. Therefore, the tensile strength of the as-deposited samples showed obvious anisotropy.
Meanwhile, as the welding current increased, the ultimate tensile strength values of both V2 and H2 tensile specimens of as-deposited wall represented a gradually declining trend, which could be attributed to the reason that the higher heat input introduced by higher welding current could obviously promote grains growth and sub-grains merging during metal deposition process, thus decreased the grain boundaries and dislocation density, resulting in the decline of ultimate tensile strength of each sample at the macro level. In addition, the ultimate strength of each specimen in the vertical direction is better than that in the horizontal direction, the elongation results show the opposite.
The average values of the horizontal and vertical yield strength (YSH and YSV), as well as the average values of the horizontal and vertical ultimate tensile strength (UTSH and UTSV) of each as-deposited sample are shown in Figure 12. When the linear energy decreased from 2.85 kJ/cm to 2.0 kJ/cm, the value of YSH went from 217 to 260, an increase of 20.0%, as well as the YSV, UTSH and UTSV, the increase rates of them were 22.6%, 13.8%, and 16.9%, respectively.
It can be seen that the changes of the four types of values show a clear correlation with those of line energy. This may be mainly due to the reduction of heat input during the deposition process, which resulted in grain refinement and thus improved the mechanical properties of the alloy. The results were consistent with the trend of microhardness in Figure 9.
In addition, the figure also shows that the yield strength and tensile strength of sample #1 were significantly higher than those of the other three samples. This may also be related to the disordered grain growth morphology and the large degree of grain boundary disorder in the #1 deposition sample, as shown in Figure 5. The tensile strength of polycrystalline alloy can be improved by smaller grain size and larger tortuosity of grains boundary [18]. While, the average values of the yield strength and the ultimate tensile strength of all four as-deposited samples satisfy the standard requirement for stainless steel forgings: 170 MPa for YS, and 450 MPa for UTS [30], respectively, as shown in the Figure 12, which indicates that in terms of mechanical properties, the single channel multilayer continuous deposition of wire arc-welding with CMT+P process can be used in additive manufacturing of 316L stainless steel.
The tensile strength values obtained in this study, except for the sample #4 (under the highest welding current condition), are much higher than those reported in reference [31] in which the 316L parts are produced by SLM with hot-isostatic pressed, containing the highest UTS of 528MPa. However, SLM process has much higher requirement than GMAW process on raw material quality for AM, meanwhile, the preparation process of alloy powder for SLM consumes much more time, which makes the cost of SLM process extremely high for AM. In addition to the mentioned above, deposition efficiency of SLM process are significantly lower than GMAW. For the above reasons, compared with SLM, the process used in this study has very obvious advantages and attraction for the manufacturing of parts with non-high dimensional accuracy requirements, and possesses excellent prospect in metal part AM.
The calculated anisotropy rate of the average value of yield and tensile strength of the four as-deposited samples are represented by APY and APT respectively [14], and the statistical diagram of the two types of data of each sample is shown in Figure 13. The results show that the anisotropy rate values of yield strength in horizontal and vertical specimens of samples #1~#4 are 8.09%, 5.0%, 2.85% and 6.80% respectively, and the corresponding values of ultimate tensile strength of samples #1~#4 are 11.10%, 9.05%, 10.69% and 8.62%, respectively. So, it can be seen that the anisotropy rate of ultimate tensile strength of CMT+P as-deposited samples is greater than that of yield strength. This may be due to the same mechanism of plastic deformation of polycrystalline metals in horizontal and vertical directions, while the tensile strength of MIG deposition samples in different directions has greater difference in bearing mechanism, which leads to the above experimental results [32].
The formation of anisotropy is mainly determined by the deposition direction, which makes coarse columnar crystals grow upwards, resulting in differences in mechanical properties in different tensile directions [33]. The SEM micrograph of the middle area of sample #4 shows that there are obvious intergranular cracks between the coarse columnar grains as shown in Figure 14, which are the weak link of the material under horizontal loading. The macro cracks are easy to generate and expand here, resulting in the strength of the horizontal tensile specimen is significantly lower than that of the vertical specimen. In horizontal direction, the deformation resistance is mainly provided by grain boundary, while in vertical direction, it mainly depends on columnar crystal growing in the same direction [34]. However, in the deposited samples, the grain boundary extended along the direction of construction with obvious uniformity, so the deformation resistance of the grain boundary decreased in the horizontal direction, which made the tensile strength of the samples represent obvious anisotropy in the horizontal and vertical directions.
4.5. Fracture Morphology
The micro morphology of the tensile fracture of the deposited samples is shown in Figure 15. A large number of equiaxed dimples were found on the fracture surfaces of all specimens. The dimples of the horizontal tensile specimens were shallower, on the contrary, those were deeper on the vertical tensile specimens, and obvious tearing edges were found around the dimples, indicating that the material broke after full plastic deformation and good plasticity of deposited specimens, and the vertical tensile specimens had better plasticity and ductility than the horizontal tensile specimens [35]. The main reason may be that the columnar crystals grew along the direction of construction during deposition, which made them the main carrier of the stress in the vertical direction, while the lateral boundary of the columnar crystals in horizontal direction opposite, which showed that the plastic deformation ability in the grain was better than that in the grain boundary. At the same time, it can also be observed that the orientation of dimples on the fracture surface of the vertical specimen were consistent, which fully showed that the tensile load on these specimens was mainly carried by the columnar crystals. It was also shown in the figure that there were traces of cleavage fracture in the horizontal tensile fracture of sample #1, which indicated mixed fracture mode of toughness and brittleness fracture in the sample. while no cleavage surface appeared in the other samples, which indicated that deposition of low line energy led to the formation of brittle phase and the decline of mechanical property. At the same time, it can be observed in the figure that with the increase the line energy, the number of the second phase spherical particles in the fracture surface decreased gradually. This may be due to the higher heat input, which made the solute atoms out of austenite grains during the growth process, reduced the saturation of solid solution, and thus reduced the precipitation during the aging process.
5. Conclusions
This study presented and evaluated a line energy method to carry out single channel multilayer continuous deposition of 316L stainless steel wire based on CMT+P process of GMAW. The morphology, microstructure, properties of arc-welding deposited samples, and the conclusions were drawn as follows:
- (1)
- The novelty of this study is that multiple welding parameters are integrated into the single parameter named linear energy which as the unique parameters related to heat input during arc-welding deposition process, through adjusting the linear energy parameter and carrying out the comparative experimental method to find the best linear energy for 316L stainless steel AM. The results show that linear energy of 2.37 kJ/cm is the best for CMT+P process.
- (2)
- Only when the wire feeding speed and welding speed were in a proper matching range during CMT+P arc-welding deposition additive manufacturing, could the deposited samples with good deposition wall appearance be guaranteed. The difference between the actual and the optimal wire feeding speed matching the specific welding speed was too large, which led to an unstable deposition process and caused the flow of weld bead metal and collapse, thus seriously deteriorated the appearance of the deposition samples, so in appearance, sample #1 was the worst in the four deposited samples.
- (3)
- Oxide and microstructure defects increased with the increase of linear energy, even the obvious and extremely wide cracks formed in sample #4 under the highest linear energy (2.85 kJ/cm), so it is necessary to avoid depositing parts at high linear energy by CMT+P process. Although sample #1 perform well in micromorphology, in terms of micromorphology and saving costs of machining, sample #2 are the best in the four as-deposited samples in this study, and the linear energy of 2.37 kJ/cm is the most appropriate parameter for 316L CMT+P-AM.
- (4)
- The micro-hardness fluctuated periodically due to the change of grain structure of the deposition layer, as well as decreased first and then increased in the bottom, middle and top regions of the deposited wall. The reason for this can be attributed to the fine-grain-strengthening caused by the rapid cooling effect of substrate result in high microhardness at the bottom of samples; however, successive heat accumulation made the values go down at the middle, and high dislocation density and solution strengthening effect due to rapid solidification caused the microhardness to rise again at the top. The average microhardness of four samples decrease with the increase of line energy.
- (5)
- With linear energy gradually increased, the tensile strength values in the horizontal and vertical direction showed a downward trend, and the average values of YS and UTS in the two direction of the four as-deposited samples all satisfied the industrial standard requirement for 316L forgings, and except for sample #4 (linear energy of 2.85 kJ/cm), the UTS of the other three samples are all higher than that of parts produced by SLM with hot-isostatic pressed, thus, in terms of cost savings and production efficiency, compared with SLM process, CMT+P is more suitable for manufacturing the parts with non-high dimensional accuracy requirements.
- (6)
- The bearing capacity of the austenite dendrite grew along the construction direction was stronger than that of the dendrite side boundary, which made the strength of the tensile samples in the vertical direction higher than that in the horizontal direction, and the mechanical properties of the deposited samples were obviously anisotropic. In addition, the higher linear energy reduced the saturation of solid solution to reduce the precipitated spherical particles, which caused the decrease of tensile strength of as-deposited samples.
- (7)
- The results of this experiment show that the excessive linear energy will have a negative effect on the mechanical properties of the as-deposited parts. Thus, future research should focus on how to improve the deposition efficiency by improving the deposition scanning trajectory such as a multi-channel, multi-layer manner rather than further increasing linear energy, which enables the production of large size parts without increasing the heat input.
Author Contributions
B.X. performed the research, analyzed the data, wrote the original manuscript. J.X. provided the conception and conducted project management. X.R. provided the resources. W.W. co-designed the experimental process. Z.L. reviewed and edited the manuscript. All authors have read and agreed to the published version of the manuscript.
Funding
This research was funded by the National Natural Science Foundation of China grant number [51875213]; 2016 special fund project for talent introduction of Guangdong Academy of Sciences grant number [2016-GDASRC-0106]; Natural Science Foundation of Fujian Province grant number [2018J01503]; Science and Technology Project of Longyan City grant number [2017ly68]; 2015 Dongguan city to introduce third batch of innovative scientific research team project grant number [2017360004004].
Conflicts of Interest
The authors declare no conflict of interest.
References
- Fayazfar, H.; Salarian, M.; Rogalsky, A.; Sarker, D.; Russo, P.; Paserin, V.; Toyserkani, E. A critical review of powder-based additive manufacturing of ferrous alloys: Process parameters, microstructure and mechanical properties. Mater. Des. 2018, 144, 98–128. [Google Scholar] [CrossRef]
- Campione, I.; Brugo, T.M.; Minak, G.; Tomić, J.J.; Bogojević, N.; Kostić, S.Ć. Investigation by Digital Image Correlation of Mixed Mode I and II Fracture Behavior of Metallic IASCB Specimens with Additive Manufactured Crack-Like Notch. Metals 2020, 10, 400. [Google Scholar] [CrossRef] [Green Version]
- Ronca, A.; Rollo, G.; Cerruti, P.; Fei, G.; Gan, X.; Buonocore, G.; Lavorgna, M.; Xia, H.; Silvestre, C.; Ambrosio, L. Selective Laser Sintering Fabricated Thermoplastic Polyurethane/Graphene Cellular Structures with Tailorable Properties and High Strain Sensitivity. Appl. Sci. 2019, 9, 864. [Google Scholar] [CrossRef] [Green Version]
- Wang, D.; Yu, C.; Zhou, X.; Ma, J.; Liu, W.; Shen, Z. Dense Pure Tungsten Fabricated by Selective Laser Melting. Appl. Sci. 2017, 7, 430. [Google Scholar] [CrossRef]
- Maconachie, T.; Leary, M.; Lozanovski, B.; Zhang, X.; Qian, M.; Faruque, O.; Brandt, M. SLM lattice structures: Properties, performance, applications and challenges. Mater. Des. 2019, 183, 108137. [Google Scholar] [CrossRef]
- Zhang, B.; Dembinski, L.; Coddet, C. The study of the laser parameters and environment variables effect on mechanical properties of high compact parts elaborated by selective laser melting 316L powder. Mater. Sci. Eng. A 2013, 584, 21–31. [Google Scholar] [CrossRef]
- Jeon, T.; Hwang, T.; Yun, H.; VanTyne, C.; Moon, Y. Control of Porosity in Parts Produced by a Direct Laser Melting Process. Appl. Sci. 2018, 8, 2573. [Google Scholar] [CrossRef] [Green Version]
- Wysocki, B.; Maj, P.; Sitek, R.; Buhagiar, J.; Kurzydłowski, K.; Święszkowski, W. Laser and Electron Beam Additive Manufacturing Methods of Fabricating Titanium Bone Implants. Appl. Sci. 2017, 7, 657. [Google Scholar] [CrossRef]
- Geng, H.; Li, J.; Xiong, J.; Lin, X.; Zhang, F. Geometric Limitation and Tensile Properties of Wire and Arc Additive Manufacturing 5A06 Aluminum Alloy Parts. J. Mater. Eng. Perform. 2017, 26, 621–629. [Google Scholar] [CrossRef] [Green Version]
- Cunningham, C.R.; Wikshåland, S.; Xu, F.; Kemakolam, N.; Shokrani, A.; Dhokia, V.; Newman, S.T. Cost Modelling and Sensitivity Analysis of Wire and Arc Additive Manufacturing. Procedia Manuf. 2017, 11, 650–657. [Google Scholar] [CrossRef]
- Wu, B.; Pan, Z.; Ding, D.; Cuiuri, D.; Li, H.; Xu, J.; Norrish, J. A review of the wire arc additive manufacturing of metals: Properties, defects and quality improvement. J. Manuf. Process. 2018, 35, 127–139. [Google Scholar] [CrossRef]
- Shassere, B.; Nycz, A.; Noakes, M.; Masuo, C.; Sridharan, N. Correlation of Microstructure and Mechanical Properties of Metal Big Area Additive Manufacturing. Appl. Sci. 2019, 9, 787. [Google Scholar] [CrossRef] [Green Version]
- Han, S.; Zielewski, M.; Martinez Holguin, D.; Michel Parra, M.; Kim, N. Optimization of AZ91D Process and Corrosion Resistance Using Wire Arc Additive Manufacturing. Appl. Sci. 2018, 8, 1306. [Google Scholar] [CrossRef] [Green Version]
- Li, C.; Gu, H.; Wang, W.; Wang, S.; Ren, L.; Wang, Z.; Ming, Z.; Zhai, Y. Effect of Heat Input on Formability, Microstructure, and Properties of Al–7Si–0.6Mg Alloys Deposited by CMT-WAAM Process. Appl. Sci. 2020, 10, 70. [Google Scholar] [CrossRef] [Green Version]
- Cong, B.; Qi, Z.; Qi, B.; Sun, H.; Zhao, G.; Ding, J. A Comparative Study of Additively Manufactured Thin Wall and Block Structure with Al-6.3%Cu Alloy Using Cold Metal Transfer Process. Appl. Sci. 2017, 7, 275. [Google Scholar] [CrossRef]
- Martina, F.; Ding, J.; Williams, S.; Caballero, A.; Pardal, G.; Quintino, L. Tandem metal inert gas process for high productivity wire arc additive manufacturing in stainless steel. Addit. Manuf. 2019, 25, 545–550. [Google Scholar] [CrossRef] [Green Version]
- Williams, S.W.; Martina, F.; Addison, A.C.; Ding, J.; Pardal, G.; Colegrove, P. Wire + Arc Additive Manufacturing. Mater. Sci. Tech. 2016, 32, 641–647. [Google Scholar] [CrossRef] [Green Version]
- Yang, D.; Wang, G.; Zhang, G. Thermal analysis for single-pass multi-layer GMAW based additive manufacturing using infrared thermography. J. Mater. Process. Tech. 2017, 244, 215–224. [Google Scholar] [CrossRef]
- Ren, S.; Liu, Q.; Mao, X.; Zhao, P. Comparative analysis of joint structure and properties of 6082-T6 aluminum alloy CMT + P welding and double pulse MIG welding. Light Alloy. Process. Technol. 2019, 47, 62–65. [Google Scholar]
- Feng, J.; Zhang, H.; He, P. The CMT short-circuiting metal transfer process and its use in thin aluminium sheets welding. Mater. Des. 2009, 30, 1850–1852. [Google Scholar] [CrossRef]
- Pang, J.; Hu, S.; Shen, J.; Wang, P.; Liang, Y. Arc characteristics and metal transfer behavior of CMT+P welding process. J. Mater. Process. Technol. 2016, 238, 212–217. [Google Scholar] [CrossRef]
- Qin, W.; Li, J.; Liu, Y.; Kang, J.; Zhu, L.; Shu, D.; Peng, P.; She, D.; Meng, D.; Li, Y. Effects of grain size on tensile property and fracture morphology of 316L stainless steel. Mater. Lett. 2019, 254, 116–119. [Google Scholar] [CrossRef]
- Lippold, J.C. Welding Metallurgy and Weldability; John Wiley & Sons Inc.: Hoboken, NJ, USA, 2015; Volume 97811182307012014. [Google Scholar]
- Xu, X.; Mi, G.; Luo, Y.; Jiang, P.; Shao, X.; Wang, C. Morphologies, microstructures, and mechanical properties of samples produced using laser metal deposition with 316 L stainless steel wire. Opt. Laser. Eng. 2017, 94, 1–11. [Google Scholar] [CrossRef]
- Yang, D.; He, C.; Zhang, G. Forming characteristics of thin-wall steel parts by double electrode GMAW based additive manufacturing. J. Mater. Process. Tech. 2016, 227, 153–160. [Google Scholar] [CrossRef]
- Gray, G.T.; Livescu, V.; Rigg, P.A.; Trujillo, C.P.; Cady, C.M.; Chen, S.R.; Carpenter, J.S.; Lienert, T.J.; Fensin, S.J. Structure/property (constitutive and spallation response) of additively manufactured 316L stainless steel. Acta Mater. 2017, 138, 140–149. [Google Scholar] [CrossRef]
- Feng, Y.; Zhan, B.; He, J.; Wang, K. The double-wire feed and plasma arc additive manufacturing process for deposition in Cr-Ni stainless steel. J. Mater. Process. Tech. 2018, 259, 206–215. [Google Scholar] [CrossRef]
- Guo, P.; Zou, B.; Huang, C.; Gao, H. Study on microstructure, mechanical properties and machinability of efficiently additive manufactured AISI 316L stainless steel by high-power direct laser deposition. J. Mater. Process. Tech. 2017, 240, 12–22. [Google Scholar] [CrossRef]
- Xu, X.; Ganguly, S.; Ding, J.; Guo, S.; Williams, S.; Martina, F. Microstructural evolution and mechanical properties of maraging steel produced by wire + arc additive manufacture process. Mater. Charact. 2018, 143, 152–162. [Google Scholar] [CrossRef]
- Standard Specification for Stainless Steel Forgings; 100 Barr Harbor Drive; ASTM: West Conshohocken, PA, USA, 2015.
- Roettger, A.; Geenen, K.; Windmann, M.; Binner, F.; Theisen, W. Comparison of microstructure and mechanical properties of 316 L austenitic steel processed by selective laser melting with hot-isostatic pressed and cast material. Mater. Sci. Eng. A 2016, 678, 365–376. [Google Scholar] [CrossRef]
- Wang, Y.; Huang, H.; Xie, J. Texture evolution and flow stress of columnar-grained polycrystalline copper during intense plastic deformation process at room temperature. Mater. Sci. Eng. A 2011, 530, 418–425. [Google Scholar] [CrossRef]
- Simonelli, M.; Tse, Y.Y.; Tuck, C. Effect of the build orientation on the mechanical properties and fracture modes of SLM Ti–6Al–4V. Mater. Sci. Eng. A 2014, 616, 1–11. [Google Scholar] [CrossRef] [Green Version]
- Carroll, B.E.; Palmer, T.A.; Beese, A.M. Anisotropic tensile behavior of Ti–6Al–4V components fabricated with directed energy deposition additive manufacturing. Acta Mater. 2015, 87, 309–320. [Google Scholar] [CrossRef]
- Li, Z.; Liu, C.; Xu, T.; Ji, L.; Wang, D.; Lu, J.; Ma, S.; Fan, H. Reducing arc heat input and obtaining equiaxed grains by hot-wire method during arc additive manufacturing titanium alloy. Mater. Sci. Eng. A 2019, 742, 287–294. [Google Scholar] [CrossRef]
Figure 1.
Cold metal transfer plus pulse (CMT+P) process additive manufacturing system.

Figure 2.
Schematic diagram of sampling location and the size of the tensile sample.

Figure 3.
(a) Macro-morphology of deposited sample; (b) Weld bead morphology in the middle region of deposited samples; (c) cross-section of deposited samples.
Figure 3.
(a) Macro-morphology of deposited sample; (b) Weld bead morphology in the middle region of deposited samples; (c) cross-section of deposited samples.

Figure 4.
Microstructure of different regions of the sample #2: (a) bottom region, (b) lower region close to substrate, (c) middle region, (d) side wall region and (e) upper region.
Figure 4.
Microstructure of different regions of the sample #2: (a) bottom region, (b) lower region close to substrate, (c) middle region, (d) side wall region and (e) upper region.

Figure 5.
Microstructure of the middle region of as-deposited samples: (#1-c) sample #1, (#2-c) sample #2, (#3-c) sample #3 and (#4-c) sample #4.
Figure 5.
Microstructure of the middle region of as-deposited samples: (#1-c) sample #1, (#2-c) sample #2, (#3-c) sample #3 and (#4-c) sample #4.

Figure 6.
(a) microstructure of sample #4 and (b) bar chart of element percentage of two particles.

Figure 7.
Micro morphology defect recognition of the samples observed by SEM.

Figure 8.
Microscopic morphology and energy spectrum analysis of the middle region of sample #1.

Figure 9.
Microhardness distribution of different parts of as-deposited samples.

Figure 10.
Schematic diagram of the relationship between hardness change and microstructure.

Figure 11.
Stress strain curves of the H2 and V2 tensile specimens.

Figure 12.
Yield and tensile strength of different specimens in horizontal and vertical directions.

Figure 13.
Anisotropy of yield and tensile of different specimens in horizontal and vertical directions.
Figure 13.
Anisotropy of yield and tensile of different specimens in horizontal and vertical directions.

Figure 14.
SEM photos of morphology of cross section in the middle region of sample #4.

Figure 15.
Microscopic fracture morphologies of tensile specimens in horizontal and vertical directions: (a) #1-H2, #2-H2, #3-H2, and #4-H2 respectively and (b) #1-V2, #2-V2, #3-V2, and #4-V2 respectively.
Figure 15.
Microscopic fracture morphologies of tensile specimens in horizontal and vertical directions: (a) #1-H2, #2-H2, #3-H2, and #4-H2 respectively and (b) #1-V2, #2-V2, #3-V2, and #4-V2 respectively.


Table 1.
Chemical elements of ER316L wire and substrate (mass fraction/%).
| Element | Cr | Ni | Mo | Mn | Si | C | P | S | Fe |
|---|---|---|---|---|---|---|---|---|---|
| Welding wire | 18.57 | 11.72 | 2.57 | 1.72 | 0.54 | 0.015 | 0.024 | 0.008 | Bal. |
| Substrate | 16.0–18.0 | 10.0–14.0 | 2.0–3.0 | ≤2.0 | ≤0.75 | ≤0.03 | ≤0.045 | ≤0.030 | Bal. |
Table 2.
Deposition process parameters.
| Sample Mumber | Layer Number | Deposition Current I (A) | Deposition Voltage U (V) | Scanning Speed V (cm · min−1) | Wire Feeding Speed WFS (m · min−1) | Linear Energy L (kJ · cm−1) |
|---|---|---|---|---|---|---|
| #1 | Layer 1 | 124 | 17.9 | 30 | 6.5 | 2.0 |
| Layer 2–30 | 60 | |||||
| #2 | Layer 1 | 140 | 18.8 | 30 | 7.4 | 2.37 |
| Layer 2–30 | 60 | |||||
| #3 | Layer 1 | 150 | 19.4 | 30 | 8.0 | 2.62 |
| Layer 2–30 | 60 | |||||
| #4 | Layer 1 | 161 | 19.7 | 30 | 8.6 | 2.85 |
| Layer 2–30 | 60 |
© 2020 by the authors. Licensee MDPI, Basel, Switzerland. This article is an open access article distributed under the terms and conditions of the Creative Commons Attribution (CC BY) license (http://creativecommons.org/licenses/by/4.0/).
Share and Cite
MDPI and ACS Style
Xie, B.; Xue, J.; Ren, X.; Wu, W.; Lin, Z. A Comparative Study of the CMT+P Process on 316L Stainless Steel Additive Manufacturing. Appl. Sci. 2020, 10, 3284. https://doi.org/10.3390/app10093284
AMA Style
Xie B, Xue J, Ren X, Wu W, Lin Z. A Comparative Study of the CMT+P Process on 316L Stainless Steel Additive Manufacturing. Applied Sciences. 2020; 10(9):3284. https://doi.org/10.3390/app10093284
Chicago/Turabian StyleXie, Bin, Jiaxiang Xue, Xianghui Ren, Wei Wu, and Zhuangbin Lin. 2020. "A Comparative Study of the CMT+P Process on 316L Stainless Steel Additive Manufacturing" Applied Sciences 10, no. 9: 3284. https://doi.org/10.3390/app10093284
Note that from the first issue of 2016, this journal uses article numbers instead of page numbers. See further details here.