
A Study on the Influence of Bolt Arrangement Parameters on the Bending Behavior of Timber–Steel Composite (TSC) Beams

1
School of Civil Engineering, Central South University of Forestry and Technology, Changsha 410004, China
2
School of Civil Engineering, Xiangtan University, Xiangtan 411100, China
*
Author to whom correspondence should be addressed.
Buildings 2022, 12(11), 2013; https://doi.org/10.3390/buildings12112013
Submission received: 20 September 2022
/
Revised: 13 November 2022
/
Accepted: 15 November 2022
/
Published: 17 November 2022
(This article belongs to the Section Building Structures)
Abstract
:The present paper investigates the impact of bolt distance, bolt diameter, and the number of bolt rows on the bending performance of timber–steel composite (TSC) beams. This study aims to facilitate the application of bolt connections in assembled TSC structures. Composite steel I-beams were designed with timber boards connected in the upper section with bolts. Three-point static bending tests were conducted on nine timber–steel composite beams divided into four groups (L1, L2, L3, and L4) with varying bolt arrangements. The destruction mode, ultimate bearing capacity, ductility coefficient, load–midspan deflection curve, and load–midspan strain curve of each specimen were obtained. In addition, the destruction mechanism, the quantitative relationship between the bolt area ratio and interfacial slip, and the ideal bolt area ratio were identified. It was found that when the midspan deflection of the timber–steel composite beam approached the prescribed limit, the main failure mode can be explained as follows: The top surface of the boards of all the specimens had longitudinal local splitting, except L1, which had fewer bolts and no obvious damage. Moreover, due to compression and because the stress at the lower edge of the I-beam entered the flow amplitude stage, some of the specimens were crushed but were not pulled off. The composite beams had high flexural load capacity and ductility coefficient, and the maximum relative slips of the timber–steel interfaces were in the range of 2–6 mm. It was also found that the maximum slip of the interface and the ductility coefficient decreased steadily as the bolt area ratio increased, while the specimen’s flexural bearing capacity increased. The optimal bolt area ratio was determined to be 8 × 10⁻³. Using the total bolt area, we designed the arrangement of the bolts on the board. For convenience, multiple bolt variables were converted into one bolt variable. The longitudinal distance of the bolts had a greater impact on the slip, and the bolt diameter had a smaller impact. The theoretical values of total relative slip were found to be in good agreement with the experimental results, which were based on the superposition of the relative slip equations with varying bolt distances. The effective bolt area ratio and the formula of the relative slip of each segment can provide instructions for the arrangement of bolts and the control of the relative slip of intersections in engineering practices.
1. Introduction
The timber–steel composite beam, as a new form of composite beam construction, requires lower material costs than pure steel beams to achieve the same bearing capacity. Although the labor intensity of short-term processing is greater than that of pure steel beams, factory research shows that the economic cost of labor intensity required in processing is only 10% higher than that of pure steel beams, and market research shows that the material cost of steel per unit volume is a staggering 235% higher than that of timber. Therefore, the overall economic cost of using timber to replace part of steel is lower. In terms of environmental protection, timber produces less carbon dioxide; in terms of weight, the overall weight of the replacement beam is lighter; in terms of long-term use, the natural warm color of timber is more popular than the cold touch of steel. From a comprehensive point of view, the overall advantages of timber–steel composite beams are greater in the long run, and the application prospects are more extensive. Connection methods such as glue and fasteners are generally used to assemble timber–steel composite beams [1]. With the increase in bending load, glued timber–steel composite beams fracture due to the shear strength failure of the adhesive at the interface and the weak overall ductility of the specimen. Bolts are ductile fasteners used to connect timber boards to steel beams. However, shear force induces relative slippage at the interface of the structure after deformation. Under fixed controlled relative slippage, timber–steel composite beams can continue to bear loads and maintain good ductility. Thus, this paper investigates effective bolt arrangement to achieve smaller relative slip at the interface, which will allow the beams to continue to bear large flexural loads even when small relative slips occur. When the volume of each component of the assembled structure cannot be changed, this work can serve as a reference for improving flexural bearing capacity by manipulating bolt arrangements. In practice, structures hastily built with limited construction space and high load-bearing capacity requirements, such as temporary bridges for disaster relief and large-span load-bearing bridges in scenic spots, each component can be manufactured with reserved bolt apertures and then transported to the construction site for bolt fixing.
Several studies have been conducted on different bolt assemblies. For example, Gu et al. [2] conducted an axial compression test on bolted aluminum alloy honeycomb plates and composite beams and showed that the increase in bolt distance reduces the bearing capacity of the composite plate. Gu et al. conducted a numerical finite element analysis (FEA) to analyze further the influence of bolt distance on the axial compression bearing capacity of the plate. Wang et al. [3] conducted a bending test on bolted simply supported steel–concrete beams. The results showed that the flexural capacity and ductility of composite beams increase with the increase in bolt connections. Feng et al. [4] studied the influence of bolts on the shear performance of bolted steel–wood–steel composite beams and found that increasing the diameter or the number of bolts would cause shear failure along the grain of the timber on the composite beams. They also established a prediction model for the shear strength of bolted specimens. Johanides et al. [5] compared the connection performance of the combined bolt and pin connector with the performance of the single pin connector in the plywood specimen. They found that the bearing capacity, ductility, and deformation capacity of the laminated plywood specimen with bolt connection were significantly higher. Ganbaatar et al. [6] studied the diameter of bolts connecting wood to walls and concluded that strength and stiffness are improved with increased bolt diameter. Chybinski [7] conducted flexural experiments to investigate the load-carrying capacity, damage mode, and load–slip response of bolted aluminum–timber composite (ATC) beams and established a finite element damage model with small theoretical and experimental errors. Tran [8] conducted bending tests on bolted steel–hybrid composite beams, demonstrated bolts have better shear resistance than other fasteners, and proposed two bolt arrangements for optimal shear performance. Petrycki and Salem [9] compared the effects of bolt diameter and end distance on the mechanical properties of wood–steel–wood bolted assembled structures under fire stress. The results showed that increasing the bolt diameter more effectively improves the bearing capacity of the test specimen than increasing the bolt end distance. Ataeia et al. [10] studied the shear performance of bolts during the bending loading of steel–timber composite beams and found that the embedded bolted shear connectors have high energy-dissipating capacity and ductility when the edge distance between the bolt and the shear pockets is adequate. Hassanieh and Valipour [11] conducted a four-point bending test on the composite structure of laminated veneer and steel beam connected by bolts, screws, or glues. They found that the timber–steel composite (TSC) beam connected by bolts had better initial stiffness when the distance of shear connectors was changed. They also determined the composite efficiency of the TSC beam according to the experimental and FEA results. Studies on bolts in steel–concrete beams subjected to shear, aluminum alloy plates and beams subjected to compression, and other structures and stress states have been conducted in China and other countries. The results of these studies promote the development of bolts for the assembly of different structures and for different stress states. However, studies on the bending performance of bolts in TSC I-beams are lacking, and the influence of different bolt arrangements on the bending performance of TSC I-beams, to our knowledge, has yet to be studied. In addition, there is no effective total bolt area range that encompasses the different bolt parameters. Thus, multiple bolt parameters are converted into one bolt parameter in this study to facilitate the quick selection of bolt arrangements with minimum relative slip. In order to determine the effective total bolt area for the volume of timber–steel composite beams in actual engineering works, the present paper proposes the concept of bolt area ratio, which is the ratio of the total bolt area to the compressed area of the timber board. In addition, the present paper determines the effective total bolt area of the composite beam in actual engineering works by controlling the cross-section and volume of the timber–steel composite beam and by scaling the effective bolt area of the composite beam with a known volume and compressed area of the timber board. In addition, the present paper explores a bolt layout parameter that accounts for the biggest contribution ratio of the total bolt area to the relative slip. The results of this research serve as a basis for bolt arrangement parameters which provides a reference for the quick selection of bolt arrangement with minimum slip. These results also predict the load capacity of different composite beams by comparing the relative slip in the interfaces of the TSC I-beams with different bolt arrangements.
2. Materials and Methods
2.1. Specimens Design
Nine TSC I-beams were designed and constructed. These specimens were divided into four groups (one specimen in L1, four in L2, two in L3, and two in L4), and bending tests were conducted under simply supported conditions. The span, section height, width, top board, and I-beam dimensions of the four groups were identical, except for the bolt arrangement parameters. Timber boards and I-beams were connected with ordinary bolts. Because the focus of this paper is to investigate the effect of the bolt arrangement as a single variable on the flexural performance of composite beams, the boards were polished, sanded, and then coated with tung oil, a solvent-based coating that increases water resistance, in order to reduce the effect of shrinkage on relative slip due to water absorption in the timber boards. Furthermore, to reduce the influence of other factors, such as the friction coefficient of the timber–steel interface, on the relative slip, the surface of the timber boards was polished and evenly coated with epoxy resin as a transition layer, and the surface of the steel beam was carburized before the bolts of the specimen were assembled. The cross-sectional dimensions of the specimen are shown in Figure 1. The height and width were 130 and 145 mm, respectively, the thickness of the top board was 30 mm, the height of the I-beam was 100 mm, the thicknesses of the bottom plate and web plate of the I-beam were 4 mm, and the thickness of the top plate was 3 mm. The longitudinal dimensions of the specimen are shown in Figure 2. The total length of the beam was 1.5 m, and the calculated span was 1.35 m. Longitudinal 4 × 10 mm stiffening ribs were placed on the exterior of the top plank to enhance the longitudinal stability of the upper edge of the I-beams. The L3 group had no longitudinal stiffeners on the outer edges of the flange, except for L3-1. Note that L3-1 was compared with L3-2, which had stiffening ribs.
Ordinary bolts (4.8 grade) were used in accordance with the Standard for Design of Steel Structures [12] and European Code EN14545 [13]. Two rows of bolts were arranged transversely on L1, and four rows were arranged transversely in the other three groups. The distance of the longitudinal bolts was based on the principle of the dense middle between two ends. The longitudinal distance of the bolts at the end of the beam was 50 mm. The bolt diameters of the L1, L2, L3, and L4 groups were 5, 5, 6, and 8 mm, respectively. The longitudinal bolt distances of L2-1, L2-2, L2-3, and L2-4 were 210, 140, 70, and 70 mm, respectively, and the longitudinal bolt distances of L4-1 and L4-2 were 70 and 140 mm, respectively. The 3 mm steel transverse spacer was welded at the loading position and at the support of each specimen to facilitate load transfer and prevent excessive local stress. Figure 1 shows the cross-sectional arrangement of bolts in each group, and Figure 2 shows the elevation of specimens with different longitudinal distances of bolts. The arrangement parameters of bolts in each group of specimens are shown in Table 1.
2.2. Material Properties
The timber–steel composite beams were composed of polished Northeast Xing’an larch board, Q235 I-beam, and 4.8-grade ordinary bolts. Timber properties were tested according to the Test Method for Timber Structures [14] and American ASTM Standard [15]. The mechanical properties of timber were obtained from simplified test results according to Design Handbook for Timber Structures [16]. Mechanical properties of bolts and I-beams were in accordance with the Standard for Design of Steel Structures [12]. The basic mechanical properties of timber, steel, and bolts are listed in Table 2, Table 3 and Table 4, respectively.
2.3. Test Method
The experiments were conducted in the laboratory of the School of Civil Engineering, Central South University of Forestry and Technology, Hunan, China. In order to reduce the effects of temperature and humidity on the specimens and to highlight the effect of bolt arrangement as a single variable on the relative slip in the flexural performance of the composite beams, we controlled the dryness and temperature of the material to be consistent with the dryness and temperature of the experimental environment to reduce the effect of shrinkage on the specimens. The loading device arrangement shown in Figure 3a includes a 100 T reaction frame and 100 T hydraulic jack, and the load was simultaneously measured with a 30 T load sensor. In accordance with the European Code EN14545 [13], three-point bending tests were conducted on the composite beam. Before loading, the test instrument was checked to work properly by preloading the specimens to 15% of the estimated ultimate bearing capacity. Note that graded loading was used in the early stage of the actual tests. Before the 40 kN load, 5 kN was loaded in each stage and maintained for 30 s. After 40 kN, a 3 kN load was added to each stage and kept for 15 s. When the load sensor rebounded slightly, the load was added by a 1 mm increase in midspan deflection. Ultimate design strength, as defined by Yuan et al., is the absence of significant strength damage to the composite beam. When the midspan deflection reached 1/27 of the calculated span diameter, i.e., the midspan deflection was taken as 50 mm in this paper, the STC beam did not reach the peak load yet. Although the load-carrying capacity could still continue to increase, the deflection was considered to be too large, and it was assumed to have lost its actual value. Therefore, the maximum load was regarded as the limit state design standard value, and the test was completed.
For this experiment, the DH3861 static strain acquisition system and dial indicator were used to measure and read the strain and displacement of the beams, respectively. Dial indicators were installed on each of the flange boards and at the left and right ends of the I-beams to test the relative slip between the boards and I-beam. A displacement gauge was arranged at the bottom of the span of the beam to test the span deflection of the beam, as shown in Figure 3b. The strain gauge arrangement is shown in Figure 3e,f. In addition, 15 longitudinal strain gauges were arranged across the midsection to test the normal strain. Five longitudinal strain gauges (No. 1–5) were arranged transversely on top of the board, three longitudinal strain gauges (No. 6–8) were arranged along the height of the board, four longitudinal strain gauges (No. 9–12) were arranged along the height of the I-beam web, and three longitudinal strain gauges (No. 13–15) were arranged on the bottom of the I-beam.
2.4. Theoretical Method
2.4.1. Park’s Method
The yield point, as defined by Feng and Qiang [17], is a key performance point for the transition of engineering structure from elasticity to plasticity. As shown in Figure 4, the yield point strength was calculated by Park’s method [18]. In this method, we first determine Point A of 0.6 Pu on the load–displacement curve in Figure 4. Then, the OA line was extended to intersect with the horizontal line of the maximum load Point C at point B. Then, a vertical line of horizontal coordinates across Point B was made to intersect the curve at the yielding point. Finally, the value of the vertical coordinate of the yielding point was the yielding strength. The displacement ductility coefficient () was used to quantify the ductility performance of the member. This coefficient is calculated as follows:
where is deflection corresponding to yield load, is deflection corresponding to ultimate load, and is ductility coefficient, ratio of ultimate deflection to yield deflection.
2.4.2. Calculation of Bolts Relative Slip in Elastic State
Increasing the relative slip between the interfaces of timber–steel composite beams will reduce the bending capacity. Therefore, in order to compare the magnitude of the flexural load capacity of different specimens, it is important to calculate the relative slip of different specimens during normal conditions. Unlike the study done by Wang et al. [19], where the connectors were arranged at a single uniform distance in the pure bending section and bending-shear section, the present paper defines the bolt distance and sets a new intrinsic interface relationship (Figure 5) to facilitate calculation of the relative slip of the specimens. Thus, the connectors in each section can be arranged at various uniform distances. Note that the relative slip calculation method, the bolt distance in the three-point elastic limit state of the bending-shearing section, and the pure bending section are given. These parameters satisfy the following basic assumptions: ① The longitudinal horizontal shear force between the timber–steel interface was proportional to the relative slip. ② The influence of friction at the timber–steel interface on the relative slip was negligible. ③ The influence of preload applied on bolts on the relative slip of timber–steel composite beams was negligible. ④ After slip occurred between the interface, both the steel I-beam and the timber board conformed to the plane section assumption, and the curvature of both was the same at the same section. ⑤ The vertical lifting effect between the timber board and the steel I-beam was not considerable. In addition, during the analysis of relative slip at the timber–steel interface and the bolt aperture, we did not consider the aperture to influence the relative slip because we processed the smallest reserved aperture using fine assembly, resulting in a negligible bolt slip and greatly reducing the influence of the aperture on the relative slip. The subsequent theoretical analyses were also carried out based on this premise.
- (1)
- Constitutive relationship of timber–steel interface
According to the new constitutive relation of bolts at the composite beam interface (Figure 5), using the definition of bolt stiffness by Nie [20] and the assumptions ①, ②, and ③, the constitutive relation of the bolt at the intersection interface and the bolt stiffness calculation formula are as follows:
where and are shear flow and bolt stiffness on the interface of the composite beam, is the distance between the two sides of a single bolt (Figure 5), is the relative slip per unit length, and and are the number of bolts in the same section, and the ultimate bearing capacity of a single bolt, respectively. In addition, is the diameter of the bolt, and is the shear strength of a single bolt (Table 4).
Figure 5.
The interface constitutive relationship of timber–steel interface.

- (2)
- Equilibrium relationship at the timber–steel interface
Figure 6 shows that the equilibrium equation of the horizontal force system is:
Then, Equations (2) and (5) yield:
Figure 6.
Equilibrium relation of timber–steel interface.

- (3)
- Relative slip equation of bolt distance in elastic limit state
Using the assumption ④, the bending moment, and the axial force balance conditions in Figure 7, the following equations can be obtained:
Equation (9) yields:
where , , and are the bending moment, axial force, and bending rigidity of the board, respectively. In addition, , , and are the bending moment, axial force, and bending rigidity of the steel beam, and is the distance between the centroids of the board and the steel beam.
Figure 7.
Sectional strain diagram.

The assembled structure connected by fasteners generates relative slip at the interface [21,22]. This structure results in strain difference between the interface of the board and steel beam, i.e., slip strain [23]. Figure 7 shows that the calculation formula of slip strain is:
Combining Equations (10) and (11) results in:
where is the sum of the flexural stiffness of the timber board and the steel beam, i.e., . Note that since is constant, it is presented by .
By taking derivative of Equation (12) and combining it with Equation (6), it can be seen that the relative slip equation of bolt distance in each section in the elastic limit state is:
Since the load, each section of the bolt distance, and bolt diameter arrangement are known, the coefficients in Equation (13) are constant as:
The slip differential equation, presented in Equation (13), in each interval can be simplified as:
As shown in Figure 8, the following equations are established by the slip differential equations and boundary conditions:
These equations were solved by MATLAB software and the results revealed that the relative slip of each section of the bending-shear section and the pure bending section under the three-point loading were as follows:
where and are the relative slips of each section of the bending-shear section and the pure bending section under the action of three equally divided point loading. In addition, and are calculated span and beam length, respectively, and and are constant. The calculation method is presented in Equation (14).
3. Results and Discussion
3.1. Failure Mode and Mechanism
Nine equal-section timber–steel composite beams were loaded in the flexural test. Failure and damage occurred when the midspan deflection reached 50 mm, which is considered for the safety of the test. Note that values higher than 50 mm are less likely to occur in engineering applications. Meanwhile, as shown in Figure 9a, the lower edge of the I-beam was not broken during the test. The specific damage phenomena of each group of test specimens are as follows:
When the midspan deflection of each specimen reached the specified limit value, all the specimens had longitudinal local cracks (splitting) on the top surface of the board, and some of the specimens were crushed, except for the timber board on the top of L1-1, which had no obvious damage. Due to the arrangement with fewer bolts (2 rows of bolts spaced 210 mm along the longitudinal direction), the connection of the L1-1 composite beams was weak, and the rigidity was small. Therefore, when the midspan deflection reached an extreme value, there was no obvious damage to the board.
When the load subjected by L1-1 reached 40 kN, which was about 54% of the ultimate load, the board began to produce a slight sound from the extrusion of the bolts during sliding of the board. Up until the end of the load, there was no strength failure of the specimen except for excessive midspan deflection, as shown in Figure 9b. This is due to the fact that the specimens were arranged with too few bolts (two rows laterally), resulting in a larger slip at the intersection and a smaller overall stiffness of the composite beam.
When L2-1 was subjected to a load of 71 kN, which was about 74% of the ultimate load, cracks appeared on the top surface of the timber board in the bending-shear section of the specimen, as shown in Figure 9c. As shown in Figure 9d, when the ultimate load was reached, the timber fibers in the tensile area below the loading point fractured longitudinally with a brittle sound. Figure 9e shows that a crushing phenomenon occurred in the compression area of the timber board. When L2-2 was subjected to 76 kN, accounting for about 96% of the ultimate load, a crushing phenomenon appeared in the compression zone below the loading point of the specimen, as shown in Figure 9e. Figure 9c shows that when the load of L2-3 and L2-4 reached 82 and 80 kN, accounting for 92% and 90% of the ultimate load, respectively, moderate longitudinal cracks appeared on the bending-shear section of the top surface of the timber.
L3-1 had no longitudinal stiffening ribs. When the load reached 71 kN, which was about 78% of the ultimate load, local steel plate buckling occurred on the upper flange of the I-beam below the loading point, as shown in Figure 9f. Figure 9c shows that as the load increased, longitudinal cracks appeared on the top surface of the bending-shear section of L3-1, and the signs of steel plate buckling intensified. In addition, a crushing phenomenon appeared in the compression area of the timber board above the section, as shown in Figure 9e. L3-2 had longitudinal stiffening ribs, and when the load was further increased to 84 kN, which was about 97% of the ultimate load, longitudinal cracks appeared on the top surface of the timber board in the bending-shear section of the specimen, as shown in Figure 9c.
The longitudinal bolt distance of L4-2 was doubled compared with that of L4-1. Figure 9b shows that L4-2 reached the ultimate load without signs of damage. Figure 9c shows that upon increasing the load to 88 kN, which was about 96% of the ultimate load, longitudinal cracks appeared on the top surface of the L4-1 timber in the bending-shear section.
When the composite beam specimen was bent, the top timber board and the lower edge steel plate of the midspan section were subjected to large longitudinal compressive stress and tensile stress, respectively. The top timber board generated a large transverse tensile stress under the combined action of bending compressive stress and local compressive stress of the bolts, while the tensile strength parallel to the timber grain was low. With the increase in load, when the maximum transverse tensile stress of the board exceeded the ultimate tensile strength parallel to the grain, the timber was pulled transversely and produced local longitudinal cracks (splitting). The total flexural rigidity of the composite beam was significantly reduced after the local splitting of the top board, while the vertical deflection of the beam in the middle of the span was sharply enhanced. Due to the high ultimate tensile strength of steel, the lower edge of the I-beam bore large tensile stress, but until the maximum vertical deflection of the test specimen exceeded the limit value, the steel at the lower edge was not subject to tensile damage. Since the steel plate at the upper flange of the composite beam was wide and thin, and lateral bending rigidity was small, local buckling easily occurred under the longitudinal compressive stress. Thus, the arrangement of longitudinal ribs can prevent local buckling.
3.2. Load–Midspan Deflection Curve
Figure 10 shows the load–midspan deflection curve of nine wood steel composite beams. When the midspan deflection of each group of test specimens reached 50 mm, the load was stopped. According to the test process and results, the stress states of all the composite beams, except for L1-1, can be divided into three stages: elastic, elastic–plastic, and plastic. In the elastic stage, the slopes of the specimens arranged with the same bolt parameters were more or less the same. When the increasing rate of the midspan deflection was small, the bending load of the composite beams increased rapidly. In the elastic–plastic stage, the midspan deflection increase rate of the composite beams gradually surpassed that of the flexural load. In the plastic stage, when the bending load increased slightly, the midspan deflection increase rate was also large, and the load–deflection curve gradually leveled. However, up until the loading was stopped, there was no obvious descent of the load–deflection curve, and the specimens showed good ductility.
The mechanical performance data of each specimen given in Table 5 reveals that the ultimate bearing capacity of L3-1 without the longitudinal ribs was only 3.87% higher than that of L3-2 with the longitudinal ribs. This is because the ribs increased the central axis of the composite beam, resulting in a slight decrease in the compression zone. The ductility coefficient of L3-2 was 10.68% lower than that of L3-1, implying that L3-2 yielded late in the process of bending load. In addition, the bearing capacity was larger in the limit state of normal use. This is because the longitudinal ribs prevented buckling of the upper flange of the I-beam but did not decrease the overall yield-bearing capacity of the specimen caused by local steel flange buckling of the specimen. Thus, the mechanical properties of the assembled composite members were fully utilized.
In the case of adding longitudinal ribs, the effect of bolt arrangement parameters (bolt row number, longitudinal bolt distance, and bolt diameter) on the flexural capacity and ductility coefficient of the composite beams are different. The details were as follows:
The ultimate bearing capacity of L2-1 (4 transverse rows) was 3% higher than that of L1-1 (2 transverse rows). The ductility coefficient of L2-1 was 23% higher than that of L1-1. This shows that the increase in bolt arrangement improved the bending capacity and ductility of composite I-beams.
The ultimate bearing capacities of L2-3 and L2-4 were the highest, L2-2 had the second highest, and L2-1 had the lowest. The average ultimate bearing ca-pacities of L2-3 and L2-4 were 89.5 kN, 19% higher than that of L2-1. The average ultimate bearing capacity of L2-2 was 7% higher than that of L2-1. The ductility coefficients of L2-3 and L2-4 were 41% lower than that of L2-1 and 26% lower than L2-2. Note that the average ductility coefficients of L2-3 and L2-4 were 3.64 mm. These results show that the decrease in longitudinal distance between bolts greatly improved the flexural bearing capacity, but reduced the ductility coefficient.
The ultimate bearing capacity of L4-1 became the highest by changing the bolt diameter, with an average of 89.5 kN, followed by L2-3 and L2-4. The ultimate bearing capacity of L3-2 was the lowest. Specifically, the ultimate bearing capacity of L4-1 was 5% higher than that of L3-2, and the ultimate bearing capacity of L2-3 and L2-4 was an average of 89.5 kN, 3% higher than that of L3-2. The ductility coefficient of L4-1 was 5% lower than that of L3-2, and the ductility coefficient of L2-3 and L2-4 was an average of 3.64 mm, 11% lower than that of L3-2. This shows that the bolt diameter had little effect on bending capacity but had a certain influence on ductility.
In summary, changing the bolt longitudinal distance greatly influences the flexural bearing capacity by affecting the overall stiffness of the composite beam. Thus, composite I-beams with better bolt distance have better stiffness and increased flexural bearing capacity.
3.3. Slip Effect of Timber–Steel Interface
During the loading and bending process of the composite beam, the bolt connector deformed due to the longitudinal horizontal shear force at the interface. The tilt or deform caused relative slip at the timber–steel interface of the composite beam specimen, which, in turn, caused the flexural capacity of the composite beam to decrease. The relative slip of the timber–steel composite beam is shown in Figure 11. This test was carried out using a dial indicator to improve the accuracy of the relative slip value. During the slip process, the outward extension of the board was positive, and the inward retraction of the steel web was negative.
Figure 12 illustrates the load–slip curves of each specimen. When the load was small, the relative slip increased linearly with the load. However, when the stress reached the yield stage, the slip increased nonlinearly with the increase in load, so a smaller increase in load caused a larger increase in slip. The maximum slip value of each specimen was in the range of 2–6 mm, among which L4-1 had the smallest slip peak, and L1-1 had the largest slip peak.
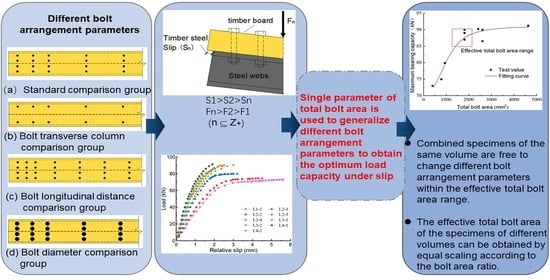
As shown in Table 6, this paper proposes the concept of total bolt area to quickly select bolt arrangements with minimum relative slip to satisfy engineering applications. The total area of the bolts was taken as the product of the number of bolts on the top surface of the test specimen and the tangential area of a single bolt. Determination of the total area of the bolts facilitated free bolt arrangement. Figure 13 shows the relationship between the maximum slip of the specimen interface and the total area of the bolt. It can be seen that as the total area of the bolt increased, the maximum slip of the interface gradually decreased. When the total bolt area was less than 1800 mm2, the slip curve decreased rapidly, and then the curve decreased slowly. Thus, considering the number of bolts for economic and anti-slip performance, the optimal bolt area ratio (k) is 8 × 10⁻³, which has a corresponding maximum slip of about 2.5 mm, as demonstrated by L2-3 and L2-4, as shown in Table 6. The bolt diameter was 5 mm, the longitudinal distance was 70 mm, and there were 4 transverse rows of bolts.
Figure 14 shows that the ultimate bearing capacity of composite beams decreased almost linearly with the increase in interface slip. Figure 15 shows that the maximum bearing capacity value increased gradually as the total area of the bolt increased. When the total bolt area is less than 1800 mm2 (k = 8 × 10⁻³), the bearing capacity curve rises faster, and then the curve rises slowly. Considering the number of bolts for comprehensive economic and load-bearing performance, the bolt area ratio k = 8 × 10⁻³ is desirable, which has a maximum slip of about 2.5 mm, as demonstrated by L2-3 and L2-4, as shown in Table 6. The bolt diameter was 5 mm, the longitudinal distance was 70 mm, and there were 4 transverse rows of bolts.
Figure 16 shows the influence of the relative slip of timber–steel interface on the ductility coefficient. When the relative slip value was less than 4.5 mm, the ductility coefficient increased with the increase in slip. When the relative slip value was greater than 4.5 mm, the ductility coefficient decreased with the increase in slip. This implies that within the parameters of the optimal bolt area ratio, increasing the total bolt area can effectively reduce the interface slip of the composite beam and improve its flexural capacity but reduce the ductility coefficient.
The total bolt area is affected by bolt diameter, bolt distance, and bolt row number. In addition, the influences of the three bolt parameters on phase slip are different. Table 6 shows that by changing the longitudinal distance of bolts in the L2 group, the slip of L2-1 was 84% higher than that of L2-3 and L2-4, with an average of 2.45 mm. By changing the row number of bolts, the relative slip of L1-1 increased by 24% compared with L2-1. By changing the bolt diameter, the relative slip of L2-3 and L2-4 increased by 22% compared with L2-1. In summary, for this test, the longitudinal distance of bolts had a great impact on the relative slip, and the number of rows and diameter of bolts had a relatively slight impact.
3.4. Comparison of Experimental and Theoretical Results
The relative slip of each bending-shear section and pure bending section was obtained through three-point loading and Equation (17). The theoretical value of the total relative slip of the composite beam can be obtained by superposition. Table 7 provides the comparison between the theoretical value of relative slip obtained by the relative slip model and the experimental value of relative slip under three-point loading. The relative error between the theoretical and experimental values of relative slip was around 15%, and the larger error may have been caused by many factors, such as aperture gap and radial shrinkage of timber, but this error was within the allowable range of practical engineering. As a result, the superposition of each section’s relative slip values can be utilized to calculate the relative slip of the elastic limit of timber–steel composite beams, which can efficiently predict the relative slip of the interface of assembled composite beams in engineering practice.
4. Conclusions
In the present paper, the bending tests were conducted on four groups of timber–steel composite I-beams with equal cross-sectional dimensions. The three-point loading was applied on the beams assembled with various bolt sizes, bolt distances, and bolt rows. The effects of different bolt arrangement parameters on the flexural performance of timber–steel composite beams were experimentally and theoretically investigated. The following conclusions can be drawn from the results:
- (1)
- When the span deflection reached the limit value of 50 mm, the failure mode of nine timber–steel composite beams was as follows. ① Except for the top timber board of the L1 group, which had no obvious damage, the top surface of the board of all other specimens had longitudinal cracks (splitting) due to compression, and some of the boards of the specimens were crushed. ② The stress at the lower edge of the I-beam entered the flow amplitude stage, but the boards did not fracture. The composite beam connection was weak, and the stiffness was low due to the relatively few bolts assembled in the L1 group. Thus, when the midspan deflection reached an extreme value, there was no evident damage to the top board. Moreover, the bearing capacity was poor.
- (2)
- The load–deflection curve of the composite beam showed that the midspan deflection increased with the increase in the load. The elastic, elastic–plastic, and plastic stages were identified in the load–deflection curve. The composite beam had good ductility.
- (3)
- The maximum relative slip of the timber–steel interface was 2–6 mm. With the increase in bolt area ratio, the maximum slip of the interface decreased gradually, and the flexural bearing capacity of the specimen increased significantly, but the ductility coefficient decreased. Considering bolt number and economic and mechanical performance, the best bolt area ratio obtained was 8 × 10⁻³. Among the different bolt arrangement parameters, the longitudinal distance of bolts had a great influence on the slip, and the bolt diameter had little influence.
- (4)
- The constitutive, geometric, and equilibrium relationships of the timber–steel interface were used to derive the relative slip equations for each section. The total relative slip values after superposition were found to be in good agreement with the experimental data, and the error was controlled within 15%, which serves as a reference for predicting the relative slip of composite beams and bolts in practical engineering.
Author Contributions
Conceptualization, J.W. and R.L.; methodology, J.W. and R.L.; software, R.L.; validation, J.L., L.C. and Z.W.; formal analysis, J.L.; resources, J.W.; data curation, R.L.; writing—original draft preparation, R.L.; writing—review and editing, J.W.; visualization, R.L.; supervision, J.W.; project administration, J.W.; funding acquisition, J.W. All authors have read and agreed to the published version of the manuscript.
Funding
This work was supported by Central South University of Forestry and Technology (Grant No. 9010263203077).
Data Availability Statement
All data, models, and code generated or used in this study are available upon request from the corresponding author.
Conflicts of Interest
The authors are unaware of any conflicts of interest.
References
- Awadhani, L.V.; Bewoor, A. Parametric Study of Single Bolted Composite Bolted Joint Subjected to Static Tensile Loading. IOP Conf. Ser. Mater. Sci. Eng. 2017, 225, 012257. [Google Scholar]
- Gu, Y.; Zhao, C.Q.; Yang, Y.; Zhao, W.R. Connection Performance of Bolted Aluminum Alloy Honeycomb Panel-Beam Composite Structure. Key Eng. Mater. 2019, 4830, 59–66. [Google Scholar] [CrossRef]
- Wang, Y.-H.; Yu, J.; Liu, J.-P.; Chen, Y.F. Experimental study on assembled monolithic steel-concrete composite beam in positive moment. Eng. Struct. 2019, 180, 494–509. [Google Scholar] [CrossRef]
- Xin, F.; Hongbin, X.; Bowang, C. Experimental study on splitting strength of sawn lumber loaded perpendicular to grain by bolted steel-wood-steel connections. J. Build. Eng. 2021, 44, 102554. [Google Scholar]
- Johanides, M.; Lokaj, A.; Mikolasek, D.; Mynarcik, P.; Dobes, P.; Sucharda, O. Timber Semirigid Frame Connection with Improved Deformation Capacity and Ductility. Buildings 2022, 12, 583. [Google Scholar] [CrossRef]
- Ganbaatar, A.; Mori, T.; Inoue, R.; Danzandorj, S. Strength Performance of the Connection between Brick and SPF Lumber. Buildings 2022, 12, 465. [Google Scholar] [CrossRef]
- Chybiński, M.; Polus, Ł. Experimental and numerical investigations of aluminium-timber composite beams with bolted connections. Structures 2021, 34, 1942–1960. [Google Scholar] [CrossRef]
- Tran, M.T.; Van Do, V.N.; Nguyen, T.A. Behaviour of steel-concrete composite beams using bolts as shear connectors. IOP Conf. Ser. Earth Environ. Sci. 2018, 143, 12–27. [Google Scholar] [CrossRef]
- Roman, P.A.; Osama, S. Structural fire performance of wood-steel-wood bolted connections with and without perpendicular-to-wood grain reinforcement. J. Struct. Fire Eng. 2019, 1, 1–20. [Google Scholar] [CrossRef]
- Ataei, A.; Chiniforush, A.A.; Bradford, M.A.; Valipour, H.R.; Ngo, T.D. Behaviour of embedded bolted shear connectors in steel-timber composite beams subjected to cyclic loading. J. Build. Eng. 2022, 54, 104581. [Google Scholar] [CrossRef]
- Hassanieh, A.; Valipour, H.R.; Bradford, M.A. Experimental and numerical study of steel-timber composite (STC) beams. J. Constr. Steel Res. 2016, 122, 367–378. [Google Scholar] [CrossRef]
- GB 50017-2003; Code for Design of Steel Structures. Ministry of Housing and Urban-Rural Development of the People’s Republic of China: Beijing, China, 2017; pp. 73–92.
- EN 1995-1-1-2008; DD ENV1995-1-1. Eurocode 5: Design of Timber Structures. British Standards Institution: London, UK, 1994; pp. 73–92.
- GB 50005-2017; Standard for Design of Timber Structures. Ministry of Housing and Urban-Rural Development of the People’s Republic of China: Beijing, China, 2017; pp. 41–60.
- (2007)D143-94 [S]; Standard Test Methods for Small Clear Specimens of Timber. ASTM: West Conshohocken, PA, USA, 2007.
- Design Handbook for Timber Structures Editorial Committee. Design Handbook for Timber Structures; Architecture & Building Press: Beijing, China, 2005; pp. 43–48. [Google Scholar]
- Feng, P.; Qiang, H.L. Discussion and definition on yield points of materies, members and structures. Eng. Mech. 2017, 34, 36–46. [Google Scholar]
- Park, R. State of the art report ductility evaluation from laboratory and analytical testing. In Proceedings of the Ninth World Conference on Earthquake Engineering, Tokyo, Japan, 2–9 August 1988. [Google Scholar]
- Wang, P.; Zhou, D.H. Calculation on slip of composite beams with stepwise uniform distribution of shear connectors. Build. Struct. 2011, 41, 96–101. [Google Scholar]
- Nie, J.G.; Shen, J.M. A general formula for predicting the deflection of simply supported composite steel-concrete beams with the consideration slip effect. Eng. Mech. 1994, 11, 21–27. [Google Scholar]
- Lam, D.; El-Lobody, E. Behavior of Headed Stud Shear Connectors in Composite Beam. J. Struct. Eng. 2005, 131, 96–107. [Google Scholar] [CrossRef]
- Gutkowski, R.; Brown, K.; Shigidi, A.; Natterer, J. Laboratory tests of composite wood-concrete beams. Constr. Build. Mater. 2008, 22, 1059–1066. [Google Scholar] [CrossRef]
- Mao, L.; Chen, D.W. Closed-form Solution of Composite Beam Considering Interfacial Slip Effects. J. Tongji Univ. (Nat. Sci.) 2011, 39, 1113–1119. [Google Scholar]
Figure 1.
Cross-section bolt arrangement structure of L1–L4 test specimens (unit: mm): (a) L1 group cross-section bolt layout structure; (b) Layout and structure of L2–L4 group cross-section bolts (Note: L3-1 test specimen has no longitudinal stiffening ribs).
Figure 1.
Cross-section bolt arrangement structure of L1–L4 test specimens (unit: mm): (a) L1 group cross-section bolt layout structure; (b) Layout and structure of L2–L4 group cross-section bolts (Note: L3-1 test specimen has no longitudinal stiffening ribs).

Figure 2.
Vertical structural layout of each test specimen (unit: mm): (a) Elevation of test specimens (L2-3, L2-4, L3-1, L3-2, and L4-1) with longitudinal distance of 70 mm; (b) Elevation of test specimen (L2-2 and L4-2) with longitudinal distance of 140 mm; (c) Elevation of test specimen (L1-1 and L2-1) with longitudinal distance of 210 mm.


Figure 3.
Arrangement of instrument and strain gauge (unit: mm): (a) Loading device arrangement; (b) Arrangement of loading device, displacement gauge and dial gauge; (c) Arrangement of strain gauges on the timber surface; (d) Arrangement of strain gauges on the lower surface of I-beam bottom; (e) Midspan section of the L1 test specimen; (f) Midspan section of L2–L4 test specimens.


Figure 4.
Park’s method.

Figure 8.
Calculation diagram and bolt arrangement under three-point loading.

Figure 9.
Phenomenon of test specimen: (a) the lower edge of I-beam is not broken (Note: All test specimens); (b) the timber is free of damage (Note: L1-1 test specimen and L4-2 test specimen); (c) longitudinal cracks of the bending-shearing section on the top surface of timber board (Note: L2-1, L2-4, L3-1, L3-2, and L4-1 test specimen); (d) longitudinal fracture of tensile zone of timber (Note: L2-1 test specimen); (e) the compression area of the timber is crushed (Note: L2-1, L2-2, and L3-1 test specimen); (f) buckling of upper flange of I-beam (Note: L3-1 test specimen).

Figure 10.
The load–midspan deflection curve.

Figure 11.
Schematic diagram of slippage.

Figure 12.
The load–slip curve.

Figure 13.
The maximum slip at interface in terms of the total bolt area.

Figure 14.
The maximum bearing capacity vs. the maximum slip curve of interface.

Figure 15.
The maximum load capacity vs. total bolt area curve.

Figure 16.
The ductility coefficient vs. the maximum slip curve of interface.


Table 1.
Bolt layout parameters of each test specimen (unit: mm).
| Specimen No. | Longitudinal Stiffening Ribs | |||
|---|---|---|---|---|
| L1-1 | 2 | 5 | 210 | yes |
| L2-1 | 4 | 5 | 210 | yes |
| L2-2 | 4 | 5 | 140 | yes |
| L2-3 | 4 | 5 | 70 | yes |
| L2-4 | 4 | 5 | 70 | yes |
| L3-1 | 4 | 6 | 70 | no |
| L3-2 | 4 | 6 | 70 | yes |
| L4-1 | 4 | 8 | 70 | yes |
| L4-2 | 4 | 8 | 140 | yes |
Notes: , , and are bolt row number, bolt diameter, and longitudinal bolt distance, respectively.
| Moisture Content (%) | Compressive Strength along Grain (MPa) | Tensile Strength along Grain (MPa) | Shear Strength along Grain (MPa) | Elastic Modulus (MPa) |
|---|---|---|---|---|
| 13.6 | 26 | 20.79 | 7 | 12,000 |
Table 3.
Mechanical properties of carbon steel taken from Ref. [12].
Table 3.
Mechanical properties of carbon steel taken from Ref. [12].
| Yield Strength (MPa) | Tensile Strength (MPa) | Shear Strength (MPa) | Elastic Modulus in Compression (MPa) |
|---|---|---|---|
| 235 | 375 | 141 | 206,000 |
Table 4.
Mechanical properties of carbon steel bolts taken from Ref. [12].
Table 4.
Mechanical properties of carbon steel bolts taken from Ref. [12].
| Yield Strength (MPa) | Shear Strength (MPa) | Tensile Strength (MPa) |
|---|---|---|
| 320 | 141 | 400 |
Table 5.
Mechanical properties test data of specimens.
| Specimen No. | |||||
|---|---|---|---|---|---|
| L1-1 | 57.08 | 10.63 | 73.00 | 50 | 4.70 |
| L2-1 | 60.09 | 8.15 | 75.00 | 50 | 6.13 |
| L2-2 | 61.26 | 10.18 | 79.90 | 50 | 4.91 |
| L2-3 | 66.01 | 13.38 | 89.00 | 50 | 3.73 |
| L2-4 | 67.68 | 14.08 | 90.00 | 50 | 3.55 |
| L3-1 | 67.32 | 10.88 | 90.00 | 50 | 4.59 |
| L3-2 | 64.99 | 12.18 | 86.52 | 50 | 4.10 |
| L4-1 | 68.45 | 12.88 | 91.14 | 50 | 3.88 |
| L4-2 | 67.39 | 12.76 | 90.25 | 50 | 3.91 |
Table 6.
Bearing capacity, slip and bolt parameters of the composite beam.
| Specimen No. | (kN) | (mm) | (Piece) | |||
|---|---|---|---|---|---|---|
| L1-1 | 73.00 | 5.6 | 20 | 392.70 | 225,000 | 1.75 |
| L2-1 | 75.00 | 4.5 | 40 | 785.40 | 3.49 | |
| L2-2 | 79.90 | 3.2 | 48 | 942.48 | 4.19 | |
| L2-3 | 89.00 | 2.4 | 92 | 1806.42 | 8.03 | |
| L2-4 | 90.00 | 2.5 | 92 | 1806.42 | 8.03 | |
| L3-1 | 90.00 | 2.3 | 92 | 2601.24 | 11.56 | |
| L3-2 | 86.52 | 2.0 | 92 | 2601.24 | 11.56 | |
| L4-1 | 91.14 | 1.9 | 92 | 4624.42 | 20.55 | |
| L4-2 | 90.25 | 2.3 | 48 | 2412.74 | 10.72 |
Note: and are the maximum relative slip value corresponding to the maximum bearing capacity and the max-imum bearing capacity, respectively. In addition, , , and are the total area of the top surface of the wooden board, the number of bolts on the top surface of the wooden board, and the total area of the bolts on the top surface of the wooden board, respectively. In addition, the bolt area ratio (k) is the ratio of the total area of bolts to the area of the plank.
Table 7.
The theoretical and experimental values of relative slip of elastic limit theory of composite beams.
Table 7.
The theoretical and experimental values of relative slip of elastic limit theory of composite beams.
| Specimen No. | |||
|---|---|---|---|
| L1-1 | 1.32 | 1.41 | 0.93 |
| L2-1 | 1.14 | 1.22 | 0.93 |
| L2-2 | 0.78 | 0.85 | 0.91 |
| L2-3 | 0.61 | 0.71 | 0.85 |
| L2-4 | 0.62 | 0.71 | 0.87 |
| L3-1 | 0.54 | 0.64 | 0.84 |
| L3-2 | 0.60 | 0.72 | 0.83 |
| L4-1 | 0.50 | 0.58 | 0.86 |
| L4-2 | 0.72 | 0.81 | 0.89 |
Note: and are the experimental and theoretical total relative slip values of composite beam under elastic limit state, respectively.
Publisher’s Note: MDPI stays neutral with regard to jurisdictional claims in published maps and institutional affiliations. |
© 2022 by the authors. Licensee MDPI, Basel, Switzerland. This article is an open access article distributed under the terms and conditions of the Creative Commons Attribution (CC BY) license (https://creativecommons.org/licenses/by/4.0/).
Share and Cite
MDPI and ACS Style
Liu, R.; Liu, J.; Wu, Z.; Chen, L.; Wang, J. A Study on the Influence of Bolt Arrangement Parameters on the Bending Behavior of Timber–Steel Composite (TSC) Beams. Buildings 2022, 12, 2013. https://doi.org/10.3390/buildings12112013
AMA Style
Liu R, Liu J, Wu Z, Chen L, Wang J. A Study on the Influence of Bolt Arrangement Parameters on the Bending Behavior of Timber–Steel Composite (TSC) Beams. Buildings. 2022; 12(11):2013. https://doi.org/10.3390/buildings12112013
Chicago/Turabian StyleLiu, Ruiyue, Jiatong Liu, Zhenzhen Wu, Ling Chen, and Jiejun Wang. 2022. "A Study on the Influence of Bolt Arrangement Parameters on the Bending Behavior of Timber–Steel Composite (TSC) Beams" Buildings 12, no. 11: 2013. https://doi.org/10.3390/buildings12112013
Note that from the first issue of 2016, this journal uses article numbers instead of page numbers. See further details here.