
A Comparison of Energy Consumption in American Homes by Climate Region


1
School of Construction Management Technology, Purdue University, West Lafayette, IN 47907, USA
2
Department of Built Environment, Indiana State University, Terre Haute, IN 47809, USA
*
Author to whom correspondence should be addressed.
Buildings 2022, 12(1), 82; https://doi.org/10.3390/buildings12010082
Submission received: 19 November 2021
/
Revised: 5 January 2022
/
Accepted: 13 January 2022
/
Published: 16 January 2022
(This article belongs to the Topic Energy Efficiency, Environment and Health)
Abstract
:The present research analyzes the impact of nine factors related to household demographics, building equipment, and building characteristics towards a home’s total energy consumption while controlling for climate. To do this, we have surveyed single-family owned houses from the 2015 Residential Energy Consumption Survey (RECS) dataset and controlled the analysis by Building America climate zones. Our findings are based on descriptive statistics and multiple regression models, and show that for a median-sized home in three of the five climate zones, heating equipment is still the main contributor to a household’s total energy consumed, followed by home size. Social-economic factors and building age were found relevant for some regions, but often contributed less than size and heating equipment towards total energy consumption. Water heater and education were not found to be statistically relevant in any of the regions. Finally, solar power was only found to be a significant factor in one of the regions, positively contributing to a home’s total energy consumed. These findings are helpful for policymakers to evaluate the specificities of climate regions in their jurisdiction, especially guiding homeowners towards more energy-efficient heating equipment and home configurations, such as reduced size.
1. Introduction
In 2020, energy consumption in buildings, that is commercial and residential usage combined, accounted for approximately 40% of the total energy consumed in the United States [1]. Despite many Americans having to work and study from home due to workplace restrictions and local lockdowns because of the COVID-19 pandemic, total residential energy consumption including energy system losses presented a 4% reduction compared to that of 2019. Part of this result can be linked to warmer weather during winter, which helped to reduce the use of heating in homes [2]. While this information is positive, the increased time spent at home stresses the importance of understanding energy consumption patterns in American homes to further improve their efficiency and to provide guidance for policymakers on the matter. Additionally, topics related to energy consumption patterns are increasingly important to students and professionals of the built environment given the United Nations Sustainable Development Goal 7—affordable and clean energy [3].
It is well known that energy consumption in homes is mainly affected by physical characteristics of the home, household characteristics and behavior, home appliances, and exterior factors, including energy market and climate [4]. Physical characteristics of the home include building materials, home configuration, and size, among others. Household factors include behavioral factors, such as their level of environmental consciousness and also intrinsic characteristics, such as education, income, number of members. Home appliances include the different appliances and equipment in the home, given that some are more efficient than others. Exterior factors include primarily location and climate characteristics. It is well known that changes in weather can have a significant impact on the energy consumption of traditional homes [5].
Although isolated factors have been widely studied, few published research studies have explored the interaction of factors related to energy consumption in homes. Hirst et al. [6] have provided an interesting analysis of the contribution of several factors to a home’s energy consumption, though the study is now decades old. Other recent studies also based on previous versions of the Residential Energy Consumption Survey (RECS) have provided a baseline on the effects of household and physical characteristics of homes, but they did not separate their analysis by climate zones. Furthermore, while they have provided interesting results, some of them did not control for housing type [4,7,8], or, when housing type was controlled for, researchers evaluated only electricity consumption [9]. A more nuanced analysis of total energy consumption by region and controlling for the most frequent home type in the United States—the single-family home—can provide targeted information to guide specific energy-related built environment policies and improvement efforts.
To this end, we propose reviewing the most recently published microdata of the Residential Energy Consumption Survey (RECS), which was collected during 2015, and comparing the results per climate zone. Regression models were developed per Building America climate zones [10] and include factors related to physical characteristics of the home, household characteristics, and appliances and equipment used in the homes. Providing analysis per climate type allows for a more nuanced view of the factors’ contributions to the overall energy consumption in a home, while still being able to match with geographical regions. Therefore, the significance and originality of the present study lie in the combination of (1) its focus on the most common housing typology in the United States (the single-family, detached home), (2) the use of an updated and large dataset to analyze the contribution of factors that are known to influence a household’s energy consumption, and (3) the analysis the results by climate region.
2. Background Literature
The analysis of factors influencing energy consumption in buildings is a complex matter [8]. This is mainly because of the number of different factors and their potential interactions influencing energy consumption, which make interpretation of results difficult. In fact, Jones et al. [11] have surveyed academic papers to find 62 factors that may affect energy consumption in homes. However, of those 62, only 20 factors were consistently found to positively influence energy consumption. Despite that, many researchers have worked to improve our understanding of residential energy consumption. Even though there are several factors to be included in the analysis, they can generally be summarized into four main categories: physical characteristics of the home, household characteristics and behavior, home appliances, and exterior factors. These categories are adapted from Estiri [4] and we have combined energy market and climate into exterior factors.
Perhaps the most evident factor that influences energy is climate [12]. This includes temperature and humidity, in addition to solar radiation, wind, and rain [13]. Many studies use heating degree days (HDD) and cooling degree days (CDD) to verify the impact of temperature on energy consumption, such as those conducted by Hojjati and Wade [14], Sanquist et al. [9], and Iraganaboina and Eluru [7].
Home appliances and equipment also have an impact on a home’s energy consumption pattern. Iraganaboina and Eluru [7] have found that homes with more appliances are prone to higher energy consumption. Additionally, previous research debated the impact of Energy Star appliances on a home’s energy consumption and identified significant results only for Energy Start refrigerators [15]. Energy Star is a governmental program that aids consumers to identify more energy-efficient appliances and equipment in the United States [16].
Furthermore, home heating and cooling equipment is known to have the largest impact on energy consumption in a home [17], followed usually by water heating equipment [18]. It is also well known that equipment and fuel choices impact total energy used in a home [17,18].
In terms of renewable energy generated on-site, Iraganaboina and Eluru [7] have found that homes with solar power were likely to have higher electricity use. To this result, Iraganaboina and Eluru [7] provide an interesting explanation based on the use of solar power to offset electricity costs, but have not explored the issue further.
Other factors affecting residential energy consumption include the building’s physical characteristics, such as type, year of construction, and size. Energy consumption is usually higher for single-family homes, mostly due to their larger size [14]. Other research has found building size to have an impact on energy consumption. For example, home size was found to impact energy consumption, which can be linked to its effect on a building’s heating and cooling loads [19]. However, previous research has found this effect to also vary per fuel, with constant increases for gas and decreases for electricity, which can be related to the choice of heating fuel [7]. The effect of size is difficult to measure because it is often correlated with other factors such as family size, room number, and housing type [4]. It is also well known that the average home size has increased in the United States, with an estimated increase of 27.9% between 1980 and 2005 [14]. However, preliminary data from the United States Census indicate a very small decrease in median size for newly sold homes from an all-time high of 2526 square feet (234.67 square meters) in 2014 to 2333 square feet (216.74 square meters) in 2020 [20].
Building age has also been identified by previous research as having a significant effect on a home’s energy consumption [12,21,22,23]. However, a study on the European Union has found that the impact of building age is not linearly related to energy consumption. In that study, older homes (built before 1921) were found to be more energy efficient than the average of all homes, and homes built between 1947 and 1979 were found to be the worst performers [20]. In the United States, Kavousian et al. [19] also verified a reduced energy consumption for homes built before 1975 if compared to homes built between 1993 and 2003, while analyzing close to one thousand American households. They ponder that this could be due to newer homes having appliances that consume more energy, such as air-conditioners [19], which is also suggested by other researchers [12].
Education and income level have been found to impact energy usage. Salari and Javid [23] found that a head of household with a higher education degree is effectively associated with lower energy usage. In a recent study, Debs et al. [24] indicated that energy consumption was significantly influenced by the respondents’ highest educational degree, though the same was not found significant when assessing its influence on the total number of energy star appliances in a home.
Higher income may be associated with having more technology and electronics usage, but it does not contribute to a considerable or statistically significant increase in energy consumption [9,24,25]. In fact, previous research associated higher income with being able to afford more energy-efficient equipment [26]. However, recent research conducted in the United Kingdom indicated that an increase in wealth correlated with higher energy consumption, especially for energy-poorer households [27].
Finally, it is generally accepted that a larger household will use more energy [9,28]. Additionally, individual factors also play a part in energy usage. For example, previous research suggests that gender influences energy consumption, with men using less energy than women [28]. However, recent findings challenge biological differences related to energy consumption and suggest that social gender roles may help explain these differences [29]. Moreover, retirees and those that work from home tend to use more energy than those that work outside of the home [28]; age positively affects energy consumption [30] and those living in the city may utilize services not available to those in rural areas, such as laundry and cooking outside of the house [9].
Residential Energy Consumption Survey (RECS) Overview
The Residential Energy Consumption Survey (RECS) is managed by the United States Energy Information Administration (US EIA) and collects data about the energy consumption of homes across the United States periodically since 1979. It collects not only information about household characteristics, but also behavior, home appliances, climate, and physical characteristics of the house. It includes different types of homes, such as mobile homes, single-family detached and attached homes, as well as apartments in multifamily buildings. The latest iteration of the RECS, here called RECS 2015, evaluates data collected between August 2015 and April 2016 [31].
RECS 2015 surveys, methodology information, microdata, and codebook are publicly available online [32]. For the 2015 survey, “multi-stage area probability random sampling” [31] (p. 8) was used, resulting in 5686 households surveyed. Data collection used a combination of methods, including online and mail surveys, as well as interview procedures. This means the data is based on interviewees’ willingness to participate and give accurate answers. And, in addition to contacting households, RECS also obtained energy information from energy suppliers. It is also important to note that for several questions in RECS, invalid or missing data were imputed using statistical modeling. Data imputation was used for approximately two-thirds of the surveyed homes in RECS 2015 [30].
Several previous researchers have used RECS datasets to explore several energy-related topics. Among those, are the studies by Hojjati and Wade [14], who analyzed RECS data from 1980 to 2005; Sanquist et al. [9], who used the 2001 and 2005 iterations to evaluate electricity consumption; Steemers and Yun [12], who evaluated 2001 RECS data for heating and cooling energy consumptions; Estiri [4], who used the 2009 RECS data to evaluated factors contributing to the energy consumption of American homes; and, more recently, work by Karatasou and Santamouris [8] and by Iraganaboina and Eluru [7] used the 2015 RECS dataset. Karatasou and Santamouris [8] focused on the impact of socio-economic variables on energy consumption, and Iraganaboina and Eluru [7] provided a broad analysis of household composition, size, and characteristics, as well as the type of fuels consumed by residences in the United States.
3. Materials and Methods
The present study uses descriptive statistics and inferential statistics to evaluate how certain factors contribute to the energy consumption in a home. The factors selected for analysis were briefly discussed in the background literature of the present paper and relate to physical characteristics of the home (home size and year built), household composition (education, income, and the number of household members), and home equipment (space heating type, air conditioning type, water heater type and use of on-site generation of solar power).
Our analysis is also delimited to single-family owned homes, given that most homeowners are responsible for their home and appliances maintenance and energy costs. Single-family detached homes were chosen because they account for approximately 63.91% of the housing stock in the United States in 2019 [33], and their consumption characteristics can significantly differ from other types of housing [4,34,35]. This resulted in a sample size of n = 3288 homes from the 2015 RECS dataset. Furthermore, as mentioned previously, the RECS survey includes data imputed using statistical modeling and this imputed data was the one utilized in the present study.
First, descriptive statistics are presented. These include frequency of categorial factors’ levels per climate zone and median, mean and standard deviation for home size, and the number of household members. Additionally, descriptive statistics of fuel type of heating and cooling equipment and water heating equipment are included. The goal of the descriptive analysis results is to give an overview of the data to be further analyzed by the inferential statistics.
Then, for inferential statistics, we started by performing an analysis of variance (ANOVA) to evaluate differences in total BTU consumed per climate region, followed by five regression models—one for each Building America climate zone. This removes the need to include heat and cooling degree days as factors, but still controls for climate variation. This also allows results to be grouped geographically, which can help with policy decisions. RECS 2015 includes information about a home’s climate using both Building America climate zones and the International Energy Conservation Code (IECC) Climate Code. The choice to use Building America climate zones was made to reach a balance between a reasonable number of models to compare (five), in comparison to eleven if using the IECC zones. Building America climate zones were elaborated by Department of Energy (DOE) researchers and are based on simplifying the IECC climate zones [10].
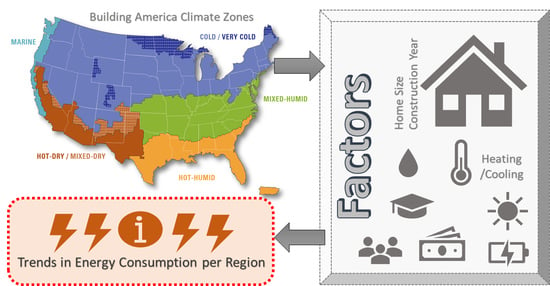
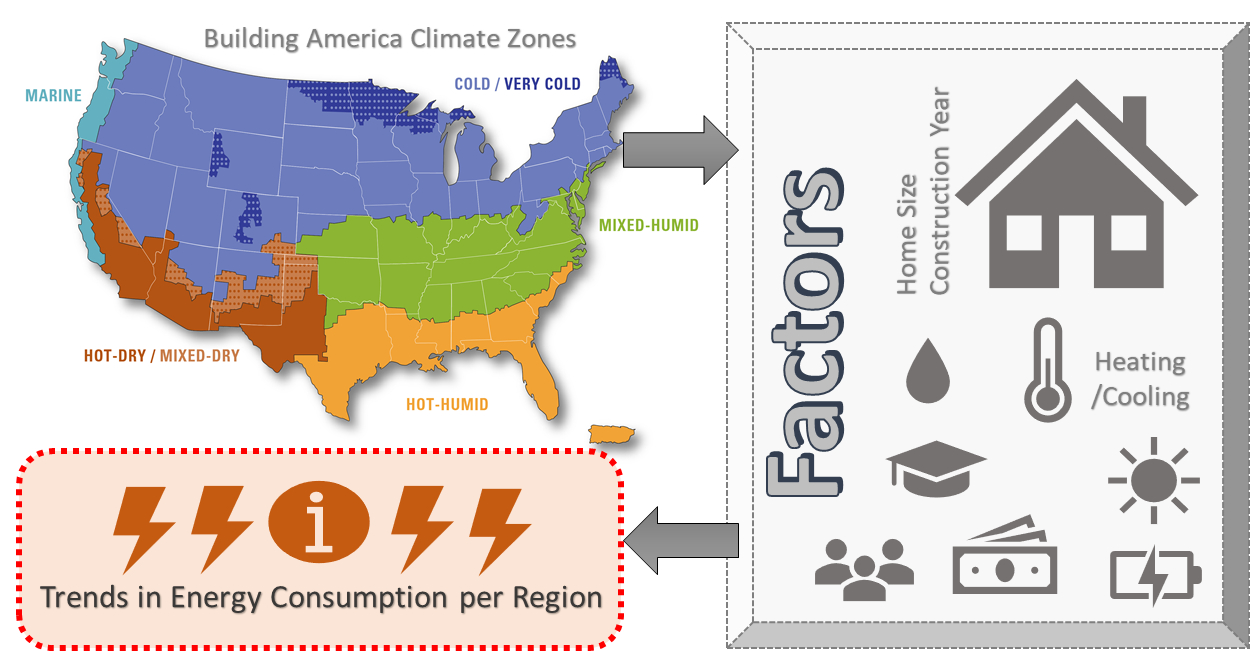
Total energy consumption in this paper will be measured in BTU and accounts for energy used in a home from gas, electricity, propane, and fuel oil (or kerosene) sources. It does not include wood as a fuel source. Factors included in the multiple regression model are based on previous research and consider physical characteristics of the home, household characteristics, and home equipment. Figure 1 illustrates the conceptual framework of the proposed model.
We also note that data from RECS for income and year built is presented as categorical. For income, data is collected in brackets of approximately $20,000 to $139,999, the following bracket includes incomes of $140,000 or more. For the year built, data is presented in decades except for the first (for homes built before 1950) and the last bracket (for homes built 2010 to 2015). Because of the ordinal nature and reasonable spacing of most brackets of the categories in income and year built, both variables were treated as continuous in the regression model. This also simplifies the interpretation of the regression results [36]. Other variables in the model considered as continuous were the size of the home and the number of family members. All other variables are categorical and include education, type of heating equipment, type of air-conditioning equipment, type of water heating equipment, and on-site power generation from solar. Our working model for each Building America climate zone is represented by Equation (1):
where:
YTOTALBTU = Intercept + β1-SIZE + β2-YEAR + β3-EDUCATION + β4-INCOME + β5-MEMBERS + β6-HEATTYPE + β7-ACTYPE + β8-WATERTYPE + β9-SOLAR
- TOTALBTU = total energy consumption in thousand BTU (does not include wood),
- SIZE = total heated square footage of home (continuous variable),
- YEAR = year range a home was built (categorical, treated as a continuous variable),
- EDUCATION = highest degree of education of respondent (categorical variable),
- INCOME = household income (range) in 2014 (categorical, treated as a continuous variable),
- MEMBERS = number of household members (discrete, treated as a continuous variable),
- HEATTYPE = type of primary space heating equipment used in the home (categorical variable),
- ACTYPE = type of primary air conditioning equipment used in the home (categorical variable),
- WATERTYPE = type of primary water heater type used in the home (categorical variable),
- SOLAR = existence of on-site solar energy generation (categorical variable).
Though appliances are found to influence a home’s energy consumption [15], information about them was not included in the model because certain appliances did not apply to all respondents. Additionally, respondents could refuse to answer or indicate they “do not know” the answer to the question, making interpretation of responses too complicated and outside of the scope of the present research.
Regression models were evaluated using an automated backward stepwise approach in R Studio. The resulting model was additionally manually reviewed by researchers to remove any non-significant factors (α = 0.05) also using a backward, stepwise approach.
4. Results
This section presents our results for the study. First, we present descriptive statistics related to the main factors utilized in the analysis. Following this, we present the results of our multiple regression analysis.
4.1. Descriptive Statistics
In this section, descriptive statistics focus on the factors included in our proposed conceptual framework, as well as fuel type for heating and cooling equipment and water heater fuel type. It considers only the data for our delimited sample of single-family, detached, and owned homes in the United States while providing estimates per Building America climate regions.
Climate. The distribution of homes per climate zone can be seen in Figure 2. Climate distribution for the sample indicated it included more homes built in the Cold/Very Cold climate zone (n = 37.41%), followed by Mixed-Humid (n = 25.85%), Hot-Humid (n = 17.61%), Hot-Dry/Mixed-Dry (n = 11.10%) and Marine (n = 8.03%). This distribution is expected, given the surface area coverage of each of the respective Building America climate regions analyzed.
Physical characteristics. The median house size in the sample was 2400 square feet with a standard deviation of 1284.5 square feet (119.33 square meters) (Table 1). Median size also varied by region, with Cold/Very Cold climate homes being larger and hot-humid homes being usually smaller. However, the standard deviation (SD) was considerably high (larger than 1000 square feet/92.9 square meters) for all regions.
Additionally, Figure 3 shows the relationship between home square footage and total energy consumption. Different colors and different shapes illustrate the data for each climate zone, as well as linear trendlines for each region. The graph shows that most houses are within 1000 square feet (92.9 square meters) and 4000 square feet (371.6 square meters), and the energy consumption is within 50 million and 125 million BTU (52.72 and 131.88 GJ). The spread of the data is larger for home size than for total energy consumption, but there are a few outliers.
The distribution of building age was fairly stable, with more homes being built between 2000 and 2009 (n = 16.8%) and before 1950 (n = 15.5%). The decades in between these two categories comprise between 10.2% (from 1960 to 1969) and 14.8% (between 1970 and 1979); homes built between 2010 and 2015 comprised the smallest percentage (n = 3.7%). Specific information for building age per climate region can be seen in Figure 4.
Household characteristics. In terms of household education, about 32.8% of respondents indicated they had a college or an associate’s degree, followed by an almost equal distribution of respondents with a high-school diploma or GED (n = 22.3%) and bachelor’s degree (n = 22.1%); 17.8% of respondents had some sort of graduate degree, and only 5% had less than a high-school diploma or GED. This distribution seems to be similar for every region, as can be seen in Figure 5. We note that this question only asked for the respondent’s highest educational degree and does not include information about the educational degrees of all household members.
When asked about the income of the previous year (2014), the median answer indicated an income between $20,000 and $39,999 for their annual gross household income, with 18.8% of respondents indicating to fit that income bracket. Income seems to vary per region and Figure 6 shows the breakdown per income bracket for each Building America climate region. Hot-Dry/Mixed-Dry and Marine regions seem to have a more balanced sample across brackets than other regions.
In general, each household contained a minimum of one and a maximum of 11 members, with a mean of 2.69 people per household and a standard deviation of 1.396. In the case of household members, the median was 2 people per household for all regions. The mean number of people varied from a low of 2.60 in the Hot-Humid region to a high of 2.79 in the Hot-Dry/Mixed-Dry region. Figure 7 shows a box plot representation for the number of household members in each surveyed climate region and indicates a higher variability in the Marine, Mixed-Humid, and Hot-Dry/Mixed Dry regions, in which most homes house two to four people than Hot-Humid and Cold/Very Cold regions, in which most homes have two to three people only.
Equipment. In general, most of the surveyed homes utilized a central furnace as their main heating equipment (n = 65.9%), followed by heat pump (n = 14.8%). The remainder of the homes used other sources of heat (n = 17%) or heating was not applicable (n = 2.3%). When further analyzing equipment type per region, a central furnace is still the main type of equipment used, however, we can see heat pumps are proportionally more common in Hot-Humid, Mixed-Humid and Marine, than Cold/Very Cold and Hot-Dry/Mixed-Dry climates (see Figure 8).
For main heating equipment fuel, most homes used natural gas from underground pipes (n = 54.6%), followed by electricity (n = 27.6%). Other fuels accounted for 15.5% of surveyed homes. For 2.3% of homes, heating fuel was not applicable. In all climate regions, electricity and piped natural gas were found to be the most prevalent fuels for main heating equipment in homes, but fuel oil/kerosene was found in almost as many homes as electricity for homes in the Cold/Very Cold climate. The breakdown can be seen in Table 2.
For air conditioning, most homes used a central air conditioning system (n = 69%), followed by individual window or wall, or portable units (n = 14.2%), and both a centralized system and individual units (n = 5.6%); for 11.6% of homes, air conditioning type was not applicable. When further analyzing per climate zone (Figure 9), we note a similar prevalence of central air-conditioning systems in all regions, except Marine. In the Marine climate zone, central air conditioning systems (n = 102) are almost as prevalent as not having air conditioning (n = 106).
For water heaters, almost half of the homes used a medium storage-tank water heater (n = 48.7%), followed by water heaters with large storage tanks of 50 gallons (189.27 liters) or more (n = 38.2%). Small storage tank water heaters accounted for only 9.2% of the surveyed homes, and only 4% of homes had a tankless or on-demand water heater. This is similar to what is found in all regions, as can be seen in Figure 10. The two main fuel types used in water heaters were natural gas from underground pipes (n = 50.7%) and electricity (n = 41.2%), accounting for the vast majority of surveyed homes. When further analyzing per climate zone, results indicate that in all regions electricity and natural gas are the most prevalent fuel for water heating equipment. However, in Hot-Dry/Mixed-Dry regions, natural gas (n = 74.8%) is much more frequently used than electricity (n = 19.2%); this is similar for Cold/Very Cold regions, though with slightly lesser difference (natural gas n = 57.5% and electricity n = 30.9%). Only in Hot-Humid climate zones do homes seem to use electricity (n = 62.9%) for heating water more frequently than natural gas (n = 33.9%).
Finally, when assessing the existence of on-site solar energy generation, we found that very few homes from the sample have this feature. For all climate zones, only 78 homes had on-site electricity generation from solar. Of those 78 homes, the region with most homes with solar power generation on-site was Hot-Dry/Mixed-Dry region (n = 30), followed by Cold/Very Cold (n = 15), Mixed-Humid (n = 13), Marine (n = 12) and Hot-Humid (n = 8).
4.2. Multiple Regression Analysis Results
First, a log transformation for total BTU was performed to improve the fit of residuals for every region. We note that for the Cold/Very Cold climate zone a quadratic transformation would yield a better model fit, but to standardize the procedures across the climate zones, a log transformation for total BTU was used in that region as well.
Second, a one-way ANOVA was run to evaluate differences in energy consumption between regions. The results indicate that we can reject the null hypothesis that all regions consume energy equally (F = 168.315, p-value < 0.001). Additionally, a box plot of LogBTU per climate region is presented in Figure 11 to help visualize results. A Tukey comparison between regions indicates that the five regions can be grouped into three main groups of total energy consumption—(1) Cold/Very Cold, (2) Mixed-Humid, and (3) remaining regions (Hot-Dry/Mixed-Dry, Hot-Humid, and Marine). We note that even though homes of some of the regions might have similar total energy consumption, we cannot assess if the distribution of that consumption—meaning how energy is spent in the home—is similar.
Five multiple regression models were then run for the present study—one for each Building America climate region. Equation (1), included in Section 3 (Methodology) represented the initial regression model. Final models vary per region, and Table 3 summarizes the parameter estimates in each of the factors. For factors treated as categorical, parameter estimates are included per level, if the factor was found significant at the 0.05 level. Size, year built, income, and the number of family members were treated as continuous variables. We note that the model did not present a significant result for education or type of water heater in any of the regions, therefore these factors were removed from Table 3 and Equation (2), which represents the revised model equation, which can still differ per climate region:
YLOG_TOTALBTU = Intercept + β1-SIZE + β2-YEAR + β4-INCOME + β5-MEMBERS + β6-HEATTYPE + β7-ACTYPE + β9-SOLAR.
The goodness of fit can be evaluated by the adjusted R-square value for each resulting model and varied from 0.2953 (Hot-Dry/Mixed-Dry region) to 0.4459 (Mixed-Humid region). We also note that even though a wood-burning fireplace or stove is included as a level of type of heating equipment, the wood consumption is not included in a home’s total BTU usage in RECS and this information needs to be considered when analyzing homes that use this type of fuel.
Cold and Very Cold Climate. This zone covers a large area of the United States. For this region, the reduced model contained all the revised Equation (2) variables, except for solar energy. The variable that had the largest single-increment impact on the total BTU consumed by a household was type of heating equipment. This was compared to a baseline of “not applicable” heating equipment, which was only found in one home of this region. For the homes that had applicable heating equipment, a central furnace and some other equipment were found to very similarly contribute to the energy consumption of the home, while heat pumps consumed less. Furthermore, in this climate newer homes were found to significantly consume less energy, though the amount reduced per decade younger is small (β2 = −0.0293). Contributions of the number of household members and income were found to also have small, though statistically significant increments. Based on the findings, the researchers evaluated Spearman correlations between the four variables treated as continuous, namely, year built, number of household members, income, and home size as seen in Table 4. All correlations were significant at the α = 0.01 level. However, we note that all correlations were weak (0.1 < ρ < 0.4), or very weak, in the case of the number of household members and year built (ρ = 0.096). The associations between income and number of household members (ρ = 0.337) and income and home size (ρ = 0.352), despite weak, were higher than the other correlations coefficients. We also note that, even though a small parameter estimate was found for the contribution of total square footage (β1 = 0.0106), the median home size in this region is 2700 square feet (251 square meters), making size the second largest contributor to total energy consumption for a median-sized home in Cold and Very Cold Climate, after heating equipment.
Hot-Dry and Mixed-Dry Climate. This climate is found mainly in the southwest of the United States. For this region, the reduced model contained all the revised Equation (2) variables, except for solar energy and year built. And, similarly to the Very Cold and Cold climate zones, the variable that had the largest single-increment impact on the total BTU consumed by a household was the type of heating equipment, again compared to a baseline of “not applicable” heating equipment, which was found in 32 homes of this region. For the homes that had applicable heating equipment, a central furnace and some other equipment were found to very similarly contribute to the energy consumption of the home, while heat pumps were found to consume the least energy of the distinct types of heating equipment. Contributions of income were found to be small, compared to the number of family members. Our Spearman correlation analysis between the variables treated as continuous showed significance for all correlations, with the exceptions of the number of household members and year home was built, and income and year built, as seen in Table 5. Even when correlation was determined to be significant, all were considered weak. Interestingly, here the largest correlation coefficient was for the association between home size and year built (ρ = 0.373). In this region, the median size of homes is also considerably less than those in Cold and Very Cold climate (x̃ = 2116). Considering the contribution of total square footage (β1 = 0.01052), size was found to be the largest contributor to total energy consumption for a median-sized home (2116 square feet/197 square meters) that did not use a central furnace or some other type of heating equipment in the Hot-Dry and Mixed-Dry climate. For homes with a central furnace—the most frequent type of heating equipment in this region—or some other heating equipment, heating equipment was the largest contributor to energy usage in this climate, followed by home size. Finally, central air conditioning systems in this region have a higher contribution to the total energy consumed in the home, compared to other types of air conditioning systems for this factor. In fact, central air conditioning in Hot-Dry and Mixed-Dry climate are an important factor in the total energy consumed in these homes, given that it is the most frequent type of air-conditioning system used in this climate (see Figure 7).
Hot-Humid Climate. This climate is found in the southeast of the United States. For this region, the reduced model contained all the revised Equation (2) variables, except for solar energy and air conditioning. Newer homes in this climate tend to consume less energy (β2 = −0.0485). Similarly to the previously analyzed climate zones, the variable that had the largest single-increment impact on the total BTU consumed by a household was type of heating equipment. Thirty homes had “not applicable” heating equipment in this region. For the homes that had applicable heating equipment, central furnaces consumed more energy, followed by some other equipment, and then heat pumps. Homes with a fireplace or wood-burning stove were found to contribute negatively to the increment of energy consumed. The authors note that wood was not included in the total energy estimate used in the models. Only 11 houses using one of these equipment types were found in this climate zone. In this climate region, all but one of the Spearman correlations analyzed were found to be significant, as presented in Table 6. All significant correlations were found to be weak, with the associations between income and year built (ρ = 0.349), home size and year built (ρ = 0.324), and income and home size (ρ = 0.378) presenting the largest coefficient values. In this region, the median size of homes is 1904 square feet (177 square meters). Therefore, considering the contribution of total square footage (β1 = 0.01497), size is the largest contributor to total energy consumption for a median-sized home in this climate, ahead of heating equipment, including central furnace, which is still the most frequent heating equipment used in homes in this climate zone.
Marine Climate. This climate is found along the west coast of the United States. For this region, the reduced model contained all Equation (2) variables, except for year built and income. This climate was the only one in which solar energy generation on-site was significant, however, it was found to have a positive contribution to the total energy consumption of the home. Similarly to the previously analyzed climate zones, the variable that had the largest single-increment impact on the total BTU consumed by a household was type of heating equipment. Heating equipment was “not applicable” for only 10 homes in this region. For the homes that had applicable heating equipment, a central furnace and some other equipment consumed more energy, followed by heat pumps. The number of family members had a small contribution to the total energy consumed in homes (β5 = 0.05041). The Spearman correlation analysis for this region indicated significance in only three associations (see Table 7): between income and the number of household members, between size and year built, and size and income. Of those, the largest correlation coefficient was found between income and number of household members (ρ = 0.334). In this region, the median size of homes is very similar to what was found in the Hot-Humid region and is equal to 1949 square feet (181 square meters). Interestingly, in this case, size was not found to be one of the largest contributors to energy use in a median-sized home, contributing less than most heating equipment, solar power, and at least one of the cooling equipment options.
Mixed-Humid Climate. This climate is found in the lower half-east of the United States, in between the Hot-Humid and Cold/Very Cold and Hot-Humid climates. For this region, the reduced model contained all the original variables, except for solar energy. Year built was the only variable to negatively contribute to the total energy consumption in homes. Similarly to other climate zones, the variable that had the largest single-increment impact on the total BTU consumed by a household was type of heating equipment. Heating equipment was “not applicable” for only one home in this. For the homes that had applicable heating equipment, a central furnace and some other equipment were found to very similarly contribute to the energy consumption of the home, while heat pumps consumed less. Contributions of income and the number of family members were found to be fairly similar. Similar to the Cold and Very Cold climate region, the Spearman correlation analysis for this climate region showed significance at the α = 0.01 level for all relations shown in Table 8. However, differently than all other regions, the relationship between income and home size in the Mixed-Humid climate was found to be moderate (ρ = 0.457), followed by a weak correlation between income and number of household members (ρ = 0.368). Additionally, for this region, individual window/wall or portable units contributed less than central air conditioning systems, which in turn contributed less than both a central and individual unit to the total BTU consumed in a home. In this region, the median size of homes is 2519 square feet (234 square meters), which is second only to the median home size in Cold and Very Cold climate region. Considering the contribution of total square footage (β1 = 0.00868), similarly to Cold and Very Cold climate region, size is the second largest contributor to total energy consumption for a median-sized home in the Hot-Dry and Mixed-Dry climate.
5. Discussion
Even though energy consumption patterns can be affected by several different factors, resulting in a complex analysis [8], the ability to analyze data per Building America climate regions has provided some interesting discussion topics. For example, the use of solar power did not appear to be a significant factor in four of the five analyzed regions. This factor was only found to be relevant in the marine region, though only 12 of the 264 homes surveyed in this climate had this feature. When the existence of solar power was a relevant factor, it was found to positively contribute to a household’s energy consumption—a finding that can be related to Iraganaboina and Eluru [7] who analyzed the same dataset while controlling it per fuel type and used all types of housing units and found that energy consumption in homes that had solar power tended to be higher than homes without solar power. This finding might be due to the marine region including a portion of the state of California, whose residential solar power market is considered more mature than other states [37] and retail energy costs are among the higher in the United States [38]. However, we note that RECS data is not separated by state, but only by census division, therefore this should be further researched. Furthermore, included in the analyzed marine climate region are some of the largest technology-focused metropolitan areas in the United States, including San Francisco, San Jose, and Seattle [39]. This is relevant when considering that previous research [40] suggests that residential solar power generation is linked to behavioral factors. Specifically, consumers that are more innovation-driven and have stronger pro-environment beliefs are more likely to be interested in residential solar photovoltaic panels [40]. Future research on building, household, and home equipment characteristics specific to homes with on-site solar power generation could help clarify this matter.
Additionally, we verified that size was a large contributor to the total energy consumed in a home in most regions. For three of five regions, it was found to frequently be the second largest contributing factor to total energy consumption for median-sized homes. In those regions, heating equipment was the largest contributor to total energy consumption, which concurs with the United States Energy Information Administration [41] information on different contributors to a home’s end-use energy consumption. In one region—Hot-Humid climate—size was seen as the largest contributor, and this is probably due to the reduction in the use of heating. Other studies have also assessed the contribution of home size (sometimes total home square foot, such as Estiri [4], and Iraganaboina and Eluru [7]; and other times only heated square footage, such as Karatasou and Santamouris [8]) and indicated that a larger home size positively contributes to total energy consumption in a home.
Our findings also concur with previous research, in that weather and the home’s physical characteristics (and equipment) contribute more to its total energy consumption than household characteristics [4,19]. However, previous researchers [4,12] also warn about interactions between households’ and buildings’ characteristics. In our case, we only assessed correlations between year built, size, income, and the number of family members, which in most regions resulted in significant, but weak correlations. Moderate and significant correlation between income and home size was only found for the Mixed-Humid climate. This shows the need for more in-depth, regional analysis to guide local policymaking; and it suggests the need to further educate people on energy-efficient home options, as also suggested by Estiri [4] especially for homes in the Mixed-Humid climate.
Finally, education and water heaters were not found to be significant factors in the analysis for any of the regions. This is interesting and contradicts recent findings related to the influence of education in a home’s energy consumption by Debs et al. [24] on the same dataset (though analysis was not controlled by climate zone) as well as Salari and Javid [22], who used a combination of United States EIA data for energy consumption and American Community Survey (ACS) for demographic data and have analyzed the results at the state level. Our findings seem to be more aligned with an indirect effect of household socio-economic characteristics on total energy consumption, as proposed by Karatasour and Santamouris [8]. However, we caution interpretation of this factor, given that RECS does not ask about the educational level of all household members, but just the highest education completed by the respondent of the survey, therefore the influence of education as measured in this dataset may be incomplete.
6. Conclusions
The present study has analyzed factors influencing the total energy consumption in single-family homes in the United States using data from the 2015 RECS and controlling by Building America climate zones. We have originally analyzed the impact of nine factors: total home size, year built, respondent’s education, annual household gross income, number of household members, type of heating equipment, type of air conditioning equipment, type of water heater equipment, and the existence of on-site solar power generation. Our results indicate that education and water heater type are not significantly associated with total energy consumed in a home in any of the studied climate regions. In most regions, heating equipment type was the largest contributor to the total energy consumed in a median-sized home, followed by home size.
In the Hot-Humid zone, size was the largest contributor to the total energy consumed in a median-sized home. Additionally, in the Mixed-Humid climate, income and total square footage were positively and moderately correlated. These findings, and the fact that home size is a large contributor to the total energy consumption in a median-sized home in most climate regions suggest that policies and programs aiming to educate households into more energy-efficient options for home configurations could help reduce total energy consumption in at least one climate region. Additionally, the findings can be helpful to encourage conversations among built-environment professionals and how they can guide clients into choosing more energy-efficient home equipment and space configurations.
Furthermore, the direct effect of social-economic factors, such as income and number of household members was small, but other researchers indicate the indirect influence of those factors. Interestingly also, on-site solar power generation was not found to be significant in most regions, and when it was, it was positively associated with total energy consumption. This information is relevant because many states have incentives for the use of on-site solar power in homes, such as Arizona, California, and New York. Even though on-site solar power in homes is helpful to reduce the impact of grid dependency, it cannot be seen as a strategy to reduce total energy consumption because many of the homes are usually still connected to the electrical grid.
Further research could explore a similar analysis using other housing configurations, as well as for rental units to explore factors that can be considered significant to a home’s energy consumption and, therefore, help guide policy and incentives. Other suggestions for further exploration are (1) to continue to study the relationship between households’ socioeconomic status and a home’s physical characteristics and equipment choice, (2) to perform a historical investigation of trends to further understand the evolution of home physical characteristics, appliances and equipment use and its impact in energy consumption, (3) to compare building, household and equipment characteristics of homes with on-site solar power generation in different climate regions, and (4) to compare the models developed in the present research with actual data from buildings in each of the climate regions, taking into account typical envelope features, such as building orientation, window areas, and materials’ thermal transmittances, among others.
Author Contributions
Conceptualization, L.D. and J.M.; formal analysis, L.D.; investigation, L.D. and J.M.; methodology, L.D. and J.M.; visualization, L.D.; writing—original draft, L.D. and J.M.; writing—review & editing, L.D. and J.M. All authors have read and agreed to the published version of the manuscript.
Funding
This research received no external funding.
Institutional Review Board Statement
Not applicable.
Informed Consent Statement
Not applicable.
Data Availability Statement
Publicly available datasets were analyzed in this study. The data can be found inn United States Energy Information Administration, 2015 Residential Energy Consumption Survey (RECS) microdata webpage here: https://www.eia.gov/consumption/residential/data/2015/index.php?view=microdata (accessed on 1 July 2021).
Conflicts of Interest
The authors declare no conflict of interest.
References
- US EIA. Energy Consumption by Sector. In Monthly Energy Review; July 2021. Available online: https://www.eia.gov/totalenergy/data/monthly/pdf/sec2.pdf (accessed on 20 August 2021).
- US EIA. Despite More People Staying at Home, U.S. Residential Use Fell 4% in 2020. May 2021. Available online: https://www.eia.gov/todayinenergy/detail.php?id=47976 (accessed on 20 August 2021).
- United Nations. Transforming Our World: The 2030 Agenda for Sustainable Development. 2015. Available online: https://sdgs.un.org/publications/transforming-our-world-2030-agenda-sustainable-development-17981 (accessed on 6 October 2021).
- Estiri, H. Building and household X-factors and energy consumption at the residential sector: A structural equation analysis of the effects of household and building characteristics on the annual energy consumption of US residential buildings. Energy Econ. 2014, 43, 178–184. [Google Scholar] [CrossRef]
- Fikru, M.G.; Gautier, L. The impact of weather variation on energy consumption in residential houses. Appl. Energy 2015, 144, 19–30. [Google Scholar] [CrossRef]
- Hirst, E.; Goeltz, R.; Carney, J. Residential energy use: Analysis of disaggregate data. Energy Econ. 1982, 4, 74–82. [Google Scholar] [CrossRef]
- Iraganaboina, N.C.; Eluru, N. An examination of factors affecting residential energy consumption using a multiple discrete continuous approach. Energy Build. 2021, 240, 110934. [Google Scholar] [CrossRef]
- Karatasou, S.; Santamouris, M. Socio-economic status and residential energy consumption: A latent variable approach. Energy Build. 2019, 198, 100–105. [Google Scholar] [CrossRef]
- Sanquist, T.F.; Orr, H.; Shi, B.; Bittner, A.C. Lifestyle factors in U.S. residential electricity consumption. Energy Policy 2012, 42, 354–364. [Google Scholar] [CrossRef]
- Baechler, M.; Gilbride, T.L.; Cole, P.C.; Hefty, M.G.; Ruiz, K. High-Performance Home Technologies: Guide to Determining Climate Regions by County; Building America Best Practices Series; Pacific Northwest National Laboratory, U. S. Department of Energy (DOE)—Building Technologies Office, 2015; Volume 7.3. Available online: https://www.energy.gov/sites/prod/files/2015/10/f27/ba_climate_region_guide_7.3.pdf (accessed on 18 November 2021).
- Jones, R.V.; Fuertes, A.; Lomas, K.J. The socio-economic, dwelling and appliance related factors affecting electricity consumption in domestic buildings. Renew. Sustain. Energy Rev. 2015, 43, 901–917. [Google Scholar] [CrossRef] [Green Version]
- Steemers, K.; Yun, G.Y. Household energy consumption: A study of the role of occupants. Build. Res. Inf. 2009, 37, 625–637. [Google Scholar] [CrossRef]
- Delzendeh, E.; Wu, S.; Lee, A.; Zhou, Y. The impact of occupants’ behaviours on building energy analysis: A research review. Renew. Sustain. Energy Rev. 2017, 80, 1061–1071. [Google Scholar] [CrossRef]
- Hojjati, B.; Wade, S.H. US household energy consumption and intensity trends: A decomposition approach. Energy Policy 2012, 48, 304–314. [Google Scholar] [CrossRef]
- Ohler, A.M.; Loomis, D.G.; Ilves, K. A study of electricity savings from energy star appliances using household survey data. Energy Policy 2020, 144, 111607. [Google Scholar] [CrossRef]
- US Environmental Protection Agency (EPA). About Energy Star—2020. Available online: https://www.energystar.gov/sites/default/files/asset/document/2021%20About%20ENERGY%20STAR%20Overview%204.12.21%20v1.pdf (accessed on 6 October 2021).
- Shah, V.P.; Debella, D.C.; Ries, R.J. Life cycle assessment of residential heating and cooling systems in four regions in the United States. Energy Build. 2008, 40, 503–513. [Google Scholar] [CrossRef]
- Maguire, J.; Fang, X.; Wilson, E. Comparison of Advanced Residential Water Heating Technologies in the United States (No. NREL/TP-5500-55475); National Renewable Energy Lab (NREL): Golden, CO, USA, 2013.
- Kavousian, A.; Rajagopal, R.; Fischer, M. Determinants of residential electricity consumption: Using smart meter data to examine the effect of climate, building characteristics, appliance stock, and occupants’ behavior. Energy 2013, 55, 184–194. [Google Scholar] [CrossRef]
- U.S. Census. New Single-Family Homes in 2020. Available online: https://www.census.gov/construction/chars/xls/squarefeet_cust.xls (accessed on 3 September 2021).
- Aksoezen, M.; Daniel, M.; Hassler, U.; Kohler, N. Building age as an indicator for energy consumption. Energy Build. 2015, 87, 74–86. [Google Scholar] [CrossRef]
- Salari, M.; Javid, R.J. Residential energy demand in the United States: Analysis using static and dynamic approaches. Energy Policy 2016, 98, 637–649. [Google Scholar] [CrossRef]
- Salari, M.; Javid, R.J. Modeling household energy expenditure in the United States. Renew. Sustain. Energy Rev. 2017, 69, 822–832. [Google Scholar] [CrossRef]
- Debs, L.; Kota, B.R.; Metzinger, J. Recent Energy Consumption Trends in American Homes. In Proceedings of the Associated Schools of Construction 57th Annual International Conference (Virtual), California State University, Chico, CA, USA, 5–9 April 2021. [Google Scholar]
- Juarex, D.A.; Walke, A.D. Residential electricity consumption in Seattle. Energy Econ. 2012, 34, 1693–1699. [Google Scholar]
- Bhattacharjee, S.; Reichard, G. Socio-economic factors affecting individual household energy consumption: A systematic review. In Proceedings of the ASME 2011 5th International Conference on Energy Sustainability, Washington, DC, USA, 7–10 August 2011. [Google Scholar]
- Bao, H.X.; Li, S.H. Housing wealth and residential energy consumption. Energy Policy 2020, 143, 111581. [Google Scholar] [CrossRef]
- Fong, W.K.; Matsumoto, H.; Lun, Y.F.; Kimura, R. Influences of Indirect Lifestyle aspects and climate on household energy consumption. J. Asian Archit. Build. Eng. 2018, 6, 395–402. [Google Scholar] [CrossRef]
- Grünewald, P.; Diakonova, M. Societal differences, activities, and performance: Examining the role of gender in electricity demand in the United Kingdom. Energy Res. Soc. Sci. 2020, 69, 101719. [Google Scholar] [CrossRef]
- Estiri, H.; Zagheni, E. Age matters: Ageing and household energy demand in the United States. Energy Res. Soc. Sci. 2019, 55, 62–70. [Google Scholar] [CrossRef]
- US EIA. 2015 RECS Household Characteristics Technical Documentation Summary (Webpage). Available online: https://www.eia.gov/consumption/residential/reports/2015/methodology/index.php (accessed on 13 July 2021).
- US EIA. 2015 RECS Survey Data. Microdata. Available online: https://www.eia.gov/consumption/residential/data/2015/index.php?view=microdata (accessed on 18 November 2021).
- US Census Bureau. American Housing Survey 2019 [Summary Tables]. 2020. Available online: https://www.census.gov/programs-surveys/ahs/data.html (accessed on 15 July 2021).
- Estiri, H.; Gabriel, R.; Howard, E.; Wang, L. Different Regions, Differences in Energy Consumption: Do Regions Account for the Variability in Household Energy Consumption; Working Paper, 134; Center for Statistics and the Social Sciences University of Washington: Seattle, WA, USA, 2013; Available online: https://csss.uw.edu/files/working-papers/2013/wp134.pdf (accessed on 23 September 2021).
- Kaza, N. Understanding the spectrum of residential energy consumption: A quantile regression approach. Energy Policy 2010, 38, 6574–6585. [Google Scholar] [CrossRef]
- Pasta, D.J. Learning when to be discrete: Continuous vs. categorical predictors. In Proceedings of the SAS Global Forum, Washington, DC, USA, 22–25 March 2009; Available online: https://support.sas.com/resources/papers/proceedings09/248-2009.pdf (accessed on 29 December 2021).
- Bao, Q.; Sinitskaya, E.; Gomez, K.J.; MacDonald, E.F.; Yang, M.C. A human-centered design approach to evaluating factors in residential solar PV adoption: A survey of homeowners in California and Massachusetts. Renew. Energy 2020, 151, 503–513. [Google Scholar] [CrossRef]
- US EIA. State Electricity Profiles (Data for 2020). November 2021. Available online: https://www.eia.gov/electricity/state/ (accessed on 29 December 2021).
- Atkinson, R.; Muro, M.; Whiton, J. The Case for Growth Centers; Brookings Institution: Washington, DC, USA, 2019; Available online: https://pubs.aeaweb.org/doi/pdfplus/10.1257/jep.34.3.99 (accessed on 29 December 2021).
- Wolske, K.S.; Stern, P.C.; Dietz, T. Explaining interest in adopting residential solar photovoltaic systems in the United States: Toward an integration of behavioral theories. Energy Res. Soc. Sci. 2017, 25, 134–151. [Google Scholar] [CrossRef]
- US EIA. Use of Energy Explained. Energy Use in Homes. June 2021. Available online: https://www.eia.gov/energyexplained/use-of-energy/homes.php (accessed on 6 October 2021).
Figure 1.
Proposed conceptual framework.

Figure 2.
Distribution of homes per Building America climate zone (total n = 3288).

Figure 3.
Box plot for the total square footage of homes per climate region.

Figure 4.
Year the home was built per Building America climate zone (total n = 3288).

Figure 5.
Household respondents’ highest earned degree per climate zone (total n = 3288).

Figure 6.
2014 annual household income brackets per climate zone (total n = 3288).

Figure 7.
Box plot for the number of household members per climate region.

Figure 8.
Type of main space heating equipment per climate zone (total n = 3288).

Figure 9.
Type of main air conditioning equipment per climate zone (total n = 3288).

Figure 10.
Type of water heating equipment per climate zone (total n = 3288).

Figure 11.
Box plot for LogBTU per climate region.


Table 1.
Total square footage (sqft) and square meters (m2) of home per climate zones (total n = 3288).
Table 1.
Total square footage (sqft) and square meters (m2) of home per climate zones (total n = 3288).
| Climate Zone | Frequency | Median | Mean | SD | |||
|---|---|---|---|---|---|---|---|
| sqft | m2 | sqft | m2 | sqft | m2 | ||
| Cold/Very Cold | 1230 | 2700 | 251 | 2889.64 | 268.46 | 1243.78 | 115.55 |
| Hot-Dry/Mixed-Dry | 365 | 2116 | 197 | 2402.85 | 223.23 | 1188.03 | 110.37 |
| Hot-Humid | 579 | 1904 | 177 | 2230.93 | 207.26 | 1130.66 | 105.04 |
| Mixed-Humid | 850 | 2519 | 234 | 2802.66 | 260.38 | 1408.21 | 130.83 |
| Marine | 264 | 1949 | 181 | 2245.54 | 208.62 | 1117.38 | 103.81 |
| Total | 3288 | 2400 | 223 | 2645.40 | 245.77 | 1284.51 | 119.33 |
Table 2.
Fuel used on main heating equipment per climate zones (total n = 3288).
| Fuel Type | Frequency of Homes per Climate Zone | ||||
|---|---|---|---|---|---|
| Cold/Very Cold | Hot-Dry/Mixed-Dry | Hot-Humid | Mixed-Humid | Marine | |
| Not Applicable | 1 | 32 | 30 | 1 | 10 |
| Natural gas (piped) | 808 | 243 | 192 | 425 | 128 |
| Electricity | 132 | 76 | 332 | 278 | 89 |
| Fuel oil/kerosene | 114 | 0 | 1 | 56 | 3 |
| Propane (bottled gas) | 93 | 9 | 15 | 62 | 10 |
| Wood | 76 | 5 | 9 | 28 | 24 |
| Some other fuel | 6 | 0 | 0 | 0 | 0 |
| Total | 1230 | 365 | 579 | 850 | 264 |
Table 3.
Parameter estimates and summary results of regression per region.
| Factors | Climate | ||||
|---|---|---|---|---|---|
| Cold/Very Cold | Hot-Dry/Mixed-Dry | Hot-Humid | Marine | Mixed-Humid | |
| Estimate | 9.066 | 9.991 | 10.36 | 9.899 | 9.843 |
| Size 1 | 0.0106 | 0.01052 | 0.01497 | 0.01108 | 0.00868 |
| Year Built 2 | −0.0293 | NS | −0.0485 | NS | −0.02724 |
| Income 3 | 0.03301 | 0.02964 | 0.04807 | NS | 0.06760 |
| Number Family Members | 0.04976 | 0.06029 | 0.1021 | 0.05041 | 0.05165 |
| Type of Heating Equipment | |||||
| Not applicable | Baseline | Baseline | Baseline | Baseline | Baseline |
| Central Furnace | 1.978 | 0.4007 | 0.2794 | 0.7212 | 1.040 |
| Heat Pump | 1.547 | 0.1440 | 0.07365 | 0.6331 | 0.6779 |
| Wood burning fireplace or stove | 1.422 | 0.0278 | −0.1966 | 0.3597 | 0.3683 |
| Some other equipment | 1.912 | 0.4322 | 0.1649 | 0.7275 | 0.9837 |
| Type of Air-Conditioning | NS | ||||
| Not applicable | Baseline | Baseline | Baseline | Baseline | |
| Central system | 0.1152 | 0.2006 | 0.1617 | 0.1048 | |
| Individual unit(s) | 0.0990 | 0.08995 | 0.1237 | 0.0457 | |
| Central & individual unit(s) | 0.1442 | 0.06971 | 0.4219 | 0.1993 | |
| Solar Energy | NS | NS | NS | NS | |
| Has solar | 0.2367 | ||||
| No solar | Baseline | ||||
| Adjusted R | 0.3359 | 0.2953 | 0.3461 | 0.3102 | 0.4459 |
| p-Value | <0.0001 | <0.0001 | <0.0001 | <0.0001 | <0.0001 |
Notes: Not Significant (NS). 1 in hundred square feet. 2 in decades for homes built after 1950. All homes before 1950 are combined. 3 in $20,000 increments until more than $140,000 per year. Categorical levels are italicized.
Table 4.
Correlation analysis—Cold/Very Cold Climate (Spearman’s ρ).
| Year Built | Number of Household Members | Income | Home Size | |
|---|---|---|---|---|
| Year Built | 1.00 | |||
| Number of Household Members | 0.096 ** | 1.00 | ||
| Income | 0.257 ** | 0.337 ** | 1.00 | |
| Home Size | 0.156 ** | 0.180 ** | 0.352 ** | 1.00 |
Notes: ** Correlation is significant at the 0.01 level.
Table 5.
Correlation analysis—Hot-Dry and Mixed-Dry Climate (Spearman’s ρ).
| Year Built | Number Household Members | Income | Home Size | |
|---|---|---|---|---|
| Year Built | 1.00 | |||
| Number of Household Members | 0.092 | 1.00 | ||
| Income | 0.071 | 0.231 ** | 1.00 | |
| Home Size | 0.373 ** | 0.159 ** | 0.294 ** | 1.00 |
Notes: ** Correlation is significant at the 0.01 level.
Table 6.
Correlation analysis—Hot-Humid Climate (Spearman’s ρ).
| Year Built | Number Household Members | Income | Home Size | |
|---|---|---|---|---|
| Year Built | 1.00 | |||
| Number of Household Members | 0.245 ** | 1.00 | ||
| Income | 0.349 ** | 0.209 ** | 1.00 | |
| Home Size | 0.324 ** | 0.049 | 0.378 ** | 1.00 |
Notes: ** Correlation is significant at the 0.01 level.
Table 7.
Correlation analysis—Marine Climate (Spearman’s ρ).
| Year Built | Number Household Members | Income | Home Size | |
|---|---|---|---|---|
| Year Built | 1.00 | |||
| Number of Household Members | 0.092 | 1.00 | ||
| Income | 0.024 | 0.334 ** | 1.00 | |
| Home Size | 0.183 ** | 0.065 | 0.188 ** | 1.00 |
Notes: ** Correlation is significant at the 0.01 level.
Table 8.
Correlation analysis—Mixed-Humid Climate (Spearman’s ρ).
| Year Built | Number Household Members | Income | Home Size | |
|---|---|---|---|---|
| Year Built | 1.00 | |||
| Number of Household Members | 0.192 ** | 1.00 | ||
| Income | 0.227 ** | 0.368 ** | 1.00 | |
| Home Size | 0.207 ** | 0.160 ** | 0.457 ** | 1.00 |
Notes: ** Correlation is significant at the 0.01 level.
Publisher’s Note: MDPI stays neutral with regard to jurisdictional claims in published maps and institutional affiliations. |
© 2022 by the authors. Licensee MDPI, Basel, Switzerland. This article is an open access article distributed under the terms and conditions of the Creative Commons Attribution (CC BY) license (https://creativecommons.org/licenses/by/4.0/).
Share and Cite
MDPI and ACS Style
Debs, L.; Metzinger, J. A Comparison of Energy Consumption in American Homes by Climate Region. Buildings 2022, 12, 82. https://doi.org/10.3390/buildings12010082
AMA Style
Debs L, Metzinger J. A Comparison of Energy Consumption in American Homes by Climate Region. Buildings. 2022; 12(1):82. https://doi.org/10.3390/buildings12010082
Chicago/Turabian StyleDebs, Luciana, and Jamie Metzinger. 2022. "A Comparison of Energy Consumption in American Homes by Climate Region" Buildings 12, no. 1: 82. https://doi.org/10.3390/buildings12010082
Note that from the first issue of 2016, this journal uses article numbers instead of page numbers. See further details here.