

Evaluating Energy Efficiency and Colorimetric Quality of Electric Light Sources Using Alternative Spectral Sensitivity Functions

Engineering Unit A, Department of Architectural Engineering, Pennsylvania State University, University Park, State College, PA 16802, USA
*
Author to whom correspondence should be addressed.
Buildings 2022, 12(12), 2220; https://doi.org/10.3390/buildings12122220
Submission received: 21 October 2022
/
Revised: 23 November 2022
/
Accepted: 5 December 2022
/
Published: 14 December 2022
(This article belongs to the Section Architectural Design, Urban Science, and Real Estate)
Abstract
:Photometric and colorimetric quantities are calculated using spectral luminous efficiency and color matching functions (CMFs), respectively. Past studies highlighted the limitations of the standard sensitivity functions based on visual experiments conducted over a century ago. There have been new alternatives proposed, but the effect of the proposed alternatives functions on energy efficiency, and the colorimetric quality of light sources has rarely been investigated. It is reasonable to assume that updating photometric and colorimetric calculation procedures will make significant impacts on the characterization of electric light sources. Here, the impact of six luminous efficiency functions and six CMFs on luminous efficacy of radiation and chromaticity calculations were analyzed. Results indicate a significant effect of alternative functions on luminous efficacy of radiation (LER), chromaticity coordinates (CIE 1931 x,y and CIE 1976 u′,v′) and Duv. The biggest impact was caused by the change in the visual field of view (2-degree vs. 10-degree observer), highlighting the importance of visual field size for color and luminosity function. Updating the standardized luminous efficiency function may impact the performance characterization of electric light sources, but cost-benefit analysis should be studied to understand the broad impacts.
1. Introduction
Lighting is a key part of indoor environmental quality and source of energy consumption in the built environment. Electric lighting enables occupants to perform tasks while providing safety and visual comfort. However, the energy consumed by lighting is a critical factor in addressing the growing challenges of climate change [1,2]. Quantifying the color quality and energy efficiency of light sources are paramount for the design, control, and improvement of lighting systems [3]. The energy efficiency of architectural lighting products (luminaires) are traditionally quantified individually by comparing the electricity consumed by the device, and the visible light output emitted from it. The increased energy efficiency often means increased light output at the same consumed electricity input. While the definition of energy efficiency is straightforward, calculating the perception of light by the visual system requires psychophysical modeling.
Human visual sensitivity to electromagnetic radiation has been historically calculated using a standardized, average human observer based on psychophysical studies conducted in the 1920s. Later evidence suggested that the standard observer is inaccurate, which propelled researchers to propose new models for human visual response [4,5,6]. However, the effect of these new models on the energy performance and visual quality of electric light sources has rarely been investigated. It is likely that changing the underlying computational model for human visual sensitivity will impact the luminous efficacy calculations, which is critical for evaluating the quality, value, demand, and perception of electric light sources [7]. It can be hypothesized that the change in the visual field of view and spectral sensitivity of the functions can impact luminous efficacy and chromaticity calculations. In order to further test this hypothesis, the impact of six spectral luminous efficiency functions and six color matching functions (CMFs) on energy efficiency and color quality were analyzed.
This paper is structured to first depict the background (the history of the standardized and alternative spectral luminous efficiency and color marching functions), describe the methods used to calculate luminous efficacy of radiation, chromaticity coordinates, correlated color temperature (CCT), and Duv, and finally present and contextualize the results.
2. Background
2.1. Spectral Luminous Efficiency Function
The energy efficiency of a light source is measured by calculating the luminous efficacy (ηv); the ratio of the light output to input electrical power [8]. This can also be expressed as the luminous flux (unit: lm) emitted from a luminaire per consumed power (unit: W). While power drawn by the light source can be calculated using radiant efficiency (ηe), the calculation of luminous flux requires integrating human visual sensitivity. The spectral luminous efficiency function (also known as V(λ)) is used to represent the spectral sensitivity of the human visual system [6]. Commission Internationale de l’éclairage (CIE) developed the photopic luminous efficiency function for a 2-degree visual field in 1924 as a relative visibility function for an average observer [9]. Although the photopic luminous efficiency function is used to calculate photometric measures (e.g., illuminance, luminance), nonlinearity and non-additivity of the visual system prevents predicting perceptual phenomena, such as brightness [10].
The CIE V(λ) function was based on Wright and Guild’s experiment data [11,12]. In 1930, after Wright recalculated the trichromatic matching coefficients when matching the primaries to Guild’s experiment, the results were merged since they were seemingly close [9]. Judd identified inaccuracies in the short wavelengths and proposed a correction in 1951 [13]. In his work, he addressed the importance of accuracy for visual scientists who work with monochromatic stimuli and calibrated standard observer using same colorimetric properties and higher sensitivity in short wavelength [10]. The inaccuracy in short wavelengths was further corrected by Vos in 1978 [14]. According to his research, corrections were made to data below 380 nm and wavelengths between 380 nm to 400 nm [14]. The luminous efficiency function at 10-degree field size had also been investigated. The CIE recommended the use of 1964 CMF to represent 10-degree luminous efficiency function because it does not suffer same weakness as the CIE 2-deg luminous efficiency function [15]. Recently, the CIE published cone-fundamental-based spectral luminous efficiency functions by revising Sharpe’s work [6,16]. Despite several alternatives exist (shown in Figure 1), lighting researchers and practitioners continued to use the original CIE spectral luminous efficacy function published in the 1920s (2-degree standard observer).
2.2. Color Matching Functions
The color quality and appearance of light sources are quantified using spectral sensitivity functions derived from physiological data or color matching experiments. In a color matching experiment, observers match a monochromatic stimulus by mixing three primary colors. The intensity of primary colors needed to make a match is called color matching functions (CMFs) [17]. The CIE developed a chromaticity diagram to quantify the perceived colors of surfaces in 1931. Two chromaticity diagrams, the CIE 1931 RGB color space and the CIE 1931 XYZ were developed, where the XYZ space is a linear transformation of RGB that ensures all values are positive [9,18,19]. The CIE 1931 color matching functions , , characterizes the CIE standard observer and can be considered the spectral sensitivity curves for human color vision [20]. Since 1931, CMFs had been updated along with luminous efficiency functions (i.e., Judd [13] and Vos [14]) and the most recent versions were 2015 2-deg and 2015 10-deg [5,6,9,11,15].
The tristimulus values of different versions show variation, as shown in Figure 2. It should be noted that all the x, y, z in the figure are technically , , CMFs. The spectral sensitivity in shows a larger variation compared to and .
3. Methods
3.1. Luminous Efficacy of Radiation Calculation
The luminous efficacy quantifies the efficiency of a light source in turning electricity to visible light, and it has two parts: radiant efficiency and the luminous efficacy of radiation (LER). The LER for photopic vision is the conversion factor from optical power (watt) to luminous flux (lumen) [21]. The luminous efficacy of radiation (K, unit: lm/W) is
where, Km is a constant (Km = 683 lm/W), S(λ) is spectral power distribution of 118 different light sources, Vx (λ) is spectral luminous efficiency function for six different versions. CIE assigned different notations for different versions of the luminous efficiency function. For the CIE 2-degree standard observer is called V(λ), and the photopic luminous efficiency function developed by Judd and Vos is denoted by VM (λ) [6]. CIE’s cone-based photopic luminous efficiency function uses the notion VF,q (λ) [6,22]. While for 10-degree observers of 1964 and 2015 versions uses V10 (λ) and VF,q,10 (λ), respectively.
3.2. Color Matching Function Calculation
The tristimulus values are
The CIE 1931 (x,y) chromaticity coordinates are
The CIE 1976 (u′,v′) chromaticity coordinates are
Similar to the photopic luminous efficiency function, the symbols for chromaticity coordinates x, y, u′, v′ vary to denote the version. For example, the CIE 1931 version is the standard colorimetric observer, hence x, y were used. The chromaticity coordinates subscripts were added to CIE 1964 version to denote the 10-degrees visual field (x10, y10, u′10, v′10). In the CIE 2015 version, xF, yF, u′F, v′F and xF,10, yF,10, u′F,10, v′F,10 were used for 2-degree and 10-degree field size, respectively. Existing projective transforms can be applicable to all standard observers, while a change in the standard observer necessitated a change in terminology [20].
3.3. Correlated Color Temperature (CCT) and Duv Calculation
The color properties (CCT and Duv) of 118 correlated light sources were calculated using six versions of CMFs. The spectral power distributions of the light sources were downloaded from Davis and Ohno’s color quality scale (CQS) calculator [23]. The spectral data ranged from 380 nm to 780 nm at 1 nm intervals. Most of the light sources used in the analysis were LEDs (77). Twenty-seven fluorescent lamps, 12 gas discharged lamps (low pressure sodium, high pressure sodium, metal halide, mercury lamps), and two incandescent lamps were also included to represent luminaires in current indoor and outdoor lighting applications. The most widely used color appearance metrics, CCT and Duv (distance of a light color chromaticity from the blackbody curve, were also calculated using Ohno’s combined method (triangular solution and parabolic solution) [24] to investigate the practical impact of the sensitivity functions.
3.4. Statistical Method
Since the dataset did not meet the requirement of normality, non-parametric Wilcoxon Rank Sum test, was applied to determine whether the medians of two independent samples are equal. The null hypothesis Ho is that there is no difference in medians of the two groups when using alternative spectral functions to calculate metrics. The level of significance was set to 0.05. The effect size was also calculated. An effect size between 0.1 and 0.3 is often considered small, and the medium effect size is between 0.3 and 0.5, while large effect size is larger than 0.5 [25].
4. Results
4.1. Luminous Efficiency of Radiation
The box plots of LER were used as an example to show that parametric test cannot be applied to this study since dataset was not normally distributed. Figure 3 highlights the discrepancies between Med-Q1 and Q3-Med for some of the versions, which indicates that LER distributions are not symmetric.
Table 1 shows the significance of medians between different versions of LER. The CIE 1924 and 1951, 1978 versions displayed a very significant difference (***) from CIE 2015 10-deg with medium effect sizes. Results are similar for comparisons of CIE 1924, 1951, 1978 with CIE 1964 10-deg. Very significant differences (**) were also detected between CIE 2015 2-deg and CIE 1924, 1951, 1978 with medium effect sizes. Overall, results demonstrated a variety of significances between different versions of LER. Some of the most common light source LER results for six different versions of luminous efficiency functions are shown in Table 2. As highlighted in these examples, the largest differences (up to 36 lm/W for yttrium aluminum garnet (YAG) phosphor-converted LED (pcLED)) occurred between 2-degree and 10-degree versions of the luminous efficacy functions.
4.2. Chromaticity Coordinates
The CIE 1931 (x,y) and CIE 1976 (u′,v′) chromaticity coordinates of 118 light sources for six CMFs are shown in Figure 4.
The blackbody locus (also known as Planckian locus) together with the American National Standards Institute (ANSI) 7-Step quadrangles [26] were plotted to illustrate chromaticity coordinates of the test light sources. The Planckian locus shows the chromaticity coordinates of a theoretical blackbody object that emits lights upon receiving radiant energy, and changes spectral power distributions at different temperatures. The ANSI quadrangles show the boundaries for a given CCT.
The CIE 1931 x coordinate statistical results are shown in Table 3.
Table 3 shows the significance and effect size of medians between different versions for CIE 1931 x chromaticity coordinates. There were no statistically significant differences between versions of chromaticity coordinates, and most of the effect sizes were negligible. CIE 1931 y statistical results are listed in Table 3.
Table 4 shows a strong significant difference between different versions of CIE 1931 y coordinates. For example, different degrees of significant difference were found between 1951 and other versions except 1978 version with medium effect sizes. There are also significant differences between 2015 2-deg and other versions excluding 1924 standard observer. For 1964 10-deg observer, there was no significant difference between 1924 and 2015 10-deg, but its median had very significant difference against 1951 and 1978. Overall, statistical results indicated that CIE 1931 y coordinates could be affected by alternative CMFs.
Table 5 demonstrates statistical results for CIE 1976 u′. There are significant differences between 1964 10-deg and 1924, 1951, 1978 with medium effect sizes. When looking at 2015 10-deg, results are similar as there are also significant differences when comparing with 1924, 1951, 1978 with medium effect sizes. For other versions no significant difference was found. Field size difference might contribute to the significant difference of CIE 1976 u′ coordinates. Statistical results for CIE 1976 v′ are presented in Table 6.
Table 6 shows some significant differences of CIE 1976 v′ between different versions of CMFs. For 1924, 1964 10-deg, and 2015 10-deg, significant differences were detected compared to 1951 and 1978 versions. No significant difference was observed for other versions. These results indicate that changing CMFs would have an impact on CIE 1976 v′ coordinates.
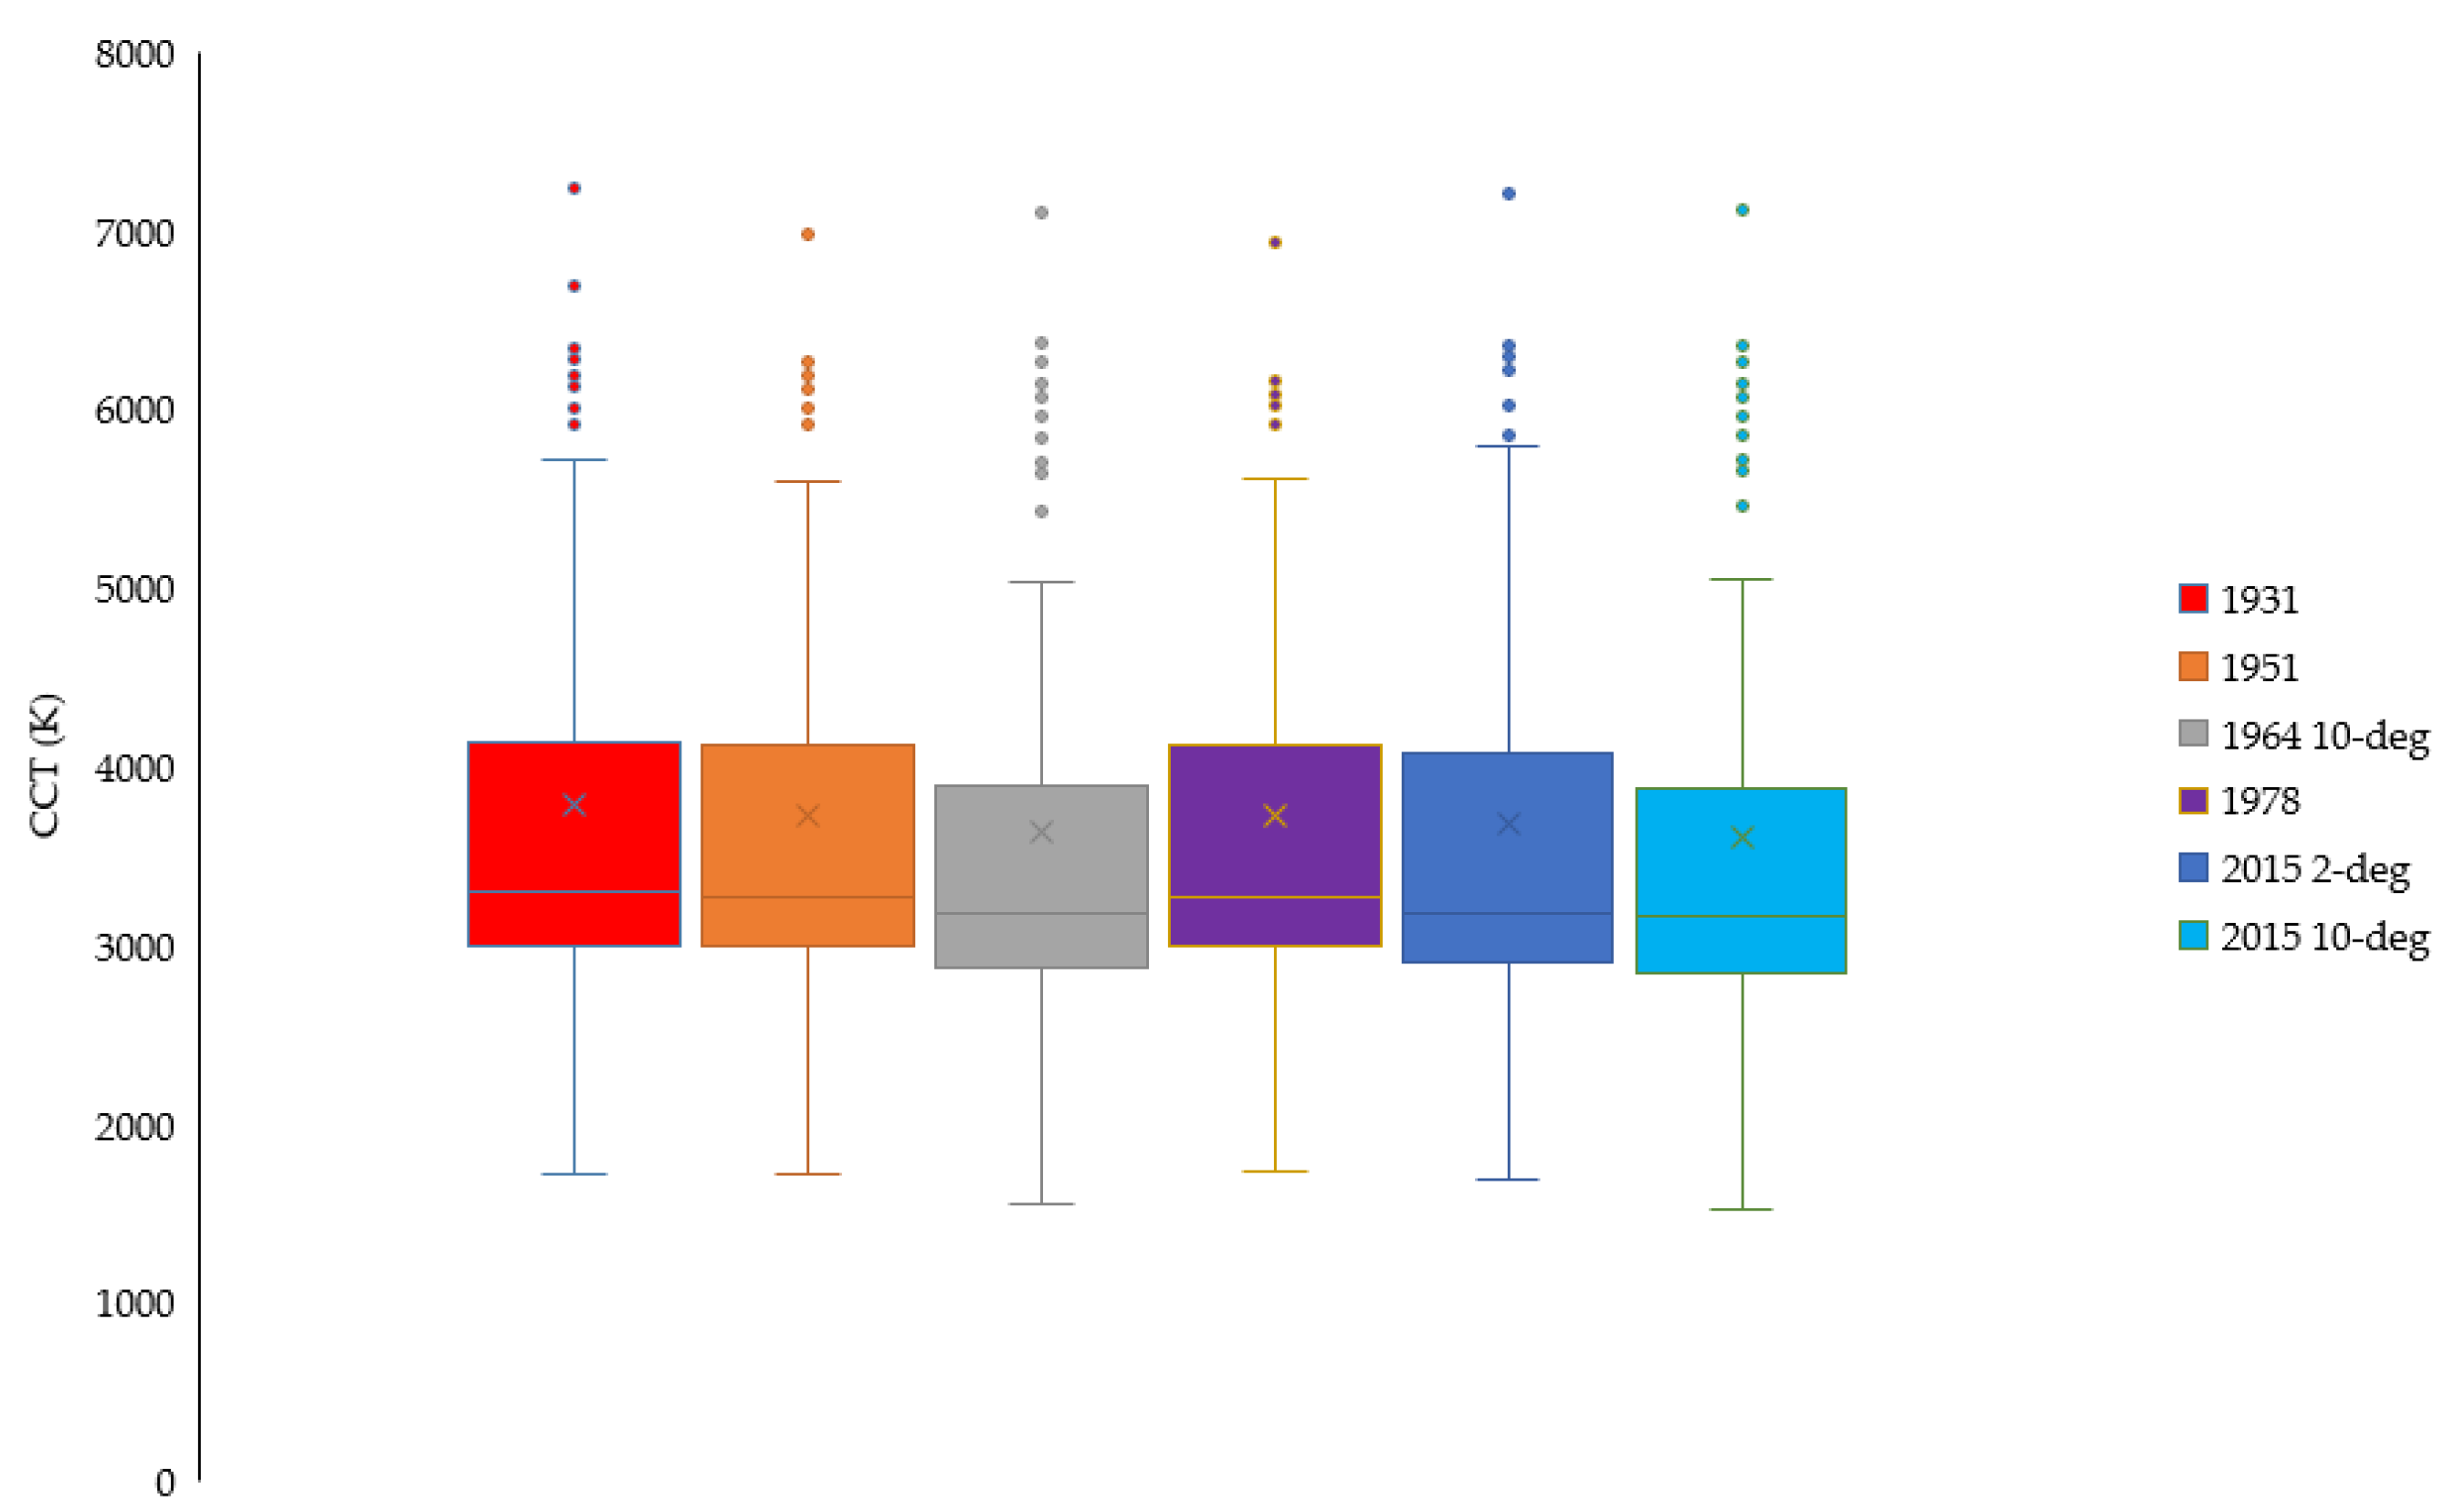
4.3. CCT and Duv
Correlated color temperature (unit: kelvin, K) is one of the most widely used lighting quality metrics. Despite its shortcomings [27], CCT is still widely used by researchers in and beyond the applied lighting and colorimetry research. To address the limitations of CCT, a complementary metric (Duv) has been previously proposed [24]. The variations in CCT and Duv caused by the change in CMFs have been quantified, as shown in Figure 5. There were variances among disparate versions of CCT calculations. Outliers can be observed in every version with varying numbers. CCT range for CIE 1964 10-deg and CIE 2015 10-deg were smaller than other versions. None of the CCT versions was symmetrically distributed as the third quartile area (between third quartile and median) was larger than the first quartile area (between first quartile and median) in each dataset.
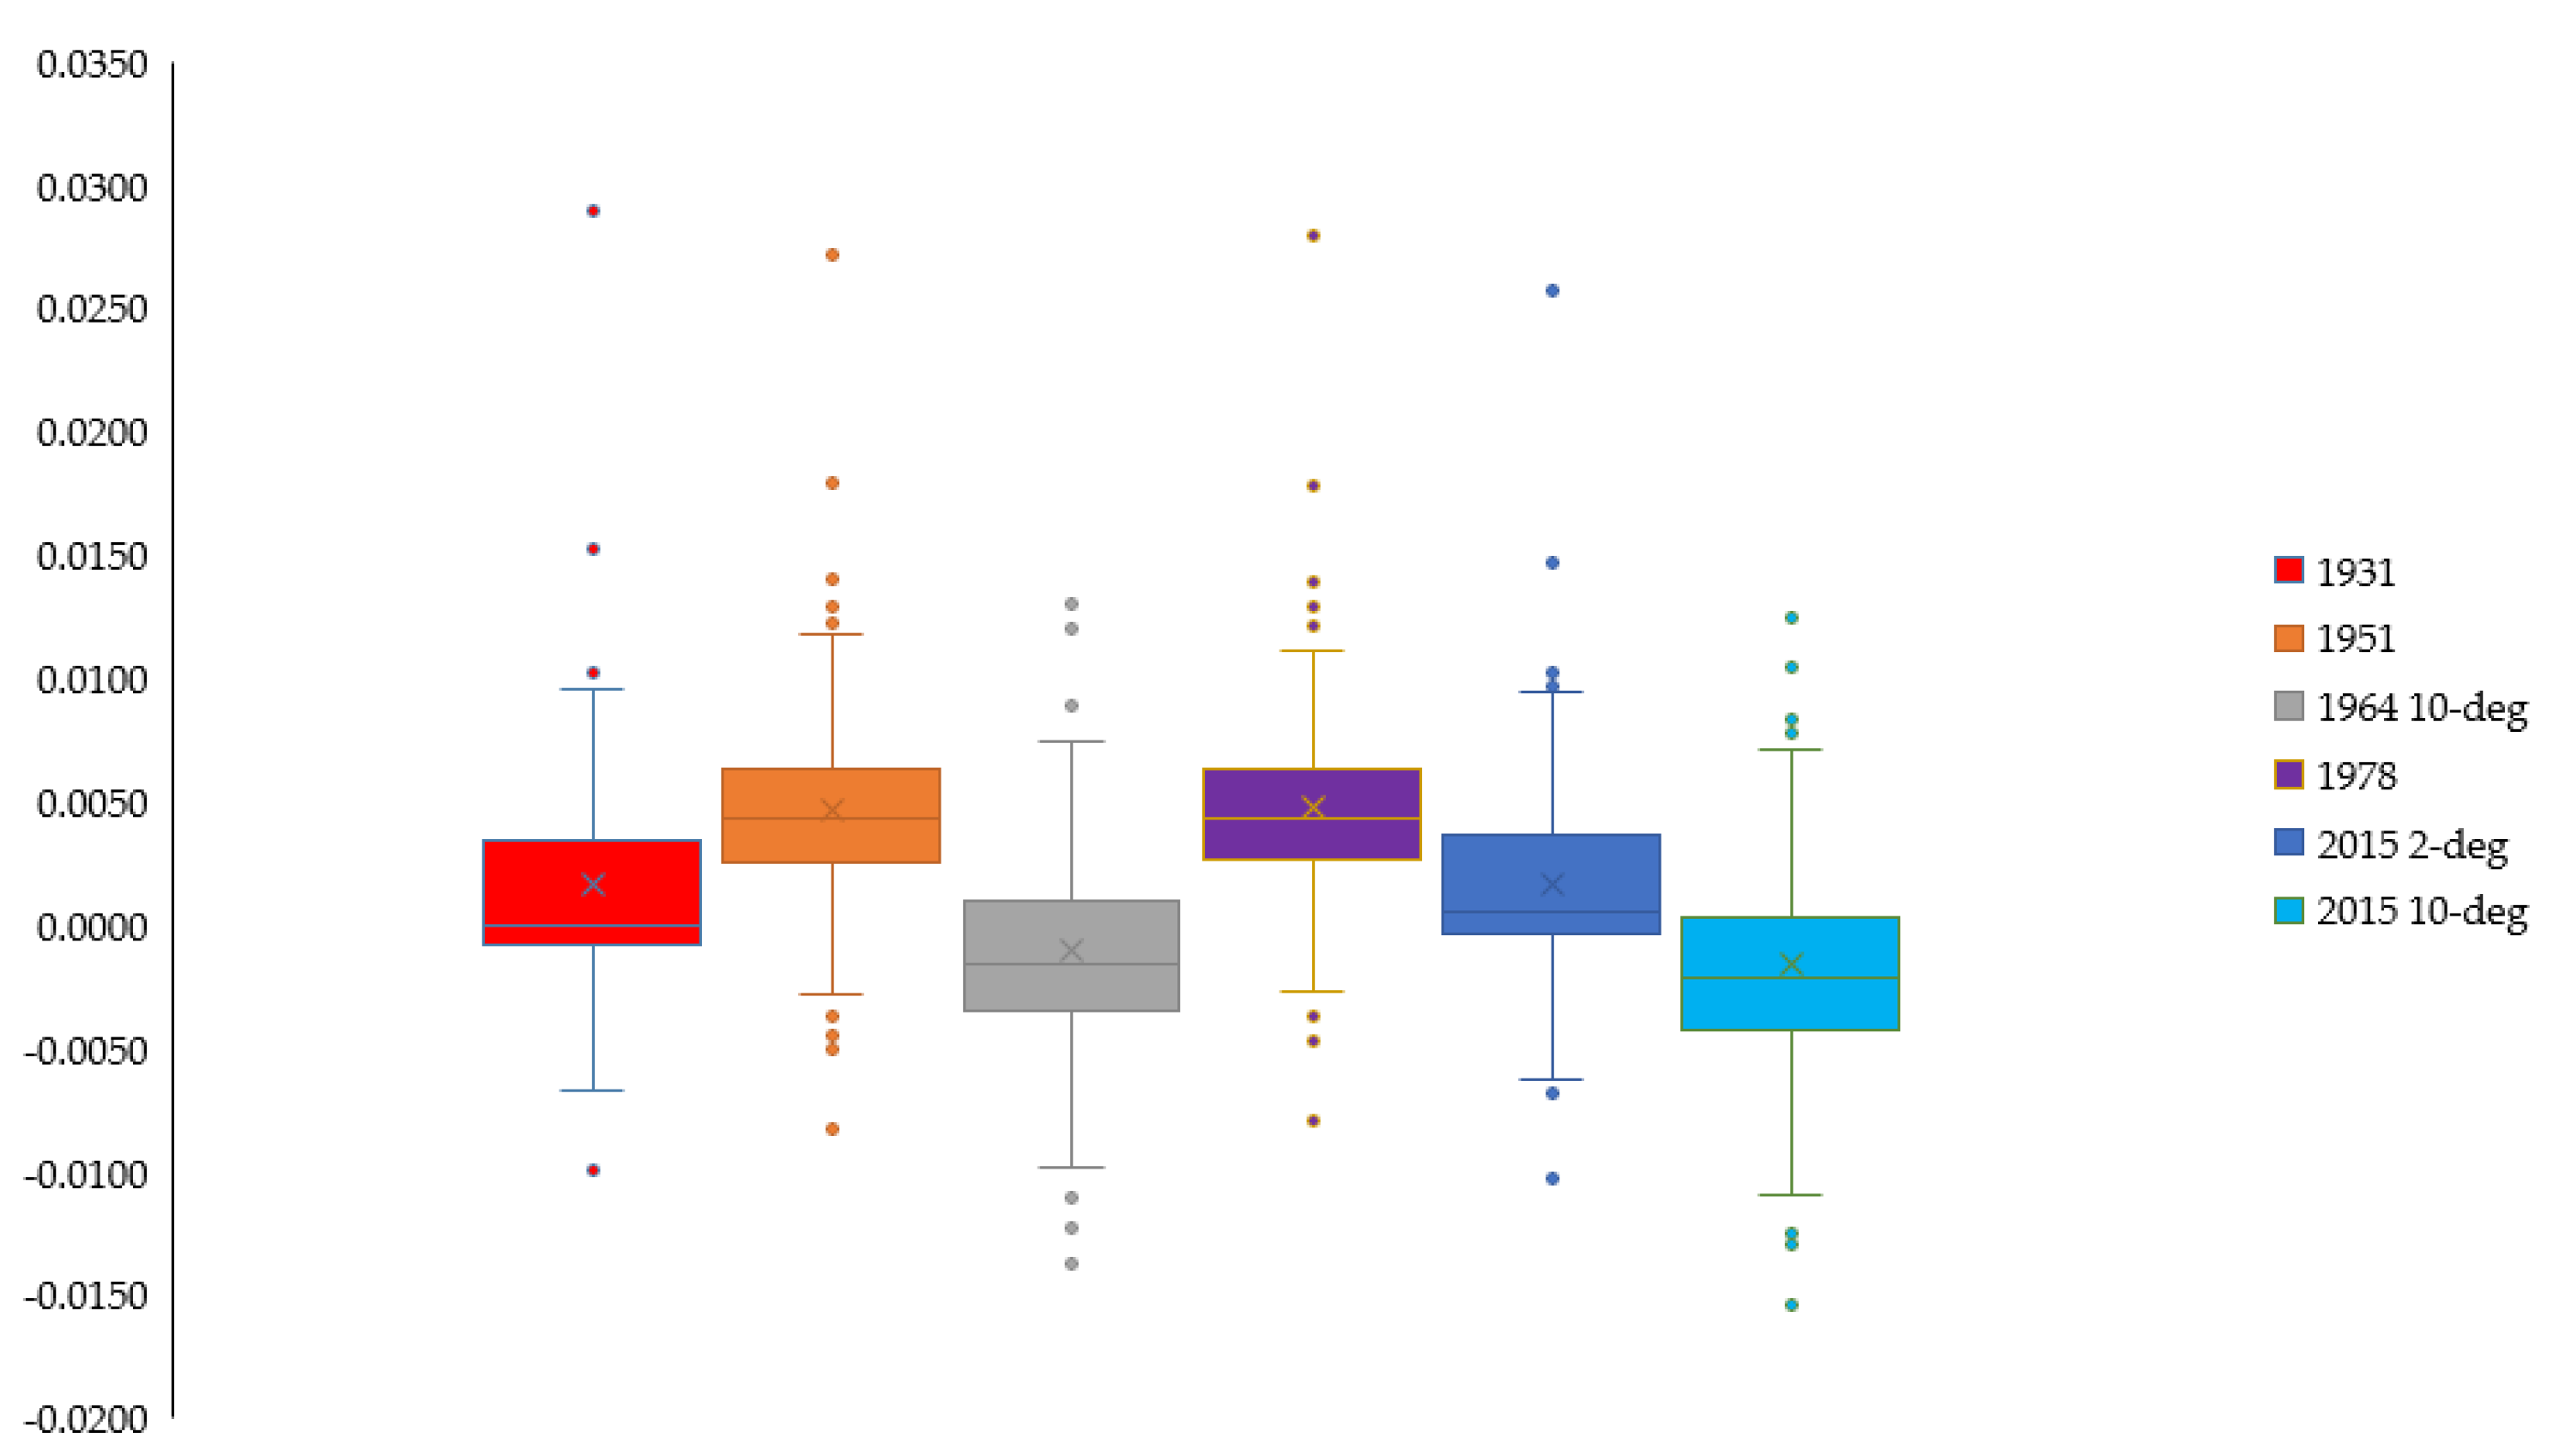
Figure 6 presents the box plots of Duv for the six versions of CMFs. Data was not symmetric as Q1 to median range did not match Q3 to median. Duv range of 1964 10-deg and 2015 10-deg are larger when compared with other versions. The Duv values calculated from 1931 CMFs were compared with the original database [23] and were almost identical, however, results from other versions did not match. Results indicate that versions of CMFs had considerably impacted the Duv results. The statistical results for CCT and Duv are presented in Table 7 and Table 8.
Table 7 shows only few significant differences of CCT between different versions. The 1924 version has significant difference compared to 1964 10-deg and 2015 10-deg. Also, significant differences can be observed between 1951 and 2015 10-deg with a medium effect size.
Table 8 shows that significant differences exist between most of the versions for Duv. Except from 1924 and 2015 2-deg, 1951 and 1978, 1964 10-deg and 2015 10-deg, other pairs show very significant differences between each other and most of them have large effect size. Alternative CMFs had a significant impact on Duv for the test light sources.
5. Discussion
The research investigating the accuracy of spectral sensitivity functions span over a century. Despite the ongoing efforts to update the standard calculation methods, there is little work investigating the real-world impacts of updating the underlying mathematical functions of chromaticity and luminous efficiency functions. Most recently, Royer et al. compared the CCT and Duv variations calculated using difference color matching functions and found significant differences [7]. Royer et al. proposed using 2015 10-degree CMFs for CCT chromaticity specifications. Our work found similar results, especially the effect of visual field size on the chromaticity calculations. This study also expands the discussion to energy efficiency by considering luminous efficacy of radiation. Both energy efficiency and color quality of light sources are important considerations for the successful acceptance of lighting technologies by the industry and consumers.
CCT is a measure of the color appearance of a light source. A higher CCT light source (e.g., 6500 K) is often perceived to be cool, while a lower CCT lamp (e.g., 2700 K) often appears warm. The lack of statistically significant difference in CCT suggests that updating CMFs may not cause a practical difference. Quantifying the perceptual differences requires a nuanced discussion. In architectural lighting practice, light sources’ CCTs are often rounded to large values and treated as nominal categories. For example, a low CCT light source at 2679 K is rounded to 2700 K packaged and marketed as a “warm white” light source due to its reddish-white appearance. An important consideration is the perceptible differences in CCT and chromaticity. There are no agreed perceptibility thresholds for CCT. For chromaticity coordinates, the CIE recommends using ∆u′v′ circles to quantify chromaticity difference between light sources, and ∆u′v′ = 0.0013 is considered a just noticeable difference (JND) at 50% probability [28].
Despite the simplicity of the nominal categorization of light source chromaticity, new lighting technologies, such as color tunable solid-state lighting devices, possess a challenge for light source characterization. Color-tunable LEDs generate white light by mixing three or more LEDs (e.g., red, green, blue, amber) and provide a large number of different SPDs within one single luminaire. Light sources of up to eight LED channels are used in architectural spaces, and up to 30-channels are used in research studies [29,30,31]. The tunable LEDs can generate spectra that have identical CCTs, but that appear different. As a result, there is a growing interest in using Duv as a complementary metric to address the limitations of CCT. For example, the ANSI provides guidance on reporting chromaticity and Duv for solid-state lighting products [26]. The Energy Star program and U.S. Department of Energy L-prize competition also require CCT and Duv to be within a given range [32,33].
The development and manufacturing of high-quality light sources also require precise quantification and reporting of photometric and colorimetric qualities. The chromaticity quantification is important for lighting manufactures and photonics researchers who aim to optimize the spectral output of light sources. The spectral optimization studies often have several target parameters, including color appearance [34,35], energy efficiency [36,37], damage reduction for artwork [38,39], and even non-image forming effects of light, such as circadian synchronization [40,41]. While the primary goal can be optimizing the spectra for an initial target parameter (e.g., energy efficiency), and a complementary metric of visual quality (e.g., CCT, Duv, color rendition metrics) is often provided to ensure that the quality of optimal solutions is relevant for architectural spaces. Although the optimal solutions in research studies might be too complex for incumbent lighting technologies, next-generation tunable LEDs will likely enable precise control through sensing and adaptive response [7,42,43,44]. Such adaptive lighting systems provide new possibilities for lighting systems to be automatically tuned to address occupants’ visual and non-visual needs.
6. Conclusions
Quantifying the quality of the electric light sources and the energy consumed by lighting systems is the critical first step in the accurate characterization of the built environment and energy modeling. The luminous efficacy of radiation and chromaticity coordinates of 118 light source spectra were analyzed under six CIE color matching functions and spectral luminous efficiency functions. Different versions of luminous efficiency functions led to significantly different luminous efficacy values. The CIE 1931 y, CIE 1976 u′, and CIE 1976 v′ coordinates were influenced by versions of the CIE color matching functions, while the CIE 1931 x coordinates were not affected. Results also suggest that CMFs can have a significant impact on Duv, but not necessarily on CCT. Different versions of CIE color matching functions and spectral luminous efficiency functions can potentially influence lighting applications, although these differences might be small.
A counterargument to updating the spectral sensitivity is the cost of updating standards, photometric measurements, and calculation procedures. The cost of updating the metrics versus gained benefits, which is the subject of economical cost-benefit analysis, is outside the scope of this paper. The limitations of this study include the inter-observer variability in spectral sensitivity functions [45]. The state of visual adaptation, size, and position of the light sources can also have a significant impact on the luminosity, thus the luminous efficiency of light sources [46,47]. Another important limitation of the general approach with luminous efficacy is that luminous efficacy and the luminous efficiency of radiation can only quantify the efficiency of individual light sources, not complete lighting systems. A more general concept of lighting application efficacy (LAE) has been recently proposed [48,49] to address these limitations, and holistically quantify the usefulness of architectural lighting in buildings. The new LAE framework can also incorporate luminous efficiency functions and account for different fields of view, as well contrast of background [49]. Future research will include visual experiments to validate the accuracy of the luminous spectral sensitivity functions in estimating perceived brightness.
Author Contributions
Conceptualization, W.S. and D.D.; methodology, W.S. and D.D.; software, W.S.; validation, W.S. and D.D.; formal analysis, W.S.; investigation, W.S.; data curation, D.D.; writing—original draft preparation, W.S.; writing—review and editing, D.D.; visualization, W.S.; supervision, D.D.; project administration, D.D. All authors have read and agreed to the published version of the manuscript.
Funding
This research received no external funding.
Institutional Review Board Statement
Not applicable.
Informed Consent Statement
Not applicable.
Data Availability Statement
The data can be found in the link: https://doi.org/10.5281/zenodo.7309085 (accessed on 30 November 2022).
Conflicts of Interest
The authors declare no conflict of interest.
References
- Lee, K. 2022 Solid-State Lighting R&D Opportunities (No. DOE/EE-2542); Guidehouse: Chicago, IL, USA, 2022. [Google Scholar]
- Sesana, E.; Bertolin, C.; Gagnon, A.S.; Hughes, J.J. Mitigating climate change in the cultural built heritage sector. Climate 2019, 7, 90. [Google Scholar] [CrossRef] [Green Version]
- Toftum, J.; Thorseth, A.; Markvart, J.; Logadóttir, Á. Occupant response to different correlated colour temperatures of white LED lighting. Build. Environ. 2018, 143, 258–268. [Google Scholar] [CrossRef]
- Viénot, F.; Walraven, P. Colour-matching functions, physiological basis. In Colorimetry: Understanding the CIE System; CIE: Vienna, Austria; Wiley-Interscience: Hoboken, NJ, USA, 2007; pp. 219–243. [Google Scholar]
- Stockman, A. Cone fundamentals and CIE standards. Curr. Opin. Behav. Sci. 2019, 30, 87–93. [Google Scholar] [CrossRef]
- CIE 170-2:2015; Fundamental Chromaticity Diagram with Physiological Axes—Part 2: Spectral Luminous Efficiency Functions and Chromaticity Diagrams. Commission Internationale de l’Eclairage: Vienna, Austria, 2015.
- Royer, M.; Murdoch, M.J.; Smet, K.; Whitehead, L.; David, A.; Houser, K.; Esposito, T.; Livingston, J.; Ohno, Y. Improved Method for Evaluating and Specifying the Chromaticity of Light Sources. Leukos 2022, 1–18. [Google Scholar] [CrossRef]
- Ohno, Y. Spectral design considerations for white LED color rendering. Opt. Eng. 2005, 44, 11302. [Google Scholar] [CrossRef]
- CIE. Commission Internationale de l’Eclairage Proceedings; Cambridge University Press: Cambridge, UK, 2008. [Google Scholar]
- Schanda, J.; Morren, L.; Rea, M.; Rositani-Ronchi, L.; Walraven, P. Does lighting need more photopic luminous efficiency functions? Light. Res. Technol. 2002, 34, 69–76. [Google Scholar] [CrossRef]
- Wright, W.D. A re-determination of the trichromatic coefficients of the spectral colours. Trans. Opt. Soc. 1929, 30, 141. [Google Scholar] [CrossRef]
- Guild, J. The colorimetric properties of the spectrum. Philos. Trans. R. Soc. Lond. Ser. A 1931, 230, 149–187. [Google Scholar]
- Judd, D.B. Color in business science and industry. Appl. Spectrosc. 1953, 7, 90–91. [Google Scholar] [CrossRef]
- Vos, J.J. Colorimetric and photometric properties of a 2 fundamental observer. Color Res. Appl. 1978, 3, 125–128. [Google Scholar] [CrossRef]
- CIE. CIE 10 Degree Photopic Photometric Observer; Commission Internationale de l’Eclairage: Vienna, Austria, 2005. [Google Scholar]
- Sharpe, L.T.; Stockman, A.; Jagla, W.; Jagle, H. A luminous efficiency function, V*(λ), for daylight adaptation. J. Vis. 2005, 5, 3. [Google Scholar] [CrossRef] [PubMed]
- Schwartz, S.H.; Swanson, W.H. Empiric determination of corrected visual acuity standards for train crews. Optom. Vis. Sci. 2005, 82, 774–778. [Google Scholar] [CrossRef] [PubMed]
- Smith, T.; Guild, J. The CIE colorimetric standards and their use. Trans. Opt. Soc. 1931, 33, 73. [Google Scholar] [CrossRef]
- Fairman, H.S.; Brill, M.H.; Hemmendinger, H. How the CIE 1931 color-matching functions were derived from Wright-Guild data. Color Res. Appl. 1997, 22, 11–23. [Google Scholar] [CrossRef]
- CIE. CIE 015:2018 Colorimetry, 4th ed.; Commission Internationale de l’Eclairage: Vienna, Austria, 2018. [Google Scholar]
- Ohno, Y. Color rendering and luminous efficacy of white LED spectra. In Proceedings of the Fourth International Conference on Solid State Lighting, Denver, CO, USA, 3–6 August 2004. [Google Scholar]
- Sharpe, L.T.; Stockman, A.; Jagla, W.; Jägle, H. A luminous efficiency function, VD65*(λ), for daylight adaptation: A correction. Color Res. Appl. 2011, 36, 42–46. [Google Scholar] [CrossRef]
- Davis, W.; Ohno, Y. Color quality scale. Opt. Eng. 2010, 49, 033602. [Google Scholar] [CrossRef] [Green Version]
- Ohno, Y. Practical use and calculation of CCT and Duv. Leukos 2014, 10, 47–55. [Google Scholar] [CrossRef]
- Cohen, J. A power primer. Psychol. Bull. 1992, 112, 155–159. [Google Scholar] [CrossRef]
- ANSI C78.377-2017; American National Standard for Electric Lamps—Specifications for the Chromaticity of Solid State Lighting Products. National Electrical Manufacturers Association: Rosslyn, VA, USA, 2017.
- Durmus, D. Correlated color temperature: Use and limitations. Light. Res. Technol. 2022, 54, 363–375. [Google Scholar] [CrossRef]
- TN 001:2014; Chromaticity Difference Specification for Light Sources. Commission Internationale de l’Eclairage: Vienna, Austria, 2014.
- Kong, X.; Wei, M.; Murdoch, M.J.; Vogels, I.; Heynderickx, I. Assessing the temporal uniformity of CIELAB hue angle. JOSA A 2020, 37, 521–528. [Google Scholar] [CrossRef]
- Durmus, D. Multi-objective optimization trade-offs for color rendition, energy efficiency, and circadian metrics. In Light-Emitting Devices, Materials, and Applications XXV; SPIE: Bellingham, WA, USA, 2021; Volume 11706, pp. 143–151. [Google Scholar]
- Li, J.; Hanselaer, P.; Smet, K.A. Impact of color matching primaries on observer matching: Part II–Observer variability. Leukos 2022, 18, 104–126. [Google Scholar] [CrossRef]
- Energy Star. Energy Star Certification for Buildings. Available online: https://www.energystar.gov/buildings/building_recognition/building_certification (accessed on 13 November 2021).
- EERE. L-Prize Competition. Available online: https://www.energy.gov/eere/ssl/l-prize-competition (accessed on 9 May 2021).
- Royer, M. Evaluating tradeoffs between energy efficiency and color rendition. OSA Contin. 2019, 2, 2308–2327. [Google Scholar] [CrossRef]
- Pardo, P.J.; Suero, M.I.; Pérez, Á.L.; Martínez-Borreguero, G. Optimization of the correlated color temperature of a light source for a better color discrimination. JOSA A 2014, 31, A121–A124. [Google Scholar] [CrossRef] [PubMed]
- Durmus, D.; Davis, W. Appearance of achromatic colors under optimized light source spectrum. IEEE Photonics 2018, 10, 1–11. [Google Scholar] [CrossRef]
- Zhu, P.; Zhu, H.; Adhikari, G.C.; Thapa, S. Spectral optimization of white light from hybrid metal halide perovskites. OSA Contin. 2019, 2, 1880–1888. [Google Scholar] [CrossRef]
- Durmus, D.; Abdalla, D.; Duis, A.; Davis, W. Spectral Optimization to Minimize Light Absorbed by Artwork. Leukos 2020, 16, 45–54. [Google Scholar] [CrossRef] [Green Version]
- Kore, R.; Brown, N.; Durmus, D. Damage Reduction with Maintained Colour Quality of Artwork Under RGB Projector. Light. Res. Technol. 2023. submitted. [Google Scholar]
- Hu, W.; Davis, W. Spectral optimization for human-centric lighting using a genetic algorithm and a modified Monte Carlo method. In Proceedings of the Optical Devices and Materials for Solar Energy and Solid-state Lighting, Washington, DC, USA, 13–16 July 2020; p. PvM2G-4. [Google Scholar]
- Durmus, D. Circadian metric variability measures for tunable LED light sources. In Light-Emitting Devices, Materials, and Applications XXV; SPIE: Bellingham, WA, USA, 2021; Volume 11706, pp. 108–114. [Google Scholar]
- Afshari, S.; Mishra, S.; Wen, J.; Karlicek, R. An adaptive smart lighting system. In Proceedings of the Fourth ACM Workshop on Embedded Sensing Systems for Energy-Efficiency in Buildings, New York, NY, USA, 6 November 2012; pp. 201–202. [Google Scholar]
- Choi, K.; Suk, H.J. Dynamic lighting system for the learning environment: Performance of elementary students. Opt. Exp. 2016, 24, A907–A916. [Google Scholar] [CrossRef] [Green Version]
- Wang, Y.; Durmus, D. Image quality metrics, personality traits, and subjective evaluation of indoor environment images. Buildings 2022, 12, 2086. [Google Scholar] [CrossRef]
- Asano, Y.; Fairchild, M.D.; Blondé, L.; Morvan, P. Color matching experiment for highlighting interobserver variability. Color Res. Appl. 2016, 41, 530–539. [Google Scholar] [CrossRef]
- Yang, W.; Jeon, J.Y. Effects of correlated colour temperature of LED light on visual sensation, perception, and cognitive performance in a classroom lighting environment. Sustainability 2020, 12, 4051. [Google Scholar] [CrossRef]
- Zhang, J.; Lv, K.; Zhang, X.; Ma, M.; Zhang, J. Study of Human Visual Comfort Based on Sudden Vertical Illuminance Changes. Buildings 2022, 12, 1127. [Google Scholar] [CrossRef]
- Pattison, M.; Hansen, M.; Bardsley, N.; Elliott, C.; Lee, K.; Pattison, L.; Tsao, J. 2019 Lighting R&D Opportunities; Solid State Lighting Solutions (SSLS) Inc.: Santa Barbara, CA, USA, 2020. [Google Scholar]
- Durmus, D.; Hu, W.; Davis, W. Lighting application efficacy: A framework for holistically measuring lighting use in buildings. Front. Built Environ. 2022, 8, 986961. [Google Scholar] [CrossRef]
Figure 1.
The CIE 1924 (black continuous line), 1951 Judd (brown continuous line), CIE 1964 10-degree (light green continuous line), 1978 Vos (green dashed line), CIE 2015 2-degree (cyan continuous line), and CIE 2015 10-degree (red continuous line) spectral luminous efficacy functions.
Figure 1.
The CIE 1924 (black continuous line), 1951 Judd (brown continuous line), CIE 1964 10-degree (light green continuous line), 1978 Vos (green dashed line), CIE 2015 2-degree (cyan continuous line), and CIE 2015 10-degree (red continuous line) spectral luminous efficacy functions.

Figure 2.
The CIE 1931 (blue lines), 1951 Judd version (yellow lines), CIE 1964 10-degree (red lines), 1978 Vos version (green lines), CIE 2015 2-deg (black lines), and CIE 2015 10-deg (gray lines) color matching functions. Dotted lines are long-wavelength, dashed lines are middle-wavelength, and continuous lines are short-wavelength CMFs.

Figure 3.
Box plot of LER for six spectral luminous efficiency functions.

Figure 4.
The chromaticity coordinates of 118 light sources using six different color matching functions: (a) CIE 1931 (x,y); (b) CIE 1976 (u′,v′). The black continuous line is the Planckian locus, and the red straight lines show the ANSI 7-step quadrangles [26].
Figure 4.
The chromaticity coordinates of 118 light sources using six different color matching functions: (a) CIE 1931 (x,y); (b) CIE 1976 (u′,v′). The black continuous line is the Planckian locus, and the red straight lines show the ANSI 7-step quadrangles [26].

Figure 5.
The box plot of CCTs for six CMFs: 1931 (red), 1951 (orange), 1964 10-degrees (gray), 1978 (purple), 2015 2-degrees (blue), 2015 10-degrees (cyan).
Figure 5.
The box plot of CCTs for six CMFs: 1931 (red), 1951 (orange), 1964 10-degrees (gray), 1978 (purple), 2015 2-degrees (blue), 2015 10-degrees (cyan).

Figure 6.
The box plot of Duv for six CMFs: 1931 (red), 1951 (orange), 1964 10-degrees (gray), 1978 (purple), 2015 2-degrees (blue), 2015 10-degrees (cyan).
Figure 6.
The box plot of Duv for six CMFs: 1931 (red), 1951 (orange), 1964 10-degrees (gray), 1978 (purple), 2015 2-degrees (blue), 2015 10-degrees (cyan).


Table 1.
Rank sum test and effect size for LER (p-value and effect size (r)).
| 1924 | 1951 | 1964 10-Deg | 1978 | 2015 2-Deg | 2015 10-Deg | ||
|---|---|---|---|---|---|---|---|
| 1924 | p | - | 0.875 ns | <0.001 *** | 0.797 ns | 0.002 ** | <0.001 *** |
| r | 0.014 | 0.323 | 0.024 | 0.284 | 0.381 | ||
| 1951 | p | - | - | <0.001 *** | 0.863 ns | 0.002 ** | <0.001 *** |
| r | 0.320 | 0.016 | 0.280 | 0.376 | |||
| 1964 10-deg | p | - | - | - | <0.001 *** | 0.697 ns | 0.437 ns |
| r | 0.313 | 0.036 | 0.072 | ||||
| 1978 | p | - | - | - | - | 0.003 ** | <0.001 *** |
| r | 0.274 | 0.370 | |||||
| 2015 2-deg | p | - | - | - | - | - | 0.276 ns |
| r | 0.100 |
ns: no significant difference. **, ***: very significant difference.
Table 2.
LER results for four different light sources.
| LER (lm/W) | pcLED YAG | Daylight Fluorescent | Incandescent | RGB LED (5000 K) |
|---|---|---|---|---|
| 1924 | 293.84 | 290.65 | 154.87 | 277.50 |
| 1951 | 294.24 | 292.28 | 155.11 | 277.72 |
| 1964 10-deg | 323.84 | 315.69 | 163.24 | 308.81 |
| 1978 | 294.40 | 292.51 | 155.09 | 277.61 |
| 2015 2-deg | 310.70 | 306.08 | 163.12 | 295.26 |
| 2015 10-deg | 329.43 | 320.95 | 164.73 | 312.43 |
Table 3.
Rank sum test and effect size for CIE 1931 x (p-value and effect size (r)).
| 1924 | 1951 | 1964 10-Deg | 1978 | 2015 2-Deg | 2015 10-Deg | ||
|---|---|---|---|---|---|---|---|
| 1924 | p | - | 0.225 ns | 0.118 ns | 0.191 ns | 0.134 ns | 0.095 ns |
| r | 0.112 | 0.114 | 0.120 | 0.138 | 0.154 | ||
| 1951 | p | - | - | 0.998 ns | 0.908 ns | 0.702 ns | 0.095 ns |
| r | 0.0002 | 0.011 | 0.035 | 0.032 | |||
| 1964 10-deg | p | - | - | - | 0.942 ns | 0.690 ns | 0.698 ns |
| r | 0.007 | 0.037 | 0.036 | ||||
| 1978 | p | - | - | - | - | 0.765 ns | 0.798 ns |
| r | 0.028 | 0.024 | |||||
| 2015 2-deg | p | - | - | - | - | - | 0.957 ns |
| r | 0.005 |
ns: no significant difference.
Table 4.
Rank sum test and effect size for CIE 1931 y (p-value and effect size (r)).
| 1924 | 1951 | 1964 10-Deg | 1978 | 2015 2-Deg | 2015 10-Deg | ||
|---|---|---|---|---|---|---|---|
| 1924 | p | - | 0.001 *** | 0.236 ns | 0.001 *** | 0.280 ns | 0.113 ns |
| r | 0.307 | 0.109 | 0.303 | 0.100 | 0.146 | ||
| 1951 | p | - | - | <0.001 *** | 0.872 ns | 0.007 ** | <0.001 *** |
| r | 0.400 | 0.015 | 0.250 | 0.430 | |||
| 1964 10-deg | p | - | - | - | <0.001 *** | 0.035 * | 0.629 ns |
| r | 0.398 | 0.194 | 0.044 | ||||
| 1978 | p | - | - | - | - | 0.006 ** | <0.001 *** |
| r | 0.251 | 0.431 | |||||
| 2015 2-deg | p | - | - | - | - | - | 0.012 * |
| r | 0.233 |
ns: no significant difference. **, ***: very significant difference. *: significant difference.
Table 5.
Rank sum test and effect size for CIE 1976 u’ (p-value and effect size (r)).
| 1924 | 1951 | 1964 10-Deg | 1978 | 2015 2-Deg | 2015 10-Deg | ||
|---|---|---|---|---|---|---|---|
| 1924 | p | - | 0.378 ns | 0.025 * | 0.442 ns | 0.123 ns | 0.010 ** |
| r | 0.081 | 0.207 | 0.071 | 0.142 | 0.237 | ||
| 1951 | p | - | - | 0.009 ** | 0.733 ns | 0.064 ns | 0.004 ** |
| r | 0.240 | 0.031 | 0.171 | 0.269 | |||
| 1964 10-deg | p | - | - | - | 0.010 ** | 0.331 ns | 0.491 ns |
| r | 0.236 | 0.090 | 0.063 | ||||
| 1978 | p | - | - | - | - | 0.075 ns | 0.004 ** |
| r | 0.164 | 0.262 | |||||
| 2015 2-deg | p | - | - | - | - | - | 0.117 ns |
| r | 0.144 |
ns: no significant difference. **: very significant difference. *: significant difference.
Table 6.
Rank sum test and effect size for CIE 1976 v’ (p-value and effect size (r)).
| 1924 | 1951 | 1964 10-Deg | 1978 | 2015 2-Deg | 2015 10-Deg | ||
|---|---|---|---|---|---|---|---|
| 1924 | p | - | 0.014 * | 0.787 ns | 0.012 * | 0.255 ns | 0.677 ns |
| r | 0.227 | 0.025 | 0.231 | 0.105 | 0.038 | ||
| 1951 | p | - | - | 0.011 * | 0.934 ns | 0.129 ns | 0.008 ** |
| r | 0.235 | 0.008 | 0.140 | 0.245 | |||
| 1964 10-deg | p | - | - | - | 0.010 ** | 0.165 ns | 0.803 ns |
| r | 0.237 | 0.128 | 0.023 | ||||
| 1978 | p | - | - | - | - | 0.131 ns | 0.007 ** |
| r | 0.139 | 0.247 | |||||
| 2015 2-deg | p | - | - | - | - | - | 0.134 ns |
| r | 0.138 |
ns: no significant difference. **: very significant difference. *: significant difference.
Table 7.
Rank sum test and effect size for CCT (p-value and effect size (r)).
| 1924 | 1951 | 1964 10-Deg | 1978 | 2015 2-Deg | 2015 10-Deg | ||
|---|---|---|---|---|---|---|---|
| 1924 | p | - | 0.594 ns | 0.039 * | 0.582 ns | 0.070 ns | 0.024 * |
| r | 0.049 | 0.190 | 0.051 | 0.167 | 0.208 | ||
| 1951 | p | - | - | 0.083 ns | 0.967 ns | 0.142 ns | 0.050 * |
| r | 0.160 | 0.004 | 0.135 | 0.181 | |||
| 1964 10-deg | p | - | - | - | 0.088 ns | 0.629 ns | 0.532 ns |
| r | 0.157 | 0.045 | 0.057 | ||||
| 1978 | p | - | - | - | - | 0.149 ns | 0.052 ns |
| r | 0.133 | 0.179 | |||||
| 2015 2-deg | p | - | - | - | - | - | 0.276 ns |
| r | 0.100 |
ns: no significant difference. *: significant difference.
Table 8.
Rank sum test and effect size for Duv (p-value and effect size (r)).
| 1924 | 1951 | 1964 10-Deg | 1978 | 2015 2-Deg | 2015 10-Deg | ||
|---|---|---|---|---|---|---|---|
| 1924 | p | - | <0.001 *** | <0.001 *** | <0.001 *** | 0.350 ns | <0.001 *** |
| r | 0.565 | 0.436 | 0.576 | 0.086 | 0.521 | ||
| 1951 | p | - | - | <0.001 *** | 0.970 ns | <0.001 *** | <0.001 *** |
| r | 0.794 | 0.003 | 0.546 | 0.830 | |||
| 1964 10-deg | p | - | - | - | <0.001 *** | <0.001 *** | 0.180 ns |
| r | 0.801 | 0.474 | 0.123 | ||||
| 1978 | p | - | - | - | - | <0.001 *** | <0.001 *** |
| r | 0.556 | 0.836 | |||||
| 2015 2-deg | p | - | - | - | - | - | <0.001 *** |
| r | 0.551 |
ns: no significant difference. ***: very significant difference.
Publisher’s Note: MDPI stays neutral with regard to jurisdictional claims in published maps and institutional affiliations. |
© 2022 by the authors. Licensee MDPI, Basel, Switzerland. This article is an open access article distributed under the terms and conditions of the Creative Commons Attribution (CC BY) license (https://creativecommons.org/licenses/by/4.0/).
Share and Cite
MDPI and ACS Style
Song, W.; Durmus, D. Evaluating Energy Efficiency and Colorimetric Quality of Electric Light Sources Using Alternative Spectral Sensitivity Functions. Buildings 2022, 12, 2220. https://doi.org/10.3390/buildings12122220
AMA Style
Song W, Durmus D. Evaluating Energy Efficiency and Colorimetric Quality of Electric Light Sources Using Alternative Spectral Sensitivity Functions. Buildings. 2022; 12(12):2220. https://doi.org/10.3390/buildings12122220
Chicago/Turabian StyleSong, Wangyang, and Dorukalp Durmus. 2022. "Evaluating Energy Efficiency and Colorimetric Quality of Electric Light Sources Using Alternative Spectral Sensitivity Functions" Buildings 12, no. 12: 2220. https://doi.org/10.3390/buildings12122220
Note that from the first issue of 2016, this journal uses article numbers instead of page numbers. See further details here.