
Experimental Study on Vortex-Induced Vibration of Steel Tubes in Transmission Towers at Various Inflow Conditions

1
School of Civil Engineering, Chongqing University, Chongqing 400045, China
2
Chongqing Key Laboratory of Wind Engineering and Wind Resources Utilization, Chongqing 400045, China
3
State Grid Corporation of China, Beijing 100031, China
*
Author to whom correspondence should be addressed.
Buildings 2023, 13(1), 252; https://doi.org/10.3390/buildings13010252
Submission received: 23 November 2022
/
Revised: 6 January 2023
/
Accepted: 13 January 2023
/
Published: 16 January 2023
(This article belongs to the Special Issue Wind Nonlinear Analysis of Tall Buildings, High-Rise Structures, Flexible Bridges and Transmission Lines)
Abstract
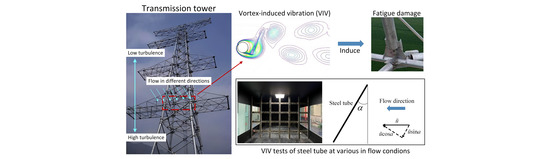
:With the extensive construction of ultra-high voltage (UHV) transmission lines, the fatigue damage of steel tube members caused by vortex-induced vibration (VIV) in tubular towers has received growing attention. Although some progress has been made in the research of the VIV of steel tubes in uniform flow, there is still relatively scarce research on the VIV of steel tubes at various inflow conditions. In this paper, a series of wind tunnel tests are conducted to investigate the VIV of the steel tube subjected to uniform, turbulent, and oblique flows. Three turbulence intensities (Iu = 5.9%, 9.7%, and 12.6%), and four yaw angles (α = 10°, 20°, 30°, and 40°) are considered. The results show that the VIV response of the steel tube in the in-line (IL) direction is negligible compared to that in the cross-flow (CF) direction. The displacement amplitude gradually decreases as the turbulence intensity increases, accompanied by a more unstable response. For the inclined steel tube, the VIV maximum amplitude almost remains constant when α ≤ 20°, while it sharply decreased in the case of α = 30° and α = 40°. Furthermore, it was found that the so-called independent principle is applicable for α ≤ 10°.
1. Introduction
Tubular towers are broadly and increasingly constructed in ultra-high voltage (UHV) transmission lines due to their economic and technical advantages such as high-bearing capacity and small wind pressure coefficient [1,2]. However, it was found that some steel tube members with large slenderness ratios are susceptible to continuous vortex-induced vibration (VIV) [2,3,4]. During the service period, long-term and high-frequency VIVs would lead to bolts loosening and even fatigue failure of joints of steel tube members [4,5,6], which may threaten the operational reliability and durability of the entire transmission lines. As a result, it is of critical importance to investigate the VIV of steel tubes in transmission towers.
At present, the research methods for studying the VIV of steel tubes mainly include the experiment and computational fluid dynamic (CFD) simulation. Although some promising techniques such as unsteady RANS simulations [5] and large eddy simulation (LES) [6] are increasingly used in the prediction of the VIV of steel tubes, they are still difficult to override deficiencies, including the limited accuracy and reliability and troubles in simulating high Reynold numbers and turbulent flows. In comparison, it is acknowledged that experimental measurement is the most reliable way for studying the VIV of such flexible structures. Deng et al. [2] conducted the first detailed experimental study of VIV of steel tubes in transmission towers with typical joints. The effects of the main structural parameters including the slenderness ratio, connection type, as well as well-known mass-damping ratios on the VIV amplitude of steel tubes were investigated. For steel tubes connected with C-joints, which are particularly vulnerable to the hazard of VIV, Huang et al. [3] carried out a series of wind tunnel tests and investigated the main VIV characteristics of the tubes under uniform flow in terms of time-history response and spectral properties. Furthermore, they proposed a semi-empirical formula for the prediction of the VIV maximum amplitude of steel tubes under uniform flow.
Overall, the previous studies have mainly focused on the VIV of steel tube members in a non-turbulent uniform flow, and additionally, the axis of the structure is exactly perpendicular to the flow direction. Nevertheless, in practice, the inflow conditions that steel tube members experienced are actually turbulent. Generally, the influence of turbulence flows is related to both turbulence intensity (Iu) and the ratio of turbulence scale to diameter. In previous decades, extensive studies [7,8,9,10,11,12,13] have been conducted for both fixed and elastically mounted circular cylinders under different Reynolds numbers (Re), and turbulence levels. The results indicated that the free stream turbulence would affect both mean and fluctuating pressure and Strouhal number (St), and also significantly influence the VIV response. Pastò [13] performed a set of wind tunnel tests for elastically mounted circular cylinders under different turbulence levels up to Iu = 13.5%. It was found that the VIV response and length of the lock-in region significantly decrease as the turbulence level increases. On the other hand, for the steel tubes in transmission towers, the flow direction may not be strictly perpendicular to the axis directions of steel tube members. Compared with the normal incident case, the inclined angle can significantly influence the VIV response characteristics of both the elastically supported cylinder [14,15,16,17,18,19] and the flexible cylinder [20,21]. Franzini et al. [18] experimentally investigated the VIV of the rigid cylinder elastically mounted with five inclination angles (α = 0°, 10°, 20°, 30°, 40°). The test results show that the displacement amplitudes almost remain the same as that found in normal-incidence ones for the inclined angles less than 20°, whereas the amplitude decreases obviously when the inclined angle is greater than 20°. In general, researchers have conducted extensive studies on elastic-supported cylinders and flexible cylinders under turbulent and oblique flow conditions. However, so far there has been little research on the VIV of steel tubes in transmission towers under turbulent and inclined incoming flow conditions.
Therefore, in this paper, a series of wind tunnel tests were performed on VIV of steel tubes in the transmission towers in the case of uniform, turbulent (Iu = 5.8%, 9.2%, 12.3%), and oblique (α = 10°, 20°, 30°, 40°) inflow conditions. The remainder of this paper is as follows. Section 2 presents the experimental setups and test methods. Section 3 investigates the VIV response of the steel tube in uniform flow. The effects of flow turbulence and yaw angle on the VIV of steel tubes are illustrated in Section 4 and Section 5, respectively. Finally, some conclusions are summarized in Section 6.
2. Experiment
2.1. Test Setups
Experiments were carried out in the wind tunnel laboratory of Chongqing University, with a test section of 15 m in length, 2.4 m in width, and 1.8 m in height. The wind speed in the laboratory could be continuously changed and the maximum attainable value is 35 m/s, which can satisfy the test needs. The test specimen was the steel tube connected with the C-shaped joint that is commonly used in actual engineering, and its main physical parameters are shown in Table 1. Considering the tube’s diameter and the range of average wind speeds tested, the range of Re varies from 13,000 to 26,000.
Figure 1 shows the overall experimental setup. As shown in Figure 1a, the test tube was bolted to two separate columns and the columns were fixed in the wind tunnel by using adjustable supports. Herein, between the conflicting goals of ensuring the columns stability and the blockage ratio, a moderate column size (diameter = 76 mm) was chosen, yielding a moderate blockage ratio of 8.35% in the present test. To eliminate the effect of columns on flow conditions, two circular end plates with a diameter of 800 mm and a thickness of 6 mm were placed and fixed on both sides of the steel tube, as displayed in Figure 1b. To measure the VIV response of the steel tubes, the laser displacement meter (Type: IL-300, KEYENCE, Osaka, Japan) with a sampling frequency (fs) of 1000 Hz was used, which was layout in the center of the tube, and four accelerometers (fs = 1000 Hz) were set at the 1/8, 1/4, 3/8, and 1/2 in the length direction to test the vibration along the tube. Additionally, wind velocities and turbulence intensities were measured by the TFI cobra, which sets in front of the cylinder at the same height. In each of the tested wind speeds, the sampling duration was set as 60 s with a sampling frequency of 1000 Hz, and a total of 60,000 data were recorded.
2.2. Properties of Turbulent Flow
Turbulent flows were generated by uniform grids with various mesh sizes, as presented in Figure 2. Three uniform grids were placed in front of the test tube at the same distance of 6 m, resulting in three different turbulent intensities and length scales. Based on the wind speed data collected simultaneously during each vortex vibration test, the turbulence intensity (Iu) can be calculated by the formula Iu = û/ū, where û and ū are the standard deviation and mean of the flow velocity in the in-line (IF) direction. Additionally, the turbulent length scale (Lu) was obtained by fitting the measured wind speed spectra with the von-Karman spectrum [13] (as shown in Figure 3), in which the von Karman spectrum can be formulated as
where Suu(f) and f are the longitudinal turbulence spectra and frequency (in Hz), respectively.
Finally, the values of Iu and Lu can be obtained by averaging them for each case of wind velocity, as presented in Table 2.
2.3. Definition of Yaw Angles
Figure 4 shows the setup of the testing tube with a yaw angle. As shown in Figure 4a, the yaw angle (α) is defined as the angle between the axis of the tube with respect to the incoming flow. The normalized reduced velocity (V*) is used to define the axial component of the wind speed [18], which can be expressed as
where U* is the reduced velocity, defined as U* = ū/fnD.
Herein, four yaw angles (α = 10°, 20°, 30°, 40°) were considered, in which the typical case for α = 30° is shown in Figure 4b.
3. VIV of the Steel Tube in Uniform Flow
3.1. VIV Response
Figure 5 shows the variation in dimensionless amplitude A* (at the middle of the tube) versus reduced velocity U* in both the cross-flow (CF) direction and inline (IL) direction, in which A* = Amax/D, where Amax is the displacement amplitude of the response time history. In general, the VIV response curve in the CF direction shows a classic pattern of two branches [4], namely the initial branch and the lower branch, which is fairly similar to the cylinder that has a comparable mass ratio and damping ratio [3,13]. Furthermore, it can be seen that the VIV amplitude in the CF direction is significantly larger than that in the IL direction, and in particular, the maximum amplitude in the IL direction only accounts for around 20% of the CF direction. Consequently, the remainder of this paper will only discuss the VIV of the steel tube in the CF direction. As shown in Figure 5, the maximum dimensionless amplitude (A*max) of the steel tube is 0.00972, which is relatively smaller than that in the previous measurement [2]. Such a discrepancy is mainly attributed to the different structural configurations. In this test, the steel tube has twice as many bolts at the connection points as the previous experimental specimens, which accordingly leads to a smaller amplitude. Furthermore, it was found that the A*max here agrees well with the results of 0.0086 obtained by the semi-empirical formula [3].
Figure 6 presents the variation in the dimensionless frequency (f*) versus reduced velocity U*, in which f* = fex/fn, where fex and fn are the vortex shedding frequency and vibration frequency extracted from the spectrums of displacements, respectively. As shown in Figure 6, the lock-in phenomenon, where the vibration frequency controls the vortex shedding frequency (i.e., f* ≈ 1.0), occurs in the reduced velocity ranges from 4.5 to 5.0. The observed lock-in range is very close to that in the previous experiment [3], whereas it is relatively earlier compared to the results (5.0 ≤ U* ≤ 5.5) performed by Deng et al. [2]. Such a discrepancy may be caused by the experimental configuration and is not exactly consistent, e.g., the uniformity of the wind field and the roughness of the specimen. Furthermore, outside of the lock-in region, it can be seen that the vortex-shedding frequency approximately follows the so-called Strouhal rule, i.e., fex = Stū/D. In this work, the St is obtained as 0.21, which is similar to the results (0.20 ≤ St ≤ 0.21) found in the previous experiment [2].
Figure 7 shows the variation in the peak factor kp with U*, in which kp = Amax/Arms, where Arms is the root mean square (RMS) of the response time history. Overall, kp decreases first and then increases in the vicinity of the lock-in region, while it becomes relatively stable outside the lock-in interval. It can be seen that kp reaches a minimum value of 1.63 at U* = 4.88, which approaches the theoretical value of kp = 1.414 of a single sinusoidal process. When U* lies outside of the lock-in region, the peak factor increases significantly to around 3.5 to 4.0. These values are very close to the typical values of random processes, which indicates that the VIV response of the steel tube is similar to the random processes.
3.2. Time-Frequency Analysis of VIV Response
In this work, the VIV responses of the steel tube at five typical reduced velocities (see Figure 1) of 4.31, 4.70, 4.88, 5.05, and 5.18 in the vicinity of the lock-in region are further analyzed. Figure 8 shows the time-frequency analysis of VIV displacement of the steel tube at various U*. In each subgraph, the top, left and bottom parts represent the response time history, power spectrum density (PSD), and time-varying frequency spectrum, respectively.
As shown in Figure 8a, during the initial stage (U* = 4.31), the VIV response of the steel tube is quite small and irregular in terms of time history and time-varying frequency spectrum. It is clear in the PSD function that the frequency components of the vibration include the separate vortex shedding frequency and first-order natural frequency, in which the weight around the latter is greater than that of the former. According to Figure 8b, the response is significantly increased in the rising stage (U* = 4.70), which shows a relative regular fluctuation that is similar to the “beat”. In addition, it is clear that the vibration frequency has controlled the vortex-shedding frequency (f* = 1), i.e., the lock-in phenomenon occurs. Meanwhile, the energy around the first frequency becomes significantly concentrated, where the energy exhibits the typical narrow-band distribution. However, the components of the spectrum are unstable throughout the entire period, as indicated by the time-varying spectrum.
As the wind velocity increases, the maximum VIV response of the steel tubes reaches the maximum at U* = 4.88, as presented in Figure 8c. In this case, the response time history and time-varying frequency become quite stable throughout time. Additionally, the PSD function is more concentrated around the vibration frequency, and the energy components at both the high and low frequencies are obviously reduced. As depicted in Figure 8d, during the decreasing stage (U* = 5.05), the time-varying response in both the time and frequency becomes unstable again. In terms of PSD, the response exhibits two separated peak values, i.e., the vortex-shedding frequency and natural frequency, whereas the spectrum still has obvious narrow-band characteristics. Finally, as depicted in Figure 8e, the VIV response returns to a very tiny and irregular state, where no stable amplitude was developed throughout the entire testing period. Moreover, it can be seen in the PSD function that the frequency bandwidth of the energy distribution is dramatically expanded.
4. Effect of the Turbulence Intensity
4.1. Amplitude and Frequency
In the remainder of this paper, the turbulent flows are represented by their turbulence intensities (Iu) for simplicity. Figure 9 shows the variation in the dimensionless amplitude (A*) versus reduced velocity (U*) for different Iu. As depicted in Figure 9, the VIV response gradually decreases as the turbulence intensity increases. Similar to the response in the uniform flow (Iu = 0.4%), the VIV amplitude curve in the case of Iu = 5.9% exhibits the classical two branches, i.e., the initial branch and lower branch, although peak amplitude (0.00909) is slightly declined compared to the case of uniform flow (0.00915). However, the maximum amplitude significantly decreases to 0.00722 and 0.00611 in the case of Iu = 9.7% and Iu = 12.6%, respectively. This can be explained by the turbulent flow that would disturb the formation and shedding of the vortex. Moreover, it can be observed that the response curve does not present any sharp jumps after the peak amplitude, which is similar to the previous studies [2,13].
Figure 10 shows the variation in the dimensionless frequency (f*) versus reduced velocity (U*) for different Iu. Generally, the lock-in phenomenon occurs in all turbulence flows investigated here. In low turbulence (Iu = 5.9%) flow, the reduced velocity range of the lock-in region is approximately from 4.5 to 5.0, and the width and the onset velocity of the lock-in region are almost identical to that in the uniform flow condition. However, with further increases in turbulence, the widths of the lock-in region are significantly increased. In the case of Iu = 9.7% and Iu = 12.6%, the reduced velocities of the lock-in range are from 4.43 to 5.01 and from 4.65 to 5.64, respectively. Similarly, an increase in the VIV lock-in region of the steel tubes at high turbulence has been also observed in previous studies [2].
Interestingly, according to Figure 9 and Figure 10, it is found that the peak amplitude A*, together with the lock-in region towards to the lower U* for Iu = 9.7%, shifts to the larger U* in the case of Iu = 12.6%. The former may be due to the effect of turbulence, which increases the Strouhal number (St) of the system [12], thereby affecting the vortex-shedding frequency. This can be manifested in Figure 10 as a smaller onset wind speed of the lock-in for the case of Iu = 9.7%, which is similar to the that observed in the prior experiments with high turbulence (Iu = 10.2%) [2]. For the latter, it is observed in Figure 10 that the onset wind speed is almost constant for Iu = 12.6%, and the higher critical wind speed in Figure 9 may be related to the widening of the lock-in region, as the critical wind speed generally occurs in the middle of the lock-in region [3].
To further evaluate the effect of turbulence intensity on the VIV maximum amplitude, Figure 11 presents the variation in declined coefficient β versus turbulence intensity (Iu), where β is defined as the ratio of the peak amplitude in turbulence flows with that in the uniform flow. As shown in Figure 11, the β obtained in this work is very similar to that observed in the related study [2]. Obviously, the variation tendency of β with Iu can be reasonably fitted by the least-square method, namely
4.2. Response Characteristics
Figure 12 shows the variation in peak factor (kp) with U* at different Iu. It can be observed that kp tends to increase as the turbulence intensity grows. Compared to the uniform flow case, the minimum peak factor (kp,min) slightly grows from 1.64 to 1.80 and 1.88, in the case of Iu = 5.9% and Iu = 9.7%, respectively. In the case of Iu = 12.6%, kp,min increased sharply to 2.60 and the variation curve has multiple extreme points, which suggests that the high turbulence promotes the extreme levels of VIV response.
Figure 13 compares the displacement time history and PSD for different turbulence intensity (Iu) at the critical wind speed. As shown in Figure 13, in addition to the decline in amplitude, it is obvious that the time history becomes more unstable as the turbulence intensity increases. The PSD function shows that in low turbulence condition, the spectrum is fairly concentrated around f* = 1, which is very similar to the case of uniform flow (see Figure 8d). However, as the turbulence increases, the bandwidth around the fundamental frequency is gradually increased, associated with more noise components over the whole frequency range.
5. Effect of the Yaw Angle
5.1. Amplitude and Frequency
Figure 14 compares the variation in the dimensionless amplitude A* versus the normalized reduced velocities V* at five yaw angles (α = 0°, 10°, 20°, 30°, 40°). It should be noted that the tests were conducted under approximately uniform flow conditions, where the turbulence intensity Iu < 0.4%. As shown in Figure 14, in the case of α = 10° and α = 20°, the maximum amplitude almost remains the same as that observed in the normal-incidence case (α = 0°), indicating that the inclination of the steel tube may not cause any change in displacement response in relatively small yaw angles (α ≤ 20°). However, the VIV response significantly decreases as the yaw angles increase to 30° and 40°, where the maximum amplitude reduces by 30% and 40%, respectively, compared to that in the normal-incidence case. This can be attributed to the excessive axial velocity component of the flow, which disturbs the regularity of the vortex-shedding. Similarly, this declined tendency of VIV amplitude in large yaw angles was observed in the previous investigation [15,16,17,18]. Interestingly, in the case of α = 40°, the response curve obviously differs from the classical initial and lower branch, where the large vibration is maintained within a relatively long wind speed range.
Figure 15 presents the variation in dimensionless frequency (f*) versus V* at different yaw angles. As shown in Figure 15, the lock-in phenomenon was observed for all cases, and the frequency response of the steel tube follows the Strouhal rule during the outsides of the lock-in region. It is observed that the onset velocity (around V* = 4.67) of lock-in regions is almost unchanged, whereas the length of the lock-in interval varies significantly for different angles of inclination. Specifically, the width of the lock-in region gradually becomes broader as the yaw angle increases, except in the case of α = 10°.
Therefore, according to the above results, it can be concluded that when α ≤ 10°, the independence principle (IP) [21] is applicable for steel tubes in terms of both response amplitude and frequency.
5.2. Response Characteristics
Figure 16 shows the variation in the peak factor (kp) versus V* at different yaw angles. As shown in Figure 16, the minimum peak factor (kp,min) almost remains the same around 1.64 for small yaw angles (α ≤ 20°), which increases slightly to 1.75 at α = 30° and sharply to 2.25 in the case of α = 30°. In addition, it can be seen that the variation curve of the peak factor tends to be irregular as the yaw angle increases, in which multiple extreme points are observed in the lock-in region in the case of α = 40°, which further indicates that the displacement response of the steel tubes becomes more unstable as the yaw angle increases.
Figure 17 compares the dimensionless displacement time histories and PSD for different angles at their critical wind speeds. It can be seen that the displacement time histories in the case of α = 10° and α = 20° have a similar characteristic compared to that in the normal-incidence case (see Figure 8a), which exhibits relatively stable amplitude in tested periods. In the case of α = 30°, the response time history becomes slightly non-stable, in which the local peaks are more pronounced. As the yaw angle increased to 40°, it can be seen that the steel tube failed to develop a stable vibration and that the magnitude of the response changed dramatically throughout the test period.
6. Conclusions
A series of wind tunnel tests were performed to investigate the VIV of steel tubes in transmission towers at various inflow conditions. The VIV response of the steel tube in the uniform, turbulent (Iu = 5.9%, 9.7%, and 12.6%), and inclined (α = 10°, 20°, 30°, and 40°) flow conditions were investigated. The main results are listed as follows.
- (1)
- Compared to the VIV in the CF direction, the VIV response in the IL direction is negligible. In particular, the VIV maximum amplitude of the steel tube in the IF direction only accounts for about 20% compared to that in the CF direction.
- (2)
- The VIV amplitude of the steel tube decreases significantly as the turbulence intensity increases and the decreasing trends can be reasonably fitted by the quadratic function. The width lock-in region was found to be wider in turbulence compared to that in uniform flows.
- (3)
- Compared with the normal-incidence case, the VIV maximum amplitude almost remains constant in the case of α = 10° and α = 20°, while it decreased sharply for α = 30° and 40°. Moreover, the width lock-in region gradually increases as the angle of inclination increases, except for α = 10°, while the onset velocities of the lock-in region are similar for all cases.
- (4)
- When α ≤ 10°, the independence principle (IP) is applicable for inclined steel tubes in terms of both response amplitude and frequency.
Author Contributions
Conceptualization, Z.L. and Z.W.; methodology, J.L.; software, J.L.; validation, Z.L., Z.W. and S.L.; formal analysis, J.L. and S.L.; investigation, Z.L.; resources, S.L.; data curation, J.L.; writing—original draft preparation, J.L.; writing—review and editing, Z.L.; visualization, Z.W.; supervision, Z.W. and S.L.; project administration, Z.L.; funding acquisition, Z.L. All authors have read and agreed to the published version of the manuscript.
Funding
The research presented in this paper was conducted with the support of the State Power Economic Research Institute of State Grid of China (Grant No. 5200-202156071A-0-0-00).
Data Availability Statement
Not applicable.
Conflicts of Interest
The authors declare no conflict of interest.
References
- Zhang, D.; Hu, X.; Song, X.; Deng, H.; Ma, X. Investigation on aerodynamic characteristics for steel tubular cross-arms of transmission tower under skew wind. J. Wind Eng. Ind. Aerodyn. 2022, 222, 104914. [Google Scholar] [CrossRef]
- Deng, H.Z.; Jiang, Q.; Li, F.; Wu, Y. Vortex-induced vibration tests of circular cylinders connected with typical joints in transmission towers. J. Wind Eng. Ind. Aerodyn. 2011, 99, 1069–1078. [Google Scholar] [CrossRef]
- Huang, M.F.; Zhang, B.Y.; Guo, Y.; Huan, R.H.; Lou, W.J. Prediction and Suppression of Vortex-Induced Vibration for Steel Tubes with Bolted Joints in Tubular Transmission Towers. J. Struct. Eng. 2021, 147, 04021128. [Google Scholar] [CrossRef]
- Yang, J.B.; Li, Z. Breeze Vibration of Transmission Steel Tubular Tower and Its Effects on Structure Safety. J. Vib. Meas. Diagn. 2008, 27, 23–30. (In Chinese) [Google Scholar]
- Fu, X.; Jiang, Y.; Li, H.N.; Li, J.X.; Xie, W.P.; Yang, L.D.; Zhang, J. Vortex-induced vibration and countermeasure of a tubular transmission tower. Int. J. Struct. Stab. Dyn. 2021, 21, 2150163. [Google Scholar] [CrossRef]
- Fu, X.; Jiang, Y.; Du, W.L.; Yan, B.W. A New Radial Spoiler for Suppressing Vortex-Induced Vibration of a Tubular Tower and Its Practical Design Method. Shock Vib. 2021, 2021, 6971178. [Google Scholar] [CrossRef]
- Basu, R.I. Aerodynamic forces on structures of circular cross-section. Part 2. The influence of turbulence and three-dimensional effects. J. Wind Eng. Ind. Aerodyn. 1986, 24, 33–59. [Google Scholar] [CrossRef]
- Surry, D. Some effects of intense turbulence on the aerodynamics of a circular cylinder at subcritical Reynolds number. J. Fluid Mech. 1972, 52, 543–563. [Google Scholar] [CrossRef]
- West, G.S.; Apelt, C.J. Measurements of fluctuating pressures and forces on a circular cylinder in the reynolds number range 104 to 2.5 × 10⁵. J. Fluids Struct. 1993, 7, 227–244. [Google Scholar] [CrossRef]
- Blackburn, H.M.; Melbourne, W.H. The effect of free-stream turbulence on sectional lift forces on a circular cylinder. J. Fluid Mech. 1996, 306, 267–292. [Google Scholar] [CrossRef] [Green Version]
- Blackburn, H.M.; Melbourne, W.H. Sectional lift forces for an oscillating circular cylinder in smooth and turbulent flows. J. Fluids Struct. 1997, 11, 413–431. [Google Scholar] [CrossRef]
- So, R.M.C.; Wang, X.Q.; Xie, W.C.; Zhu, J. Free-stream turbulence effects on vortex-induced vibration and flow-induced force of an elastic cylinder. J. Fluids Struct. 2008, 24, 481–495. [Google Scholar] [CrossRef]
- Pastò, S. Vortex-induced vibrations of a circular cylinder in laminar and turbulent flows. J. Fluids Struct. 2008, 24, 977–993. [Google Scholar] [CrossRef]
- Ramberg, S.E. The effects of yaw and finite length upon the vortex wakes of stationary and vibrating circular cylinders. J. Fluid Mech. 1983, 128, 81–107. [Google Scholar] [CrossRef]
- Jain, A.; Modarres-Sadeghi, Y. Vortex-induced vibrations of a flexibly-mounted inclined cylinder. J. Fluids Struct. 2013, 43, 28–40. [Google Scholar] [CrossRef]
- Lucor, D.; Karniadakis, G.E. Effects of oblique inflow in vortex-induced vibrations. Flow Turbul. Combust. 2003, 71, 375–389. [Google Scholar] [CrossRef]
- Franzini, G.R.; Fujarra, A.L.C.; Meneghini, J.R.; Korkischko, I.; Franciss, R. Experimental investigation of vortex-induced vibration on rigid, smooth and inclined cylinders. J. Fluids Struct. 2009, 25, 742–750. [Google Scholar] [CrossRef]
- Franzini, G.R.; Gonçalves, R.T.; Meneghini, J.R.; Fujarra, A.L.C. One and two degrees-of-freedom Vortex-Induced Vibration experiments with yawed cylinders. J. Fluids Struct. 2013, 42, 401–420. [Google Scholar] [CrossRef]
- Wang, B.; Zhang, M.; Xu, F. Experimental investigation on the vortex-induced vibration of a rectangular 4: 1 cylinder under skew winds. J. Wind Eng. Ind. Aerodyn. 2022, 229, 105114. [Google Scholar] [CrossRef]
- Seyed-Aghazadeh, B.; Modarres-Sadeghi, Y. An experimental study to investigate the validity of the independence principle for vortex-induced vibration of a flexible cylinder over a range of angles of inclination. J. Fluids Struct. 2018, 78, 343–355. [Google Scholar] [CrossRef]
- Xu, W.; Ma, Y.; Ji, C.; Sun, C. Laboratory measurements of vortex-induced vibrations of a yawed flexible cylinder at different yaw angles. Ocean. Eng. 2018, 154, 27–42. [Google Scholar] [CrossRef]
Figure 1.
The overall experimental setups. (a) C-shaped connection joints; (b) Overall view.

Figure 2.
Uniform grids for generating turbulence flows. (a) Grid1; (b) Grid2; (c) Grid3.

Figure 3.
Typical longitudinal turbulence spectra (Suu).

Figure 4.
Definition the yaw angle and yawed steel tubes. (a) Definition the yaw angle (top view); (b) Yawed steel tubes.
Figure 4.
Definition the yaw angle and yawed steel tubes. (a) Definition the yaw angle (top view); (b) Yawed steel tubes.

Figure 5.
Variation in dimensionless amplitude with reduced velocity.

Figure 6.
Variation in dimensionless frequency (f*) versus reduced velocity (U*).

Figure 7.
Variation in the peak factor (kp) versus reduced velocity (U*).

Figure 8.
The time-frequency analysis of displacement of the steel tube at various U*. (a) Initial stage (U* = 4.31); (b) Rising stage (U* = 4.70); (c) Stable stage (U* = 4.88); (d) Declining stage (U* = 5.05); (e) End stage (U* = 5.18).
Figure 8.
The time-frequency analysis of displacement of the steel tube at various U*. (a) Initial stage (U* = 4.31); (b) Rising stage (U* = 4.70); (c) Stable stage (U* = 4.88); (d) Declining stage (U* = 5.05); (e) End stage (U* = 5.18).


Figure 9.
The variation in A* versus U* for different Iu.

Figure 10.
Variation in f* versus U* for different Iu.

Figure 11.
The variation of declined coefficient β versus U* for different Iu. (■ denotes the experiment conducted by Deng et al. [2]).
Figure 11.
The variation of declined coefficient β versus U* for different Iu. (■ denotes the experiment conducted by Deng et al. [2]).

Figure 12.
The variation in kp versus U* for different Iu.

Figure 13.
Comparison of the dimensionless displacement time histories and PSD for different turbulence intensity (Iu) at the critical wind speed. (a) Iu = 5.9% (U* = 4.86); (b) Iu = 9.7% (U* = 4.73); (c) Iu = 12.6% (U* = 5.36).
Figure 13.
Comparison of the dimensionless displacement time histories and PSD for different turbulence intensity (Iu) at the critical wind speed. (a) Iu = 5.9% (U* = 4.86); (b) Iu = 9.7% (U* = 4.73); (c) Iu = 12.6% (U* = 5.36).

Figure 14.
The variation in A* versus V* for different α.

Figure 15.
The variation in f* versus V* for different α.

Figure 16.
The variation in kp versus V* for different α.

Figure 17.
Comparison of the dimensionless displacement time histories and PSD for different yawed angles (α) at the critical wind speeds. (a) α = 10° (V* = 5.02); (b) α = 20° (V* = 5.11); (c) α = 30° (V* = 4.93); (d) α = 40° (V* = 5.35).
Figure 17.
Comparison of the dimensionless displacement time histories and PSD for different yawed angles (α) at the critical wind speeds. (a) α = 10° (V* = 5.02); (b) α = 20° (V* = 5.11); (c) α = 30° (V* = 4.93); (d) α = 40° (V* = 5.35).


Table 1.
Main physical parameters of the test tubes.
| Terms | Units | Values |
|---|---|---|
| Diameter (D) | m | 0.042 |
| Thickness (t) | m | 0.0012 |
| Unit mass (m) | kg/m | 1.2 |
| Length (l0) | m | 2.08 |
| Frequency (fn) | Hz | 30.42 |
| Mass ratio (M*) | - | 711 |
| Damping ratio (ξ) | - | 0.0032 |
Notes: the frequency and damping ratio were determined by the decay test in the air. The mass ratio was calculated as M* = 4m/πρD2, where ρ = 1.225 kg/m3 is the air density.
Table 2.
Properties of turbulence flow.
| Flow | Iu (%) | Lu/D |
|---|---|---|
| Uniform flow | 0.4 | - |
| Low turbulence (Grid1) | 5.9 | 3.37 |
| Medium turbulence (Grid2) | 9.7 | 5.76 |
| High turbulence (Grid3) | 12.6 | 6.39 |
Disclaimer/Publisher’s Note: The statements, opinions and data contained in all publications are solely those of the individual author(s) and contributor(s) and not of MDPI and/or the editor(s). MDPI and/or the editor(s) disclaim responsibility for any injury to people or property resulting from any ideas, methods, instructions or products referred to in the content. |
© 2023 by the authors. Licensee MDPI, Basel, Switzerland. This article is an open access article distributed under the terms and conditions of the Creative Commons Attribution (CC BY) license (https://creativecommons.org/licenses/by/4.0/).
Share and Cite
MDPI and ACS Style
Li, Z.; Wang, Z.; Li, J.; Liu, S. Experimental Study on Vortex-Induced Vibration of Steel Tubes in Transmission Towers at Various Inflow Conditions. Buildings 2023, 13, 252. https://doi.org/10.3390/buildings13010252
AMA Style
Li Z, Wang Z, Li J, Liu S. Experimental Study on Vortex-Induced Vibration of Steel Tubes in Transmission Towers at Various Inflow Conditions. Buildings. 2023; 13(1):252. https://doi.org/10.3390/buildings13010252
Chicago/Turabian StyleLi, Zhengliang, Zhisong Wang, Jiahong Li, and Siyuan Liu. 2023. "Experimental Study on Vortex-Induced Vibration of Steel Tubes in Transmission Towers at Various Inflow Conditions" Buildings 13, no. 1: 252. https://doi.org/10.3390/buildings13010252
Note that from the first issue of 2016, this journal uses article numbers instead of page numbers. See further details here.