
Silver Thread-Based Microfluidic Platform for Detection of Essential Oils Using Impedance Spectroscopy


1
Naturality Research & Development, 08221 Terrassa, Spain
2
Curtin Medical School, Curtin Health Innovation Research Institute, Curtin University, Bentley, Perth, WA 6102, Australia
3
Faculty of Technical Sciences, University of Novi Sad, 21000 Novi Sad, Serbia
*
Author to whom correspondence should be addressed.
Appl. Sci. 2022, 12(7), 3596; https://doi.org/10.3390/app12073596
Submission received: 20 February 2022
/
Revised: 28 March 2022
/
Accepted: 29 March 2022
/
Published: 1 April 2022
Abstract
:Essential oils (EOs) have a long tradition of use in the medical and cosmetic fields based on their versatile properties, including fungicidal, antiparasitic, and bactericidal effects. Nowadays, with the development of industry and electronics, EOs are increasingly being used in the agricultural and food industries; health industries, including pharmacy and dental medicine; and as cosmetic enhancements. The purpose of this study is to develop a compact and portable platform for the detection of EO type and the concentration levels using knitted silver threads. The method is based on measuring the variation in values of the electrical parameters of the silver threads using electrochemical impedance spectroscopy (EIS). The impedance of the solutions applied on the testing platform was measured in the frequency range from 1 Hz to 200 kHz. The platform was tested using three types of essential oils: tea tree; clary sage; and cinnamon bark oil. Increasing the concentration of essential oils resulted in increasing the electrical resistance of the platform, decreasing the capacitance, and consequently increasing the impedance. The proposed cost-effective platform can be used for the fast determination of the type and quality of essential oils.
1. Introduction
Advances in different sensor fabrication technologies and versatile materials with flexible mechanical, electrical, and thermal properties have enabled the development of various kinds of lab-on-a-chip devices. Textile materials have emerged as cutting-edge transducer materials which can be integrated with microelectronics to give rise to nonconventional functional sensing devices, light-emitting devices, circuit boards, batteries, supercapacitors, solar cells, memory devices, etc. [1,2]. In the medical field, textile substrates act as sophisticated supporting structures in drug delivery devices for the controlled release of biologically active compounds from essential oils (EOs) [3,4]. The combined application of textiles with different EOs leads to the development of functional fabrics, such as antimicrobial textiles, medicinal textiles, fragrant textiles, and insect-repellent textiles [5,6]. For example, lavender, thymol, savory, and cinnamon bark EOs were used in concentrations from 1 to 5% to stimulate antimicrobial activity in polylactic acid fabric [7]. Additionally, cinnamon EO was demonstrated to be a good inhibitor for fungal and bacterial growth in heritage textiles [8]. Lime (C. aurantifolia) EO was used to functionalize cotton fabric which possessed antibacterial activities [9].
EOs are complex mixtures of plant-derived compounds which possess various antioxidant and antimicrobial properties. EOs are biodegradable; environmentally friendly; and have found numerous applications in the medicine, pharmaceutical, agricultural, and food industries [10,11,12]. Furthermore, the versatile and complex composition of EOs allows them to be potentially used in the metal and electronics industry. For example, rosemary, myrtle, and garlic EOs were used as anti-corrosive agents for copper [13,14], while orange peel EO was used as the main component of heavy metal sensors [15]. Moreover, EOs derived from surfactants are good ecological and economical alternatives to petrochemical-based detergents [16].
Thus, checking the authenticity and quality of EOs is imperative. However, current methods used for assessing the quality of EO include gas chromatography and mass spectroscopy, which are expensive and time-consuming techniques that require highly trained personnel to operate the equipment [17]. To mitigate this, continuous efforts have been made to make the identification and characterization of EOs simpler and more accessible. Kamradi et al. assessed thyme EO vapors based on the quantitative release rates from EO-impregnated nanofibers [12]. Jjunju et al. developed a technique for the in-situ analysis of EO by combining a transferable mass spectrometer with a direct inlet membrane [18]. Graboski et al. proposed an alternative method for the detection of major compounds within clove essential oil using an electronic nose coupled with polymeric nanocomposite films [19]. Sudarmaji et al. used metal oxide semiconductor (MOS) gas sensors with a temperature modulation-specified detection point technique to assess the vapors of different EOs [20]. Furthermore, the compatibility of textiles and essential oils extends the possibilities of future applications of textile-based chips in electrical measurements. Electrochemical impedance spectroscopy (EIS) is one of the well-known electrical techniques used for monitoring electrochemical processes for a variety of applications. The dielectric properties of tested essential oils or water–oil mixtures are shown as a function of radiofrequency. EIS allows for the identification of different contributors in mixtures and the continuous monitoring of time-dependent water–oil dynamics [21,22].
In this study, we proposed a silver threads-based portable textile platform for the identification of different essential oil types and their concentrations using EIS. The essential oils evaluated in this study were tea tree oil, clary sage, and cinnamon essential oil. These EOs are still insufficiently researched in the scientific world. However, since they are the most commonly available EOs and are used for a variety of purposes, including medical, cosmetical, industrial, and agricultural, there is a great need for more information. Some of the uses of tea tree oil are as an antiseptic, as hand sanitizer, as an insect repellent, and to fight acne. Clary sage has been shown to be effective in skin and hair care, and the treatment of depression, anxiety, mental exhaustion, and pain during menstrual cycles. Cinnamon bark oil supports healthy metabolic function, helps maintain a healthy immune system when taken internally, naturally repels insects, and has long been used to flavor food. In this study, different concentrations of essential oils were analyzed, which had an influence on the electrical performances of knitted conductive textile electrodes embedded in the microfluidic chip. The fabricated textile sensor had great promise as a suitable platform for the electrical investigation of different complex biological and herbal mixtures for a plethora of potential applications in the field of medicine.
2. Materials and Methods
2.1. Materials and Instruments
For the fabrication of a textile-based microfluidic platform, conductive SilverTech 1000 (30 tex 96) threads were purchased from the Amann group (Bonnigheim, Germany) [23] and transparent A4 polyvinyl chloride (PVC) lamination foils of 80 µm and 250 µm (MBL® 80MIC and MBL® 250MIC) thicknesses were provided by Minoan Binding Laminating doo, Belgrade, Serbia. Tea tree (Melaleuca alternifolia), clary sage (Salvia sclarea), and cinnamon bark (Cinnamomum zeylanicum) essential oils were provided by the Oshadi brand (AYUS, Buhl, Germany). Moreover, deionized water (Grade 2 by ISO 3696, 1987) and ethanol (Laboratorija doo, Novi Sad, Serbia) were used to prepare different concentrations of EO solutions. A cutter plotter (Graphtec CE6000-60 PLUS, Graphtec America, Inc., Irvine, CA, USA) with a 45° cutting blade (CB09U) was applied to fabricate the device. Lamination of different components of the microfluidic device was carried out using an A4 card laminator (FG320, Minoan Binding Laminating doo, Belgrade, Serbia). The design of the microfluidic device was performed in AutoCAD (Autodesk, 2021). Scanning electron microscopy (SEM) of silver threads was performed using TM3030 (Hitachi, Tokyo, Japan) at an accelerating voltage of 10 kV. Electrical measurements of EOs were performed by electrochemical impedance spectroscopy (EIS) using the Palmsense4 (Houten, Netherlands) with PSTrace 5.8 software (Houten, The Netherlands).
2.2. Design and Fabrication of Textile-Based Microfluidic Sensing Platform
The multilayered textile-based microfluidic platform used for the identification of essential oil type was composed of knitted silver conductive threads, which acted as electrodes, and PVC foils, which were used to fabricate the device using xurography. The total dimensions of the platform were 50 mm in length and 30 mm in width. At the top layer, there was an inlet with a diameter of 4 mm that was used for introducing a small sample volume of studied EOs. In the channel of this microfluidic platform, the textile part of the structure was knitted from a conductive silver thread in a shape that created a four-terminal structure, as shown in Figure 1a. The total length and width of this knitted structure were 40 mm × 40 mm, respectively. The central part of the textile structure was 10 mm in width, whereas the width of the four terminals, for the electrical connection of crocodile clips, was 5 mm. Two layers of 80 μm-thick PVC foil were used to support the top and bottom layers of the silver textile electrode. In the middle of the structure, five layers of PVC foil with 250 μm thicknesses were used. These were laminated together at a temperature of 150 °C. As a final step of fabrication, the whole component with all of the layers and a textile electrode structure was laminated at 150 °C. The SEM images of the silver-coated polyamide threads can be seen in Figure 1b.
2.3. Preparation of Essential Oil Solutions
To evaluate the electrical performances of tea tree, clary sage, and cinnamon bark EOs with the fabricated textile-based microfluidic chip sensor, different concentrations of EO solutions were prepared. Briefly, 0.2% solutions of cinnamon bark, tea tree, and clary sage essentials oils were prepared in 10% ethanol solution containing distilled water (v/v), followed by ultra-sonication for 20 min at room temperature. Here, ethanol was used to solubilize essential oils into the water so that the formulation was blended homogeneously, ensuring that the composition was not separated into distinct ingredients. Additionally, 4% and 10% solutions of these EOs were also prepared.
2.4. Experimental Setup
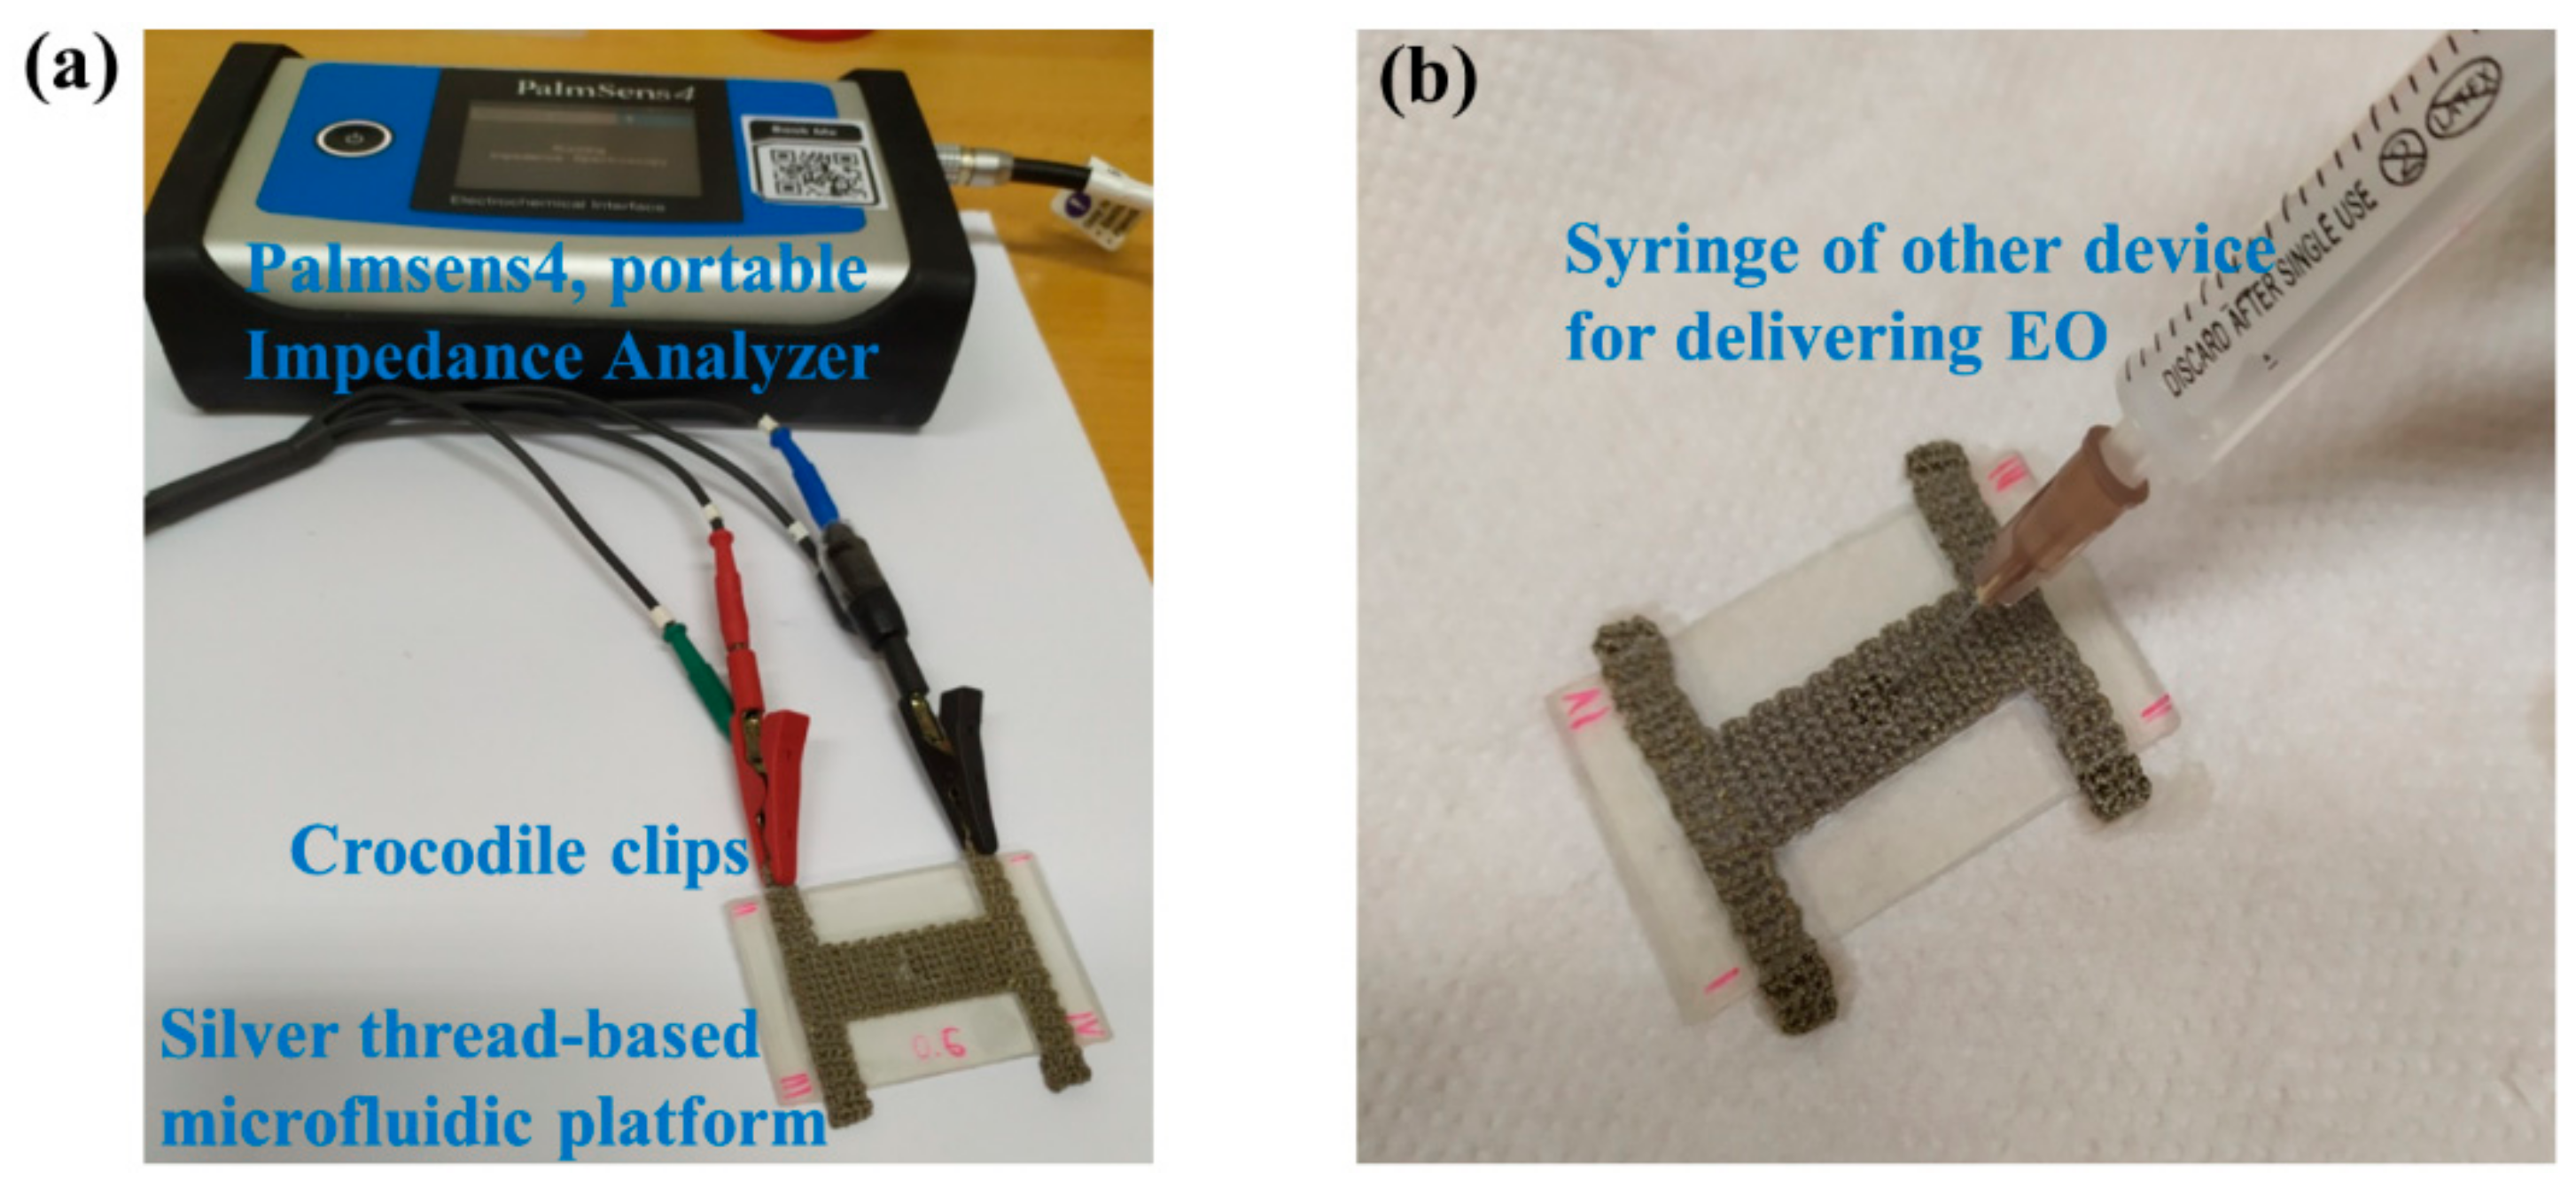
The experimental setup used for performing EIS measurements is illustrated in Figure 2a. It consisted of a PalmSens4 device connected to the laptop via Bluetooth. The fabricated textile-based microfluidic sensing platform was connected to the electrochemical interface through the electrode terminals with the help of counter (CE) and working (WE) electrodes, which can be clearly seen in Figure 2a. The real and imaginary parts of the impedance were measured in the frequency range from 1 Hz to 200 kHz at 54 measuring points. A special syringe and needle were used to inject EOs onto the sensing platform (Figure 2b). After applying EOs (400 μL) through the hole of the sensing platform, we waited 3 min for the solution to be distributed throughout the textile structure and to reach the terminals (noticeable change in the color of textile electrodes). All measurements were performed at room temperature (25 ± 1 °C).
3. Results and Discussion
3.1. GCMS Measurements
The analysis of the commercial essential oils used in this study was performed using gas chromatography (Agilent 7890B, Santa Clara, CA, USA) with an electron-ionization mass-selective detector (Agilent Technologies 5977A, Santa Clara, CA, USA). A sample was dissolved 10,000 times in n-hexane and injected (2 µL) into a split/splitless inlet at 220 °C. The carrier gas, helium (purity 99.999%), was used with a constant flow of 1.0 mL/min. The compounds were separated on an Agilent Technologies HP-5MS column (30 m × 0.25 mm × 0.25 µm) using the following temperature program: start at 60 °C, 3 °C/min to 246 °C. The total run time was 62 min. Eluate was delivered to the mass spectrometer via a transfer line held at 240 °C. Ion source temperature was maintained at 230 °C, electron energy at 70 eV, and quadrupole temperature at 150 °C. Data were acquired in scan mode (m/z range 40–400). The compounds were identified by mass spectra comparison with libraries (NIST/EPA/NIH Mass Spectral Library 05 and Mass Hunter workstation Software, Unknown Analysis). The n-alkane mixture, consisting of a mixture of C9–C28 n-alkanes corresponding to 820–2800 KI, was used as a standard for the determination of retention indices. Relative amounts of components, expressed in percentages (%), were calculated by normalization measurement according to the peak area in the total ion chromatogram. The results of the GCMS measurements can be found in the Supplementary Materials (Chromatograms of cinnamon bark, clary sage and tea tree, table with list of compounds).
3.2. EIS Measurements
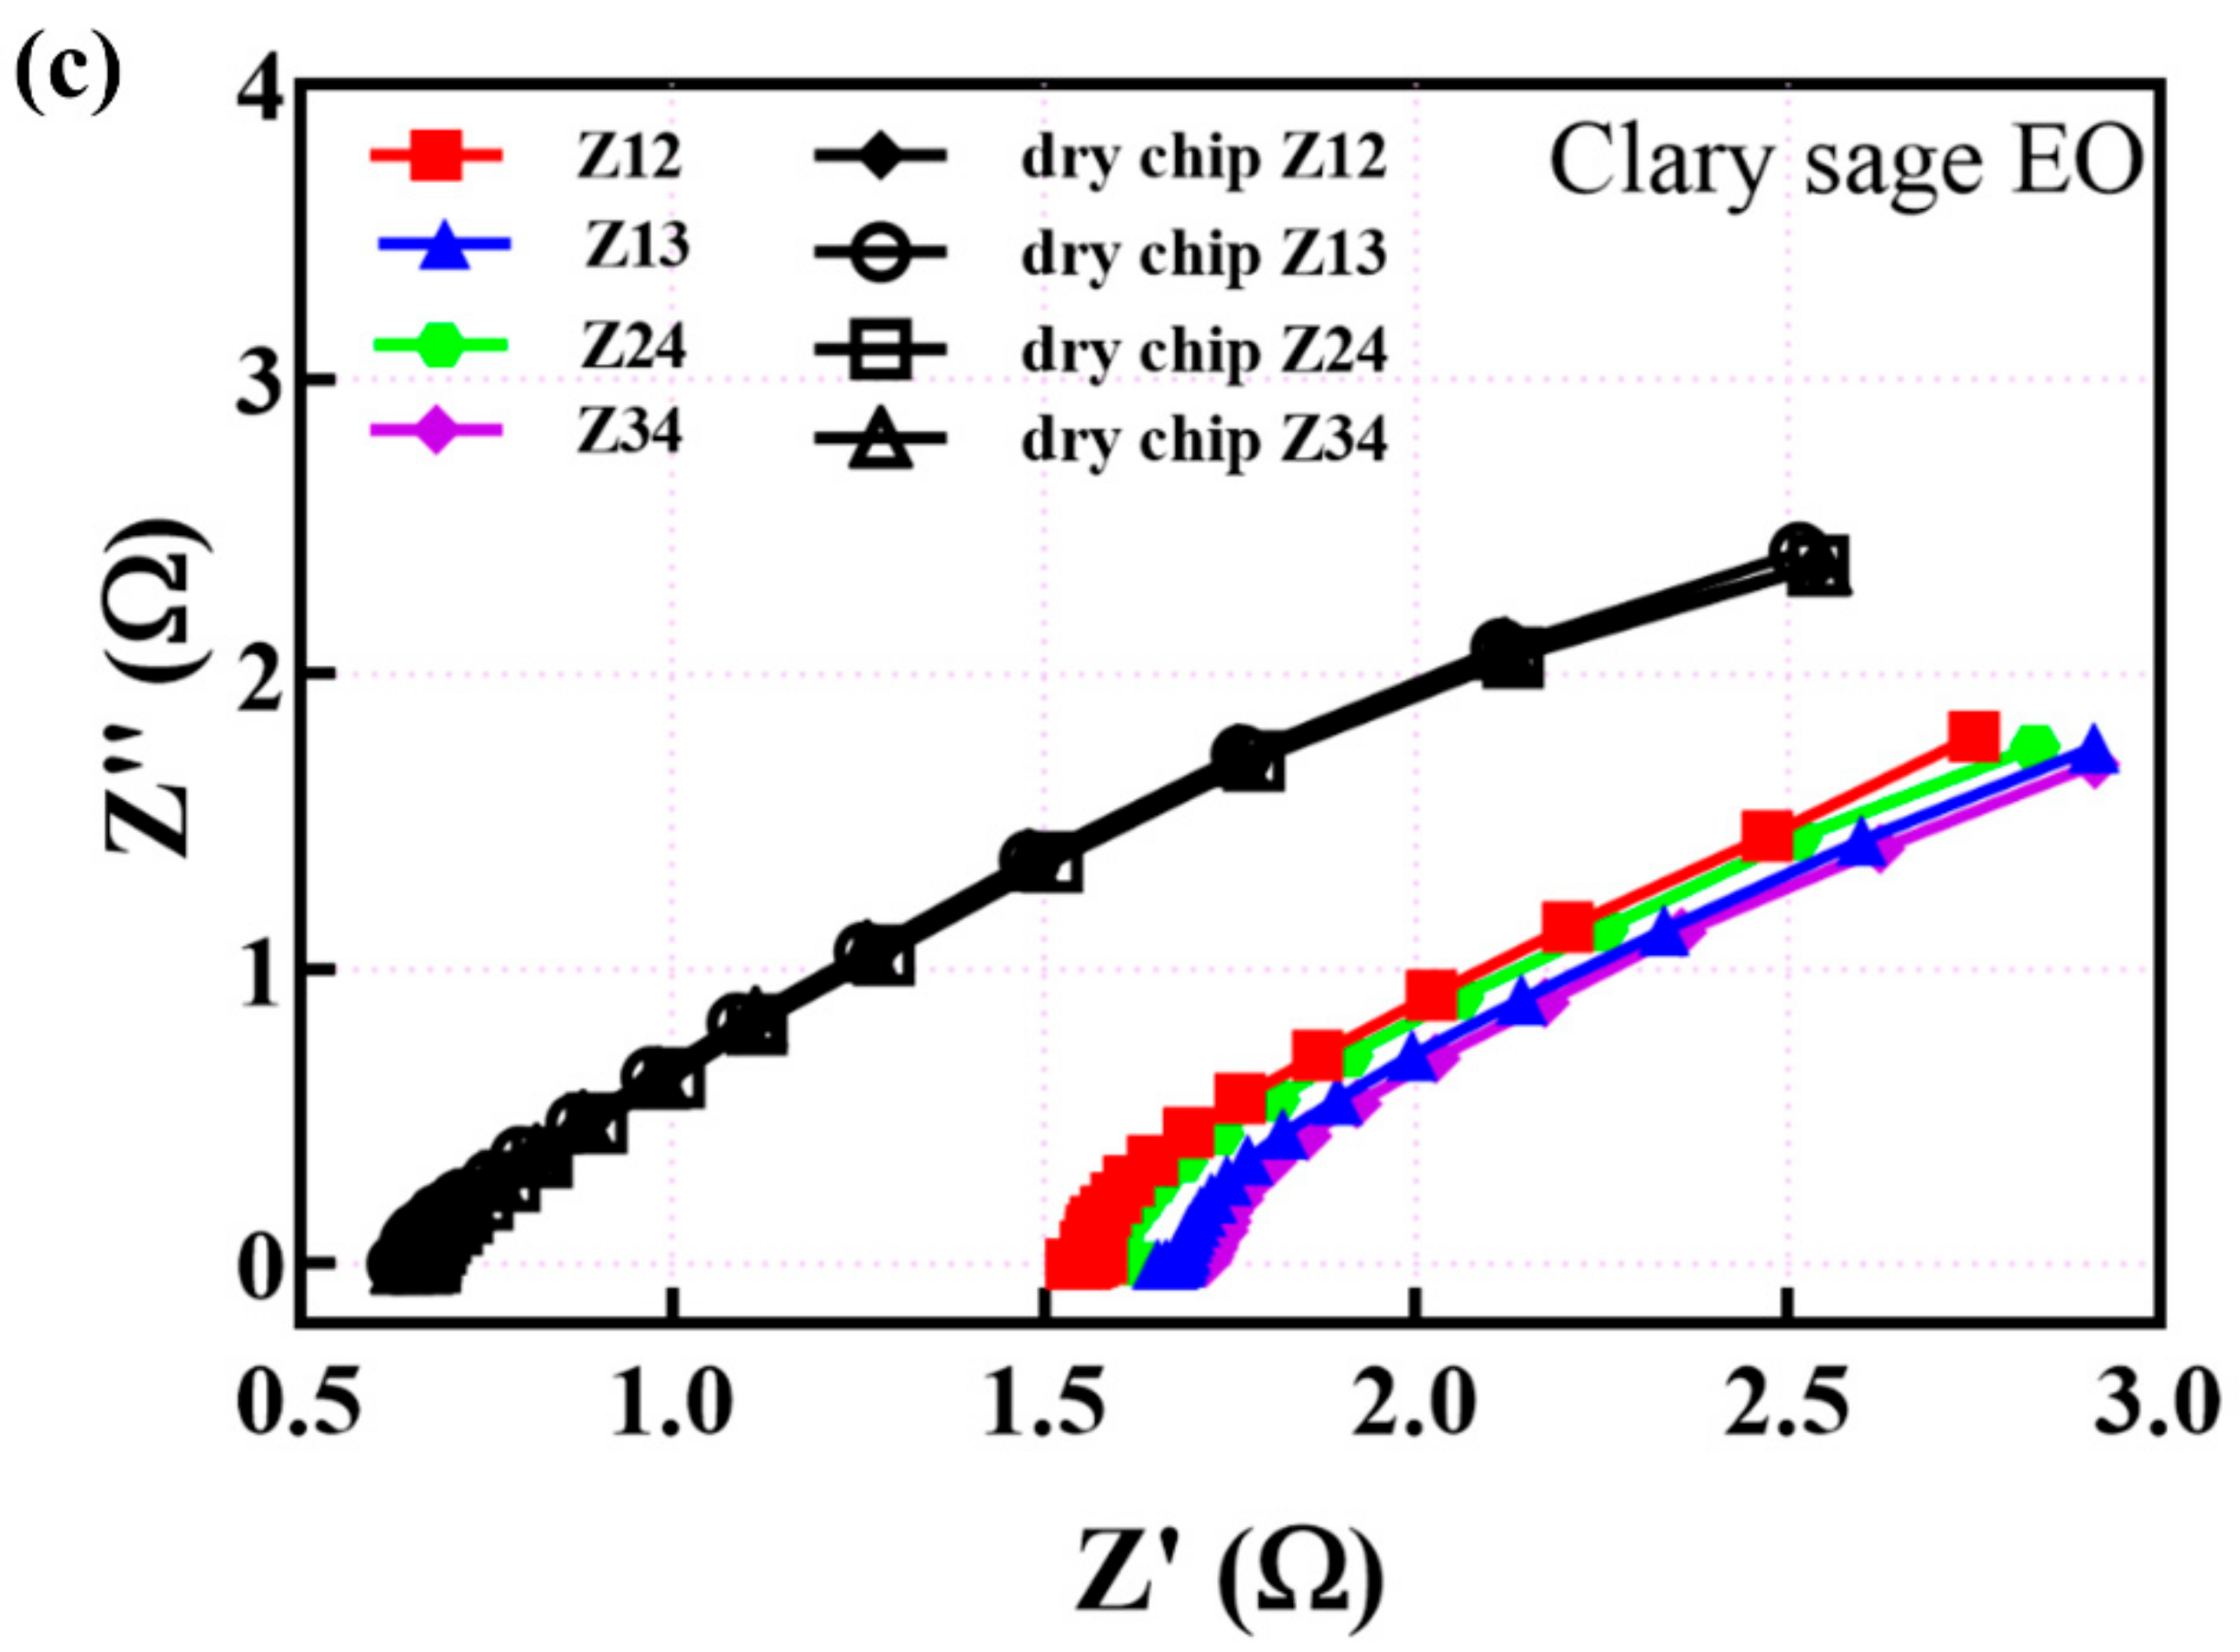
The impedance measurements were performed on our fabricated textile-based microfluidic platform for each type of EO in different concentrations. Firstly, a dry platform (dry chip) was applied without delivering any solution, followed by the application of EOs to detect differences in the modulus of impedance. The tea tree, clary sage, and cinnamon bark EOs, at 0.2% concentrations, were studied. Figure 3 presents Nyquist plots of the studied EOs, presenting an imaginary part of impedance (Z”) as a function of a real part of impedance (Z’) measured at four terminals, as labeled in Figure 1 (at the same sides, Z12 and Z24, and diagonally, Z13 and Z24).
It can be concluded from Figure 3 that the injection of EOs resulted in increasing the real part of the electrical impedance compared to the dry textile chip. Minor differences in impedance at different terminals are a consequence of the different distances between contacts on the one side and contacts on diagonal sides. Moreover, this small difference can be attributed to the non-ideal distribution of the applied solution in the knitted silver thread structure. However, this difference in impedance is negligible and, in further steps of our study, the results obtained between terminals 1 and 3 (labels shown in Figure 1)—Z13, will be shown.
In addition to the visual differentiation in the Nyquist plots between tested EOs, for the development of a portable measurement device with limited processing capabilities, we propose the use of the root-mean-square deviation (RMSD) of the real part of the impedance. The result is a scalar value that can easily be used to compare EOs when compared to the baseline (dry sample). The RMSD for the real part of the impedance is defined as:
where the real part of the impedance of the first measurement (dry chip) is Re(Yi,1), the real part of impedance for different solutions is Re(Yi,2), and N is the number of measurement points in frequency sweep. Normally, RMSD values are used in the field of protein structure studies as a quantitative measure of similarity between two or more protein structures [24,25]. However, in our study the significance of RMSD calculations is based on the fact that RMSD elements are estimated for each measurement point, requiring small memory resources. Therefore, high memory demand is eliminated, as there is no need for a buffer to store and process all data points simultaneously. Moreover, as it is a scalar value it does not require the graphical analysis of the complete dataset. Finally, the RMSD values obtained during the calibration process can be easily stored in the microcontroller’s internal memory for the fast in situ differentiation of various EOs. Calculated RMSD values in the frequency range from 100 Hz to 10 kHz were 55.37 for clary sage, 34.66 for tea tree, and 34.03 for cinnamon bark EOs.
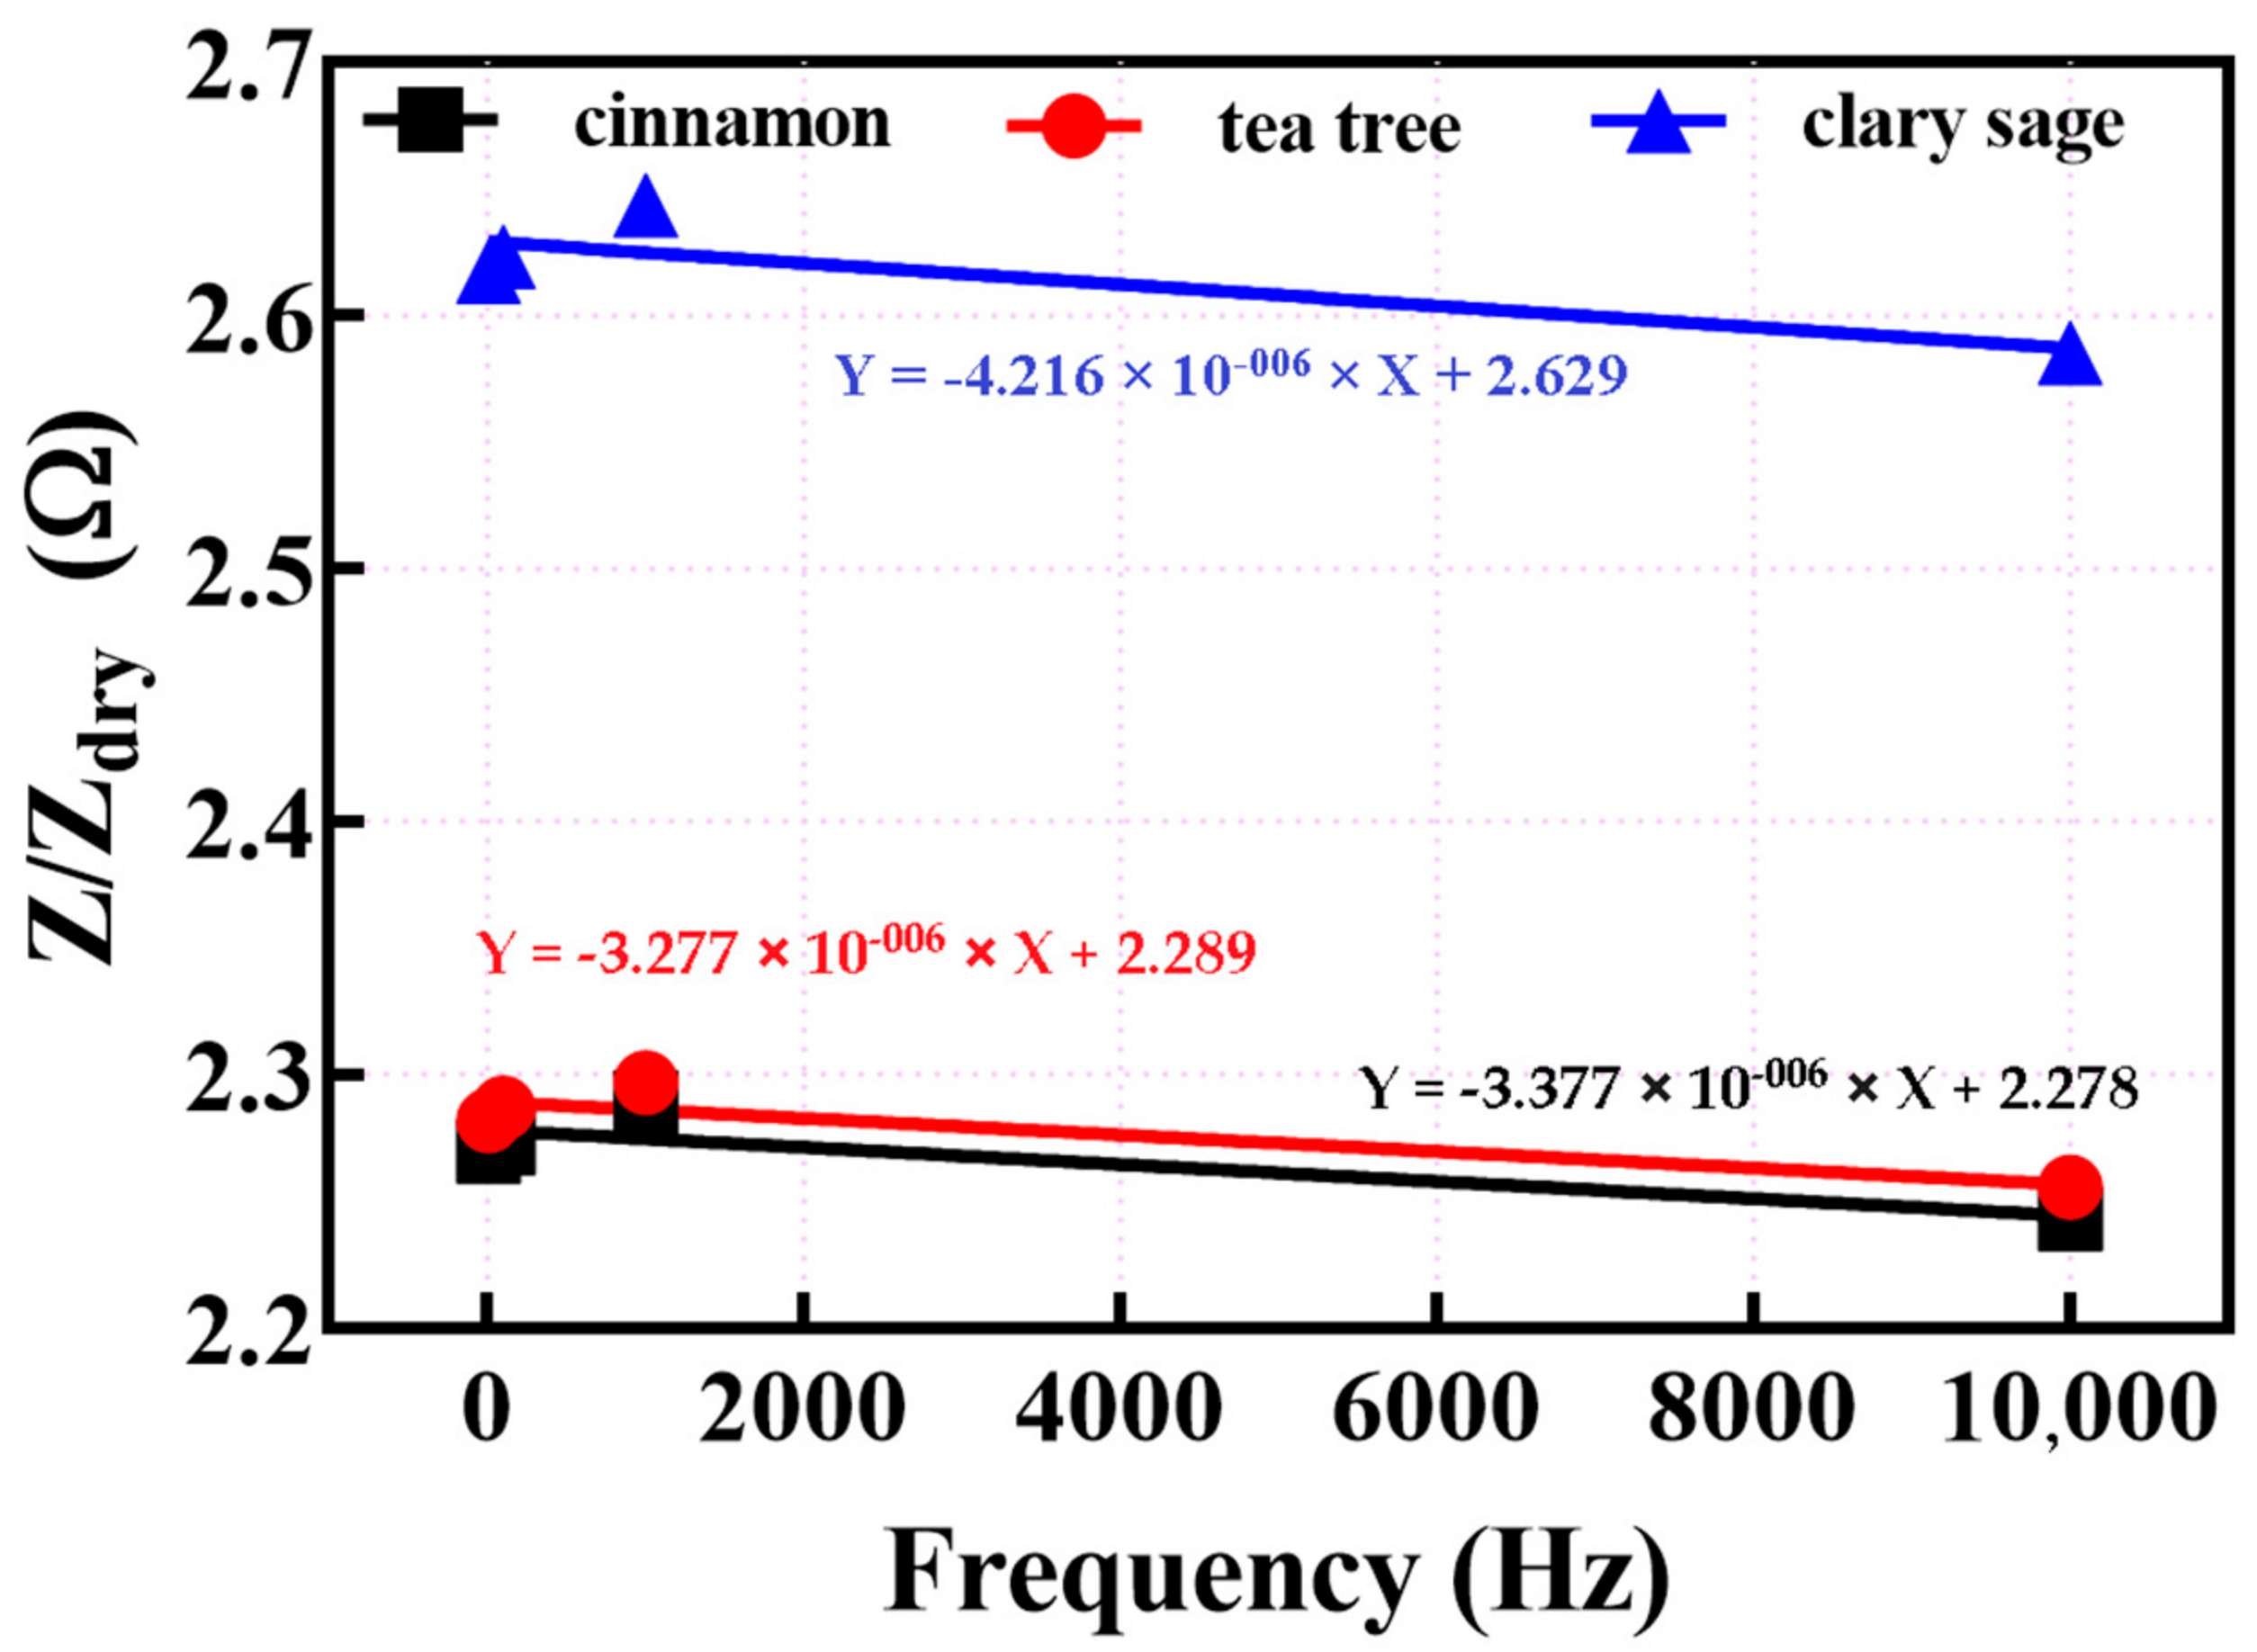
The ratio between the modulus of Z13 for a chip with applied solutions of 0.2% for all three types of EOs and for a dry chip is presented in Figure 4.
We performed a linear regression analysis of the curves shown in Figure 4. Using the ratio presented in Figure 4, at four frequencies (10 Hz, 100 Hz, 1 Hz, and 10 kHz), linear equations were determined, followed by R2 calculations. Equations are included in Figure 4. With the calculations of R2 values, we wanted to compare the linearity of curves for three different EOs. We observed very close results for all three EOs (0.8045, 0.7088, and 0.7307 for tea tree, clary sage, and cinnamon, respectively), indicating that the proposed platform is suitable for all three tested EOs. Finally, using measuring data at a frequency of 5 kHz, which was not included in the initial data fitting, relative errors were determined—0.299, 0.026, and 0.307% for tea tree, clary sage, and cinnamon, respectively. Additionally, the limit of detection (LOD) and the limit of quantification (LOQ) were calculated and the results are presented in Table 1. They were calculated as follows: LOD = 3.3 * (standard deviation of the Y-intercept of regression line/slope), LOQ = 10 * (standard deviation of the Y-intercept of regression line/slope).
The modulus of impedance (electrical resistance) of textile structure between electrodes 1 and 3 was about 0.6 Ω (confirming the good conductivity of the knitted silver thread), while the modulus of impedance was almost doubled by inserting EOs into the textile-based platform. For cinnamon oil, Z13 was about 1.3 Ω; for tea tree oil, the impedance was 1.4 Ω; and for clary sage, it was about 1.6 Ω. Figure 4 shows that a similar trend was obtained for all frequencies. The electrical conductivity of EOs is due to the presence of free charges, which move under the effect of an electric field, providing an electrical current [26]. Considering that the electrical properties of EOs depend mainly on their chemical composition, a variation can be detected due to an increase in bioimpedance when textile electrodes absorb the applied solution with different EOs. The use of different types of EOs affected the electrical performance and allowed the identification of EOs (bioimpedance), which, in combination with textile electrodes, were higher than the impedance of a dry chip.
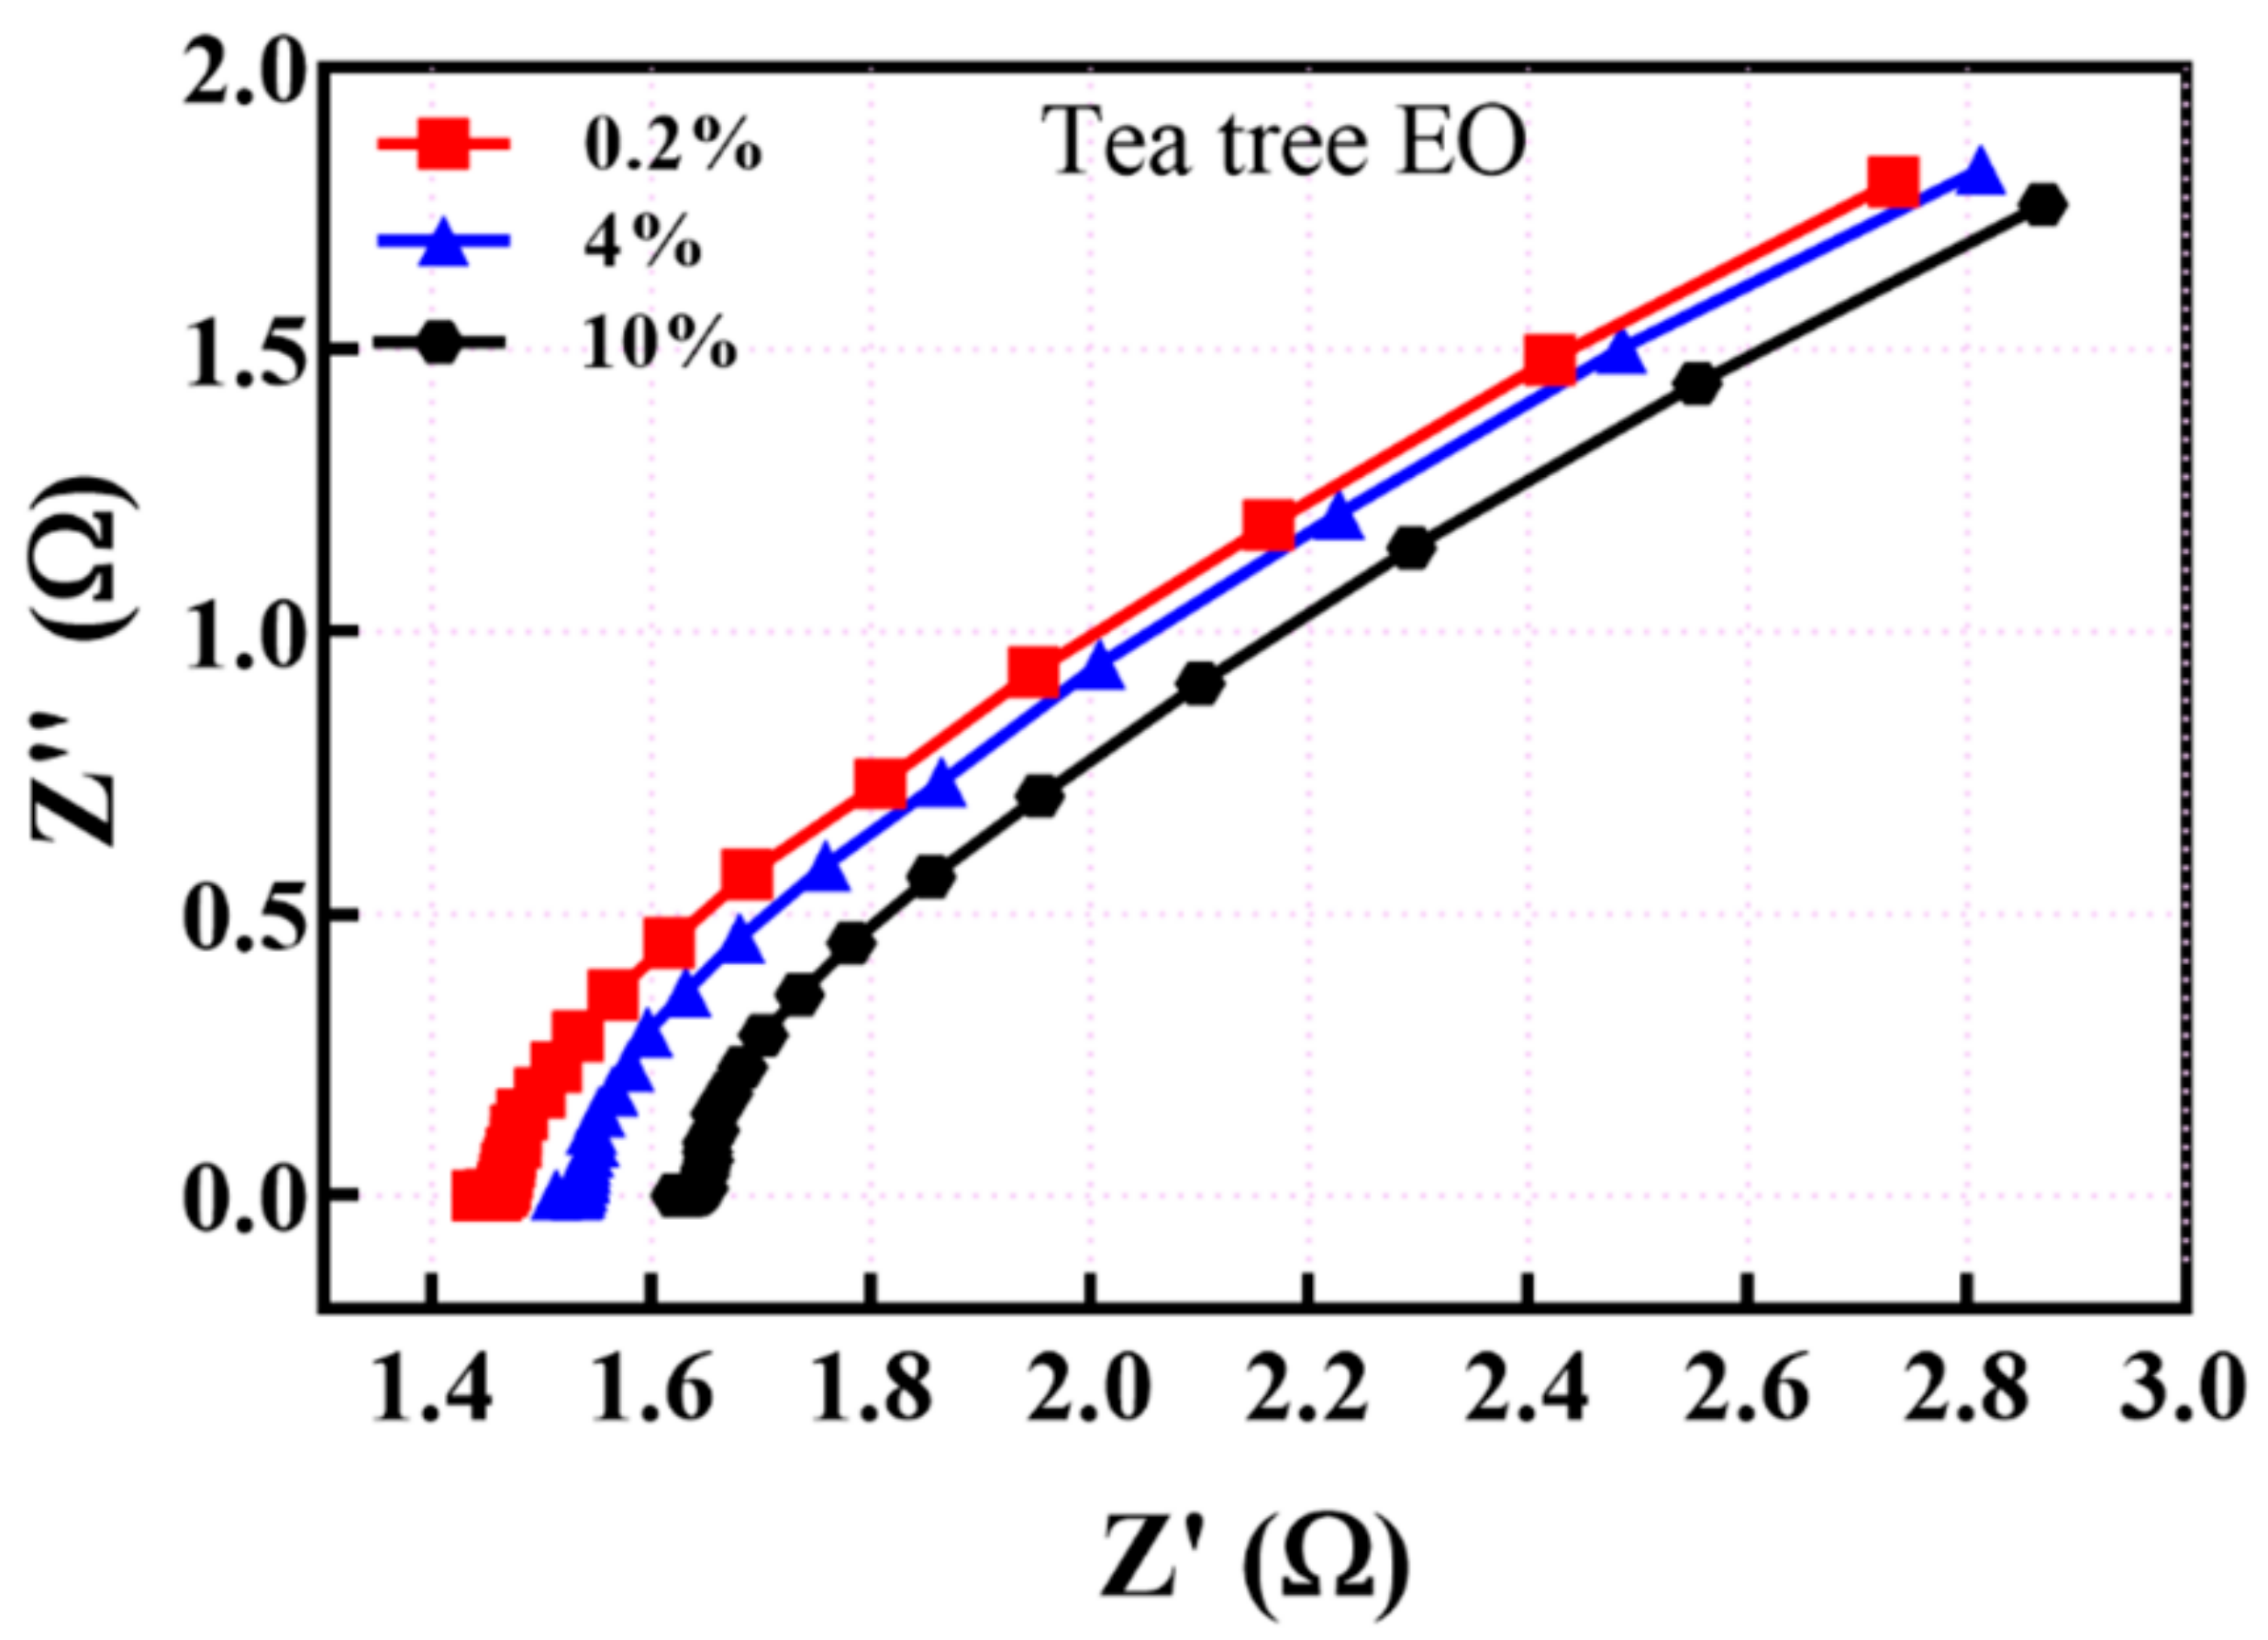
The next step of our study was to analyze if the proposed sensing platform could differentiate not only the type of EO applied but also the various concentrations of one type of EO. Figure 5 depicts the Nyquist plot for different concentrations of tea tree EO of 0.2, 4, and 10% for the pair of terminals 1 and 3.
Increasing the concentration of essential oil resulted in a higher electrical resistance. The reason for this behavior can be ascribed to two effects. The first one was that increasing the ratio of EO compared to ethanol and water resulted in a decreased number of ions that could participate in the current flow, which led to a decrease in the conductivity. The second reason could be due to the difference in dielectric properties. It is known that the dielectric constant (relative permittivity) of water is around 80; for ethanol, it is around 22; and for EOs, it is around 2 [27,28]. This means that increasing the concentration of EOs will decrease the dielectric constant and consequently decrease the capacitive part of the impedance. Bearing in mind that capacitance and impedance are inversely proportional, this resulted in increasing the real part of the impedance by increasing the concentration of EO. The observed increase in resistivity from Nyquist plots is confirmed by the calculated RMSD values—34.65, 40.86, and 51.36 for concentrations of 0.2%, 4%, and 10%, respectively.
Furthermore, we analyzed the change in Nyquist plots caused by increasing the time of exposure of the proposed platform to the influence of the EOs. Figure 6 presents the variation in Nyquist plots for tea tree and clary sage essential oil measured at the pair of terminals 1 and 3 at the beginning of measurement (initial measurement) and at 30 min and 60 min for a 0.2% concentration of EOs.
The dependence of impedance over time for 0.2% EOs (clary sage and tea tree oils) is shown in Figure 6. First, the initial measurement was taken (3 min after applying the essential oil to the textile part of the platform), then measurements were performed 30 and 60 min after the initial measurement. Results are shown for the pair of terminals 1 and 3. The same behavior during the one hour time period can be seen in Figure 6a,b for both types of EOs: tea tree and clary sage oil. The value of the impedance increased slightly over time and the changes were about 0.1 Ω. These very minor changes can be attributed to the additional distribution of the EOs between stitches of silver conductive threads. The changes in impedance between the initial time and 60 min after were insignificant compared to the changes in the impedance value when a solution of EOs was added to the dry chip value. After that, it can be concluded that the changes were almost uniform.
The calculated RMSD values for the clary sage oil were 55.37, 60.64, and 67.23 for 3 min, 30 min, and 60 min, respectively, allowing a reliable differentiation between time exposures. The calculated RMSD values for the tea tree oil were 34.65, 36.10, and 38.15 for 3 min, 30 min, and 60 min, respectively. More importantly, it was seen that RMSD changed because of the increase in concentration from 0.2 to 4%, from 34.65 to 40.86, which is higher than the RMSD change over time obtained in one hour for a fixed concentration (from 34.65 to 38.15), enabling the recognition of an actual configuration that has been tested.
Therefore, with a fabricated textile-based platform and reliable impedance measurement followed by RMSD calculations, it is possible to make differentiations of different EOs (RMSD is higher for the clary sage when compared to the tea tree), their exposures to time (RMSD increases over time), and different concentrations (RMSD increases with increasing concentration). A summary of the RMSD values, shown in Table 2, confirms a clear distinction between EO types, their concentrations, and their air exposures over time.
4. Conclusions
Essential oils have a wide range of applications, including in the medicine, pharmaceutical, agricultural, and food industries, making it very important for the detection of type and actual concentration of EOs. In this paper, we presented a portable multilayered microfluidic platform in which the central part represented a knitted silver thread structure for the rapid and efficient determination of the type of essential oil as well as its concentration. As a proof of concept, the proposed structure successfully differentiated three types of tested essential oils, tea tree, clary sage, and cinnamon bark oil, by measuring the increase in impedance compared to the dry textile chip. Increasing the concentration of essential oils resulted in increasing the measured modulus of impedance. In addition, the behavior of the EOs was studied over a period of one hour. The presented platform was very useful for applications where EOs and textiles should be combined, such as in the market-oriented domains of aromatherapeutic textiles and the controlled release of EOs for medical applications. In future work, we plan to extend the types of studied EOs as well as the fabrication of microfluidic platforms using different types of threads, i.e., copper and carbon-based conductive textile threads.
Supplementary Materials
The following supporting information can be downloaded at https://www.mdpi.com/article/10.3390/app12073596/s1. Figure S1. Chromatogram of cinnamon bark, Figure S2. Chromatogram of clary sage, Figure S3. Chromatogram of tea tree, Table S1. Final results with list of compounds.
Author Contributions
Conceptualization, B.K.; methodology, G.M.S.; validation, T.K., M.S. and G.M.S.; formal analysis, T.K.; investigation, T.K. and M.S.; resources, G.M.S.; data curation, T.K.; writing—original draft preparation, T.K., B.K., A.S. and M.S.; writing—review and editing, T.K., A.S., M.S. and G.M.S.; supervision, G.M.S.; project administration, G.M.S.; funding acquisition, G.M.S. All authors have read and agreed to the published version of the manuscript.
Funding
This project has received funding from the European Union’s Horizon 2020 research and innovation program under the Marie Skłodowska-Curie grant agreement 872370.
Institutional Review Board Statement
Not applicable.
Informed Consent Statement
Not applicable.
Data Availability Statement
Not applicable.
Acknowledgments
A.S. and M.S. would like to thank the European Union’s Horizon 2020 research and innovation program grant agreement 854194 for funding. The authors would like to thank Igor Antić from the Faculty of Technology, University of Novi Sad, for conducting the GCMS measurement.
Conflicts of Interest
The authors declare no conflict of interest.
References
- Shi, J.; Liu, S.; Zhang, L.; Yang, B.; Shu, L.; Yang, Y.; Ren, M.; Wang, Y.; Chen, J.; Chen, W.; et al. Smart Textile-Integrated Microelectronic Systems for Wearable Applications. Adv. Mater. 2020, 32, 1901958. [Google Scholar] [CrossRef] [PubMed]
- Seyedin, S.; Zhang, P.; Naebe, M.; Qin, S.; Chen, J.; Wang, X.; Razal, J.M. Textile strain sensors: A review of the fabrication technologies, performance evaluation and applications. Mater. Horiz. 2019, 6, 219–249. [Google Scholar] [CrossRef]
- Cerempei, A.; Muresan, E.; Sandu, I.; Chirila, L. Textile Materials with Controlled Release of Rosemary Essential Oil. Rev. Chim. 2014, 65, 1154–1157. [Google Scholar]
- Chirila, L.; Constantinescu, G.; Danila, A.; Popescu, A.; Constantinescu, R.; Sandulache, I. Functionalization of textile materials with bioactive polymeric systems based on propolis and cinnamon essential oil. Ind. Text. 2020, 71, 186–192. [Google Scholar] [CrossRef]
- Ghayempour, S.; Montazer, M. Micro/nanoencapsulation of essential oils and fragrances: Focus on perfumed, antimicrobial, mosquito-repellent and medical textiles. J. Microencapsul. 2016, 33, 497–510. [Google Scholar] [CrossRef]
- Stan, M.S.; Chirila, L.; Popescu, A.; Radulescu, D.M.; Radulescu, D.E.; Dinischiotu, A. Essential Oil Microcapsules Immobilized on Textiles and Certain Induced Effects. Materials 2019, 12, 2029. [Google Scholar] [CrossRef] [Green Version]
- Štular, D.; Jerman, I.; Mihelčič, M.; Simončič, B.; Tomšič, B. Antimicrobial activity of essential oils and their controlled release from the smart PLA fabric. IOP Conf. Ser. Mater. Sci. Eng. 2018, 460, 012011. [Google Scholar] [CrossRef]
- Matusiak, K.; Machnowski, W.; Wrzosek, H.; Polak, J.; Rajkowska, K.; Smigielski, K.; Kunicka-Styczynska, A.; Gutarowska, B. Application of Cinnamomum zeylanicum essential oil in vapour phase for heritage textiles disinfection. Int. Biodeterior. Biodegrad. 2017, 131, 88–96. [Google Scholar] [CrossRef]
- Julaeha, E.; Puspita, S.; Rakhmawaty, D.; Tatang Wahyudi, E.; Nurzaman, M.; Nugraha, J.; Herlina, T.; Al Anshori, J. Microencapsulation of lime (Citrus aurantifolia) oil for antibacterial finishing of cotton fabric. RSC Adv. 2021, 11, 1743. [Google Scholar] [CrossRef]
- Bakkali, F.; Averbeck, S.; Averbeck, D.; Idaomar, M. Biological effects of essential oils–A review. Food Chem. Toxicol. 2008, 46, 446–475. [Google Scholar] [CrossRef]
- Walentowska, J.; Foksowicz-Flaczyk, J. Thyme essential oil for antimicrobial protection of natural textiles. Int. Biodeterior. Biodegrad. 2013, 84, 407–411. [Google Scholar] [CrossRef]
- Kamrudi, N.; Akbari, S.; Haghighat Kish, M. The odour assessment of thyme essential oils in electrospun fibre mat with a virtual sensor array data and its relation to antibacterial activity. J. Microencapsul. 2020, 37, 144–159. [Google Scholar] [CrossRef] [PubMed]
- Dhouibi, I.; Masmoudi, F.; Bouaziz, M.; Masmoud, M. A study of the anti-corrosive effects of essential oils of rosemary and myrtle for copper corrosion in chloride media. Arab. J. Chem. 2021, 14, 102961. [Google Scholar] [CrossRef]
- Mzioud, K.; Habsaoui, A.; Ouakki, M.; Galai, M.; Souad, E.; Touhami, M. Inhibition of copper corrosion by the essential oil of Allium sativum in 0.5M H2SO4 solutions. SN Appl. Sci. 2020, 2, 1611. [Google Scholar] [CrossRef]
- Elvina, R.; Mojic, E.-R. Orange Peel Essential Oil as Component of a Metal Sensor for Lead (II) Ion Determination in Aqueous Solutions. J. Appl. Sci. Environ. Manag. 2005, 9, 23–25. [Google Scholar]
- de Azevedo Sá, C.S.; Ladchumananandasivam, R.; Rossi, C.G.F.T.; da Silva, R.K.; da Silva Camboim, W.; Zille, A.; Padrão, J.; de Oliveira Souto Silva, K.K. Characterization of a natural surfactant from an essential oil from neem (Azadirachta indica A. Juss) for textile industry applications. Text. Res. J. 2021, 55, 1444–1454. [Google Scholar] [CrossRef]
- Do, T.; Hadji-Minaglou, F.; Antoniotti, S.; Fernandez, X. Authenticity of essential oils. TrAC Trends Anal. Chem. 2014, 66, 146–157. [Google Scholar] [CrossRef]
- Jjunju, F.P.M.; Giannoukos, S.; Marshall, A.; Taylor, S. In-Situ Analysis of Essential Fragrant Oils Using a Portable Mass Spectrometer. Int. J. Anal. Chem. 2019, 2019, 1780190. [Google Scholar] [CrossRef] [Green Version]
- Graboski, A.; Zakrzevski, C.; Shimizu, F.; Paschoalin, R.; Soares, A.; Steffens, J.; Paroul, N.; Steffens, C. Electronic Nose Based on Carbon Nanocomposite Sensors for Clove Essential Oil Detection. ACS Sens. 2020, 5, 1814–1821. [Google Scholar] [CrossRef]
- Sudarmaji, A.; Margiwiyatno, A.; Ediati, R.; Mustofa, A. Vapor Measurement System of Essential Oil Based on MOS Gas Sensors Driven with Advanced Temperature Modulation Technique. IOP Conf. Ser. Earth Environ. Sci. 2018, 147, 012046. [Google Scholar] [CrossRef]
- Wu, T.; Wu, H.; Du, Y.; Peng, Z. Progress and trend of sensor technology for on-line oil monitoring. Sci. China Technol. Sci. 2013, 56, 2914–2926. [Google Scholar] [CrossRef]
- Liu, H.; Tang, X.; Lu, H.; Xie, W.; Hu, Y.; Xue, Q. An interdigitated impedance microsensor for detection of moisture content in engine oil. Nanotechnol. Precis. Eng. 2020, 3, 75–80. [Google Scholar] [CrossRef]
- Amann Group, Textile Threads. Available online: https://www.amann.com/ (accessed on 20 February 2022).
- Bell, E.W.; Zhang, Y. DockRMSD: An open-source tool for atom mapping and RMSD calculation of symmetric molecules through graph isomorphism. J. Cheminform. 2019, 11, 40. [Google Scholar] [CrossRef] [Green Version]
- Ayna, A.; Moody, P.C. Crystal structures of a dual coenzyme specific glyceraldehyde-3-phosphate dehydrogenase from the enteric pathogen Campylobacter jejuni. J. Mol. Struct. 2021, 1242, 130820. [Google Scholar] [CrossRef]
- Alaoui Ismaili, S.; Belgharza, M.; Marmouzi, I.; Saaid, H.; Kitane, S.; Alaoui El Belghiti, M. Study of the electrical resistivity of vegetable and essential oils. Der Pharma Chemica 2015, 7, 294–296. [Google Scholar]
- Banerjee, S.; Bonde, C. Total phenolic content and antioxidant activity of extracts of Bridelia Retusa Spreng Bark: Impact of dielectric constant and geographical location. J. Med. Plants Res. 2011, 5, 817–822. [Google Scholar]
- Pratap Singh, S.; Singh Chandel, V.; Manohar, R. Dielectric study of Clove oil. J. Ayurveda Integr. Med. 2018, 9, 53–56. [Google Scholar] [CrossRef]
Figure 1.
(a) Textile-based microfluidic platform used for the determination of different essential oils, (b) SEM micrograph of knitted silver threads.
Figure 1.
(a) Textile-based microfluidic platform used for the determination of different essential oils, (b) SEM micrograph of knitted silver threads.

Figure 2.
(a) Experimental setup for EIS, (b) injection of EO solution onto the sensing part of the device.
Figure 2.
(a) Experimental setup for EIS, (b) injection of EO solution onto the sensing part of the device.

Figure 3.
Nyquist’s plots measured using all four electrode terminals for dry chip (black curves) and for (a) cinnamon EO, (b) tea tree EO, and (c) clary sage EO.
Figure 3.
Nyquist’s plots measured using all four electrode terminals for dry chip (black curves) and for (a) cinnamon EO, (b) tea tree EO, and (c) clary sage EO.


Figure 4.
Impedance ratio of EOs and dry chip as a function of frequency.

Figure 5.
Nyquist plots for different concentrations of tea tree EO.

Figure 6.
Nyquist plots for (a) tea tree, and (b) clary sage EOs at different time intervals.


Table 1.
Limit of detection and limit of quantification.
| EOs | Linearity (R2) | |LOD| | |LOQ| |
|---|---|---|---|
| Tea Tree | 0.8045 | 5780.43 | 17,516.40 |
| Clary Sage | 0.7088 | 7515.51 | 22,774.30 |
| Cinnamon | 0.7307 | 7118.50 | 21,571.20 |
Table 2.
RMSD values for all tested configurations of EOs.
| EO Type | Concentration | Time (Minutes) | RMSD |
|---|---|---|---|
| Cinnamon | 0.2% | 3 | 34.03 |
| Clary Sage | 0.2% | 3 | 55.37 |
| Clary Sage | 0.2% | 30 | 60.64 |
| Clary Sage | 0.2% | 60 | 67.23 |
| Tea Tree | 0.2% | 3 | 34.65 |
| Tea Tree | 0.2% | 30 | 36.10 |
| Tea Tree | 0.2% | 60 | 38.15 |
| Tea Tree | 4% | 3 | 40.86 |
| Tea Tree | 10% | 3 | 51.36 |
Publisher’s Note: MDPI stays neutral with regard to jurisdictional claims in published maps and institutional affiliations. |
© 2022 by the authors. Licensee MDPI, Basel, Switzerland. This article is an open access article distributed under the terms and conditions of the Creative Commons Attribution (CC BY) license (https://creativecommons.org/licenses/by/4.0/).
Share and Cite
MDPI and ACS Style
Kojic, T.; Kovacevic, B.; Sinha, A.; Simić, M.; Stojanović, G.M. Silver Thread-Based Microfluidic Platform for Detection of Essential Oils Using Impedance Spectroscopy. Appl. Sci. 2022, 12, 3596. https://doi.org/10.3390/app12073596
AMA Style
Kojic T, Kovacevic B, Sinha A, Simić M, Stojanović GM. Silver Thread-Based Microfluidic Platform for Detection of Essential Oils Using Impedance Spectroscopy. Applied Sciences. 2022; 12(7):3596. https://doi.org/10.3390/app12073596
Chicago/Turabian StyleKojic, Tijana, Bozica Kovacevic, Ankita Sinha, Mitar Simić, and Goran M. Stojanović. 2022. "Silver Thread-Based Microfluidic Platform for Detection of Essential Oils Using Impedance Spectroscopy" Applied Sciences 12, no. 7: 3596. https://doi.org/10.3390/app12073596
Note that from the first issue of 2016, this journal uses article numbers instead of page numbers. See further details here.