Article

Life Cycle Assessment of Different Waste Lubrication Oil Management Options in Serbia

1
Department for Industrial Engineering and Management, Faculty of Technical Sciences, University of Novi Sad, 21000 Novi Sad, Serbia
2
Department of General Engineering Disciplines, Faculty of Technology, University of Novi Sad, 21000 Novi Sad, Serbia
*
Author to whom correspondence should be addressed.
Appl. Sci. 2021, 11(14), 6652; https://doi.org/10.3390/app11146652
Submission received: 16 May 2021 / Revised: 26 June 2021 / Accepted: 30 June 2021 / Published: 20 July 2021
(This article belongs to the Section Environmental Sciences)

Abstract

:
On average, approximately 22 thousand tons of new lubrication oil were marketed annually in Serbia in the period 2015–2019. Less than 20% of the waste lubrication oil (WLO) generated was treated, whereas the remainder was mostly uncollected or improperly disposed of. The purpose of this study is to examine different WLO management scenarios that could be implemented in Serbia in the future and to quantify their potential environmental benefits. Different WLO treatment processes (namely the re-refining of used oil for base oil recovery, the use of WLO as a substitute to fossil fuels in cement kilns, and the combustion of WLO in waste incinerators with energy recovery) were evaluated using the life cycle assessment (LCA) and ReCiPe 2016 impact assessment methods. The LCA results obtained indicate that no single WLO treatment process consistently exerts diminished environmental impacts according to all the impact categories considered. From a human health perspective, the incineration of WLO in waste incinerators was found more favourable than the other treatment processes considered, whereas the combustion in cement kilns was the most favourable approach with regard to ecosystem protection. In terms of fossil fuel savings, re-refining technologies performed slightly better than the other processes considered. This can be accounted for by significant amounts of marketable co-products generated in the re-refining process, which can be used as a substitute to fossil-based primary products. Furthermore, a total of four possible WLO management scenarios were developed on the basis of the annual quantities of untreated WLO and a mix of treatment options. The results obtained indicate that up to 22,100 t CO2 equivalent and 34,300 t oil equivalent could be saved annually in Serbia provided the most favourable WLO management scenario is considered.

1. Introduction

The proper management and reasonable use of resources play a central role in both developing an efficient economy and sustaining those resources for future generations. Waste lubricant oil management (WLOM) is of immense importance to the sustainability of resources (e.g., crude oil) and better economic, social, and environmental benefits.
The strategic approach of the European Commission for sustainable utilization of natural resources [1], the 2030 Agenda for Sustainable Development and the SDGs [2,3] deal with the issues related to sustainable consumption and production, natural resources, effective institutions, good governance, and rule-of-law societies.
In their life cycle assessment (LCA) of the used oils management in the USA in 2017, Collins et al. address the issue of waste management according to the laws set by the State of California (SB546 Lowentahl) and the requirements of ISO 14044 [3]. To implement such strategies, it is necessary to adopt appropriate laws and regulations to enhance the development and implementation of waste management systems, thus contributing to the renewal of materials and energy.
Different models and approaches have been developed for waste management system analysis [3,4]. A number of reports and studies use LCA software to analyse the independent processes employed in WLOM systems such as transport systems, possible processing systems, etc. [3,5,6]. The authors of [7] evaluate the environmental and energy performance of the re-refining process for WLO using LCA software.
In some studies, the technological process of WLOM has been analysed using models and LCA software [8]. An LCA study presents the current treatment routes and regeneration technologies adopted in Europe. This paper also presents an updated European WLOM practice for promoting a circular economy [9]. The LCA strategy for the WLOM in Egypt, as a country with the highest oil consumption on the African continent, shows that the use of WLOs is more justified than their burning from an environmental perspective. Although the results obtained are greatly influenced by fossil fuels used to process waste oils, the processing of waste oils was found more justified than their burning [10]. In its LCA analysis of renewable fuels, the U.S. Environmental Protection Agency (EPA) provides possible ways to process waste oil into biofuels [11]. Anca Zaharioiu et al. examined the conversion of solid waste as an alternative fuel into biofuels using the pyrolytic process. The data obtained on metal composition, heat values, and emission factors were compared with other conventional and unconventional fuels [12]. Kanokkantapong, V. et al. [13] used LCA process analysis tools to manage WLO and a number of technological processes for treating waste lubricating oils. The analysis of different WLO treatments shows their impact on the environment, i.e., their greenhouse gas (GHG) emissions and energy consumption and accumulation.
The authors’ interest in the WLO management in Serbia and its impact on human health, ecosystems and resource consumption stems from the country’s current environmental issues. These issues are observable and monitored by measuring the emission of PM10 and PM2 particles into the air. According to the measured concentrations of airborne particles, some cities in Serbia are classified as the most polluted in Europe. Our paper aims to show the impact of GHG emissions on human health, ecosystems, and resource consumption on the basis of the calculated quantities of untreated oils in Serbia, using an LCA analysis through various simulated WLO scenarios of waste oil treatment.
Section 2 describes the WLO management in Serbia and presents the model constructed for waste oil collection, management, and treatment in Serbia.
Section 3 defines a functional unit for applying LCA analysis to WLO treatment processes. It determines WLO treatment scenarios and the real quantities of WLO burned in a cement plant in Serbia. The chapter also specifies the quantities of untreated oil which would be subsequently treated using certain technological processes with different scenarios.
Section 4 presents the impact of the analysed WLO treatment processes and WLOM scenarios on human health, ecosystems and natural resources, as well as the estimates of potential GHG savings, provided the most favourable WLOM scenario is applied.

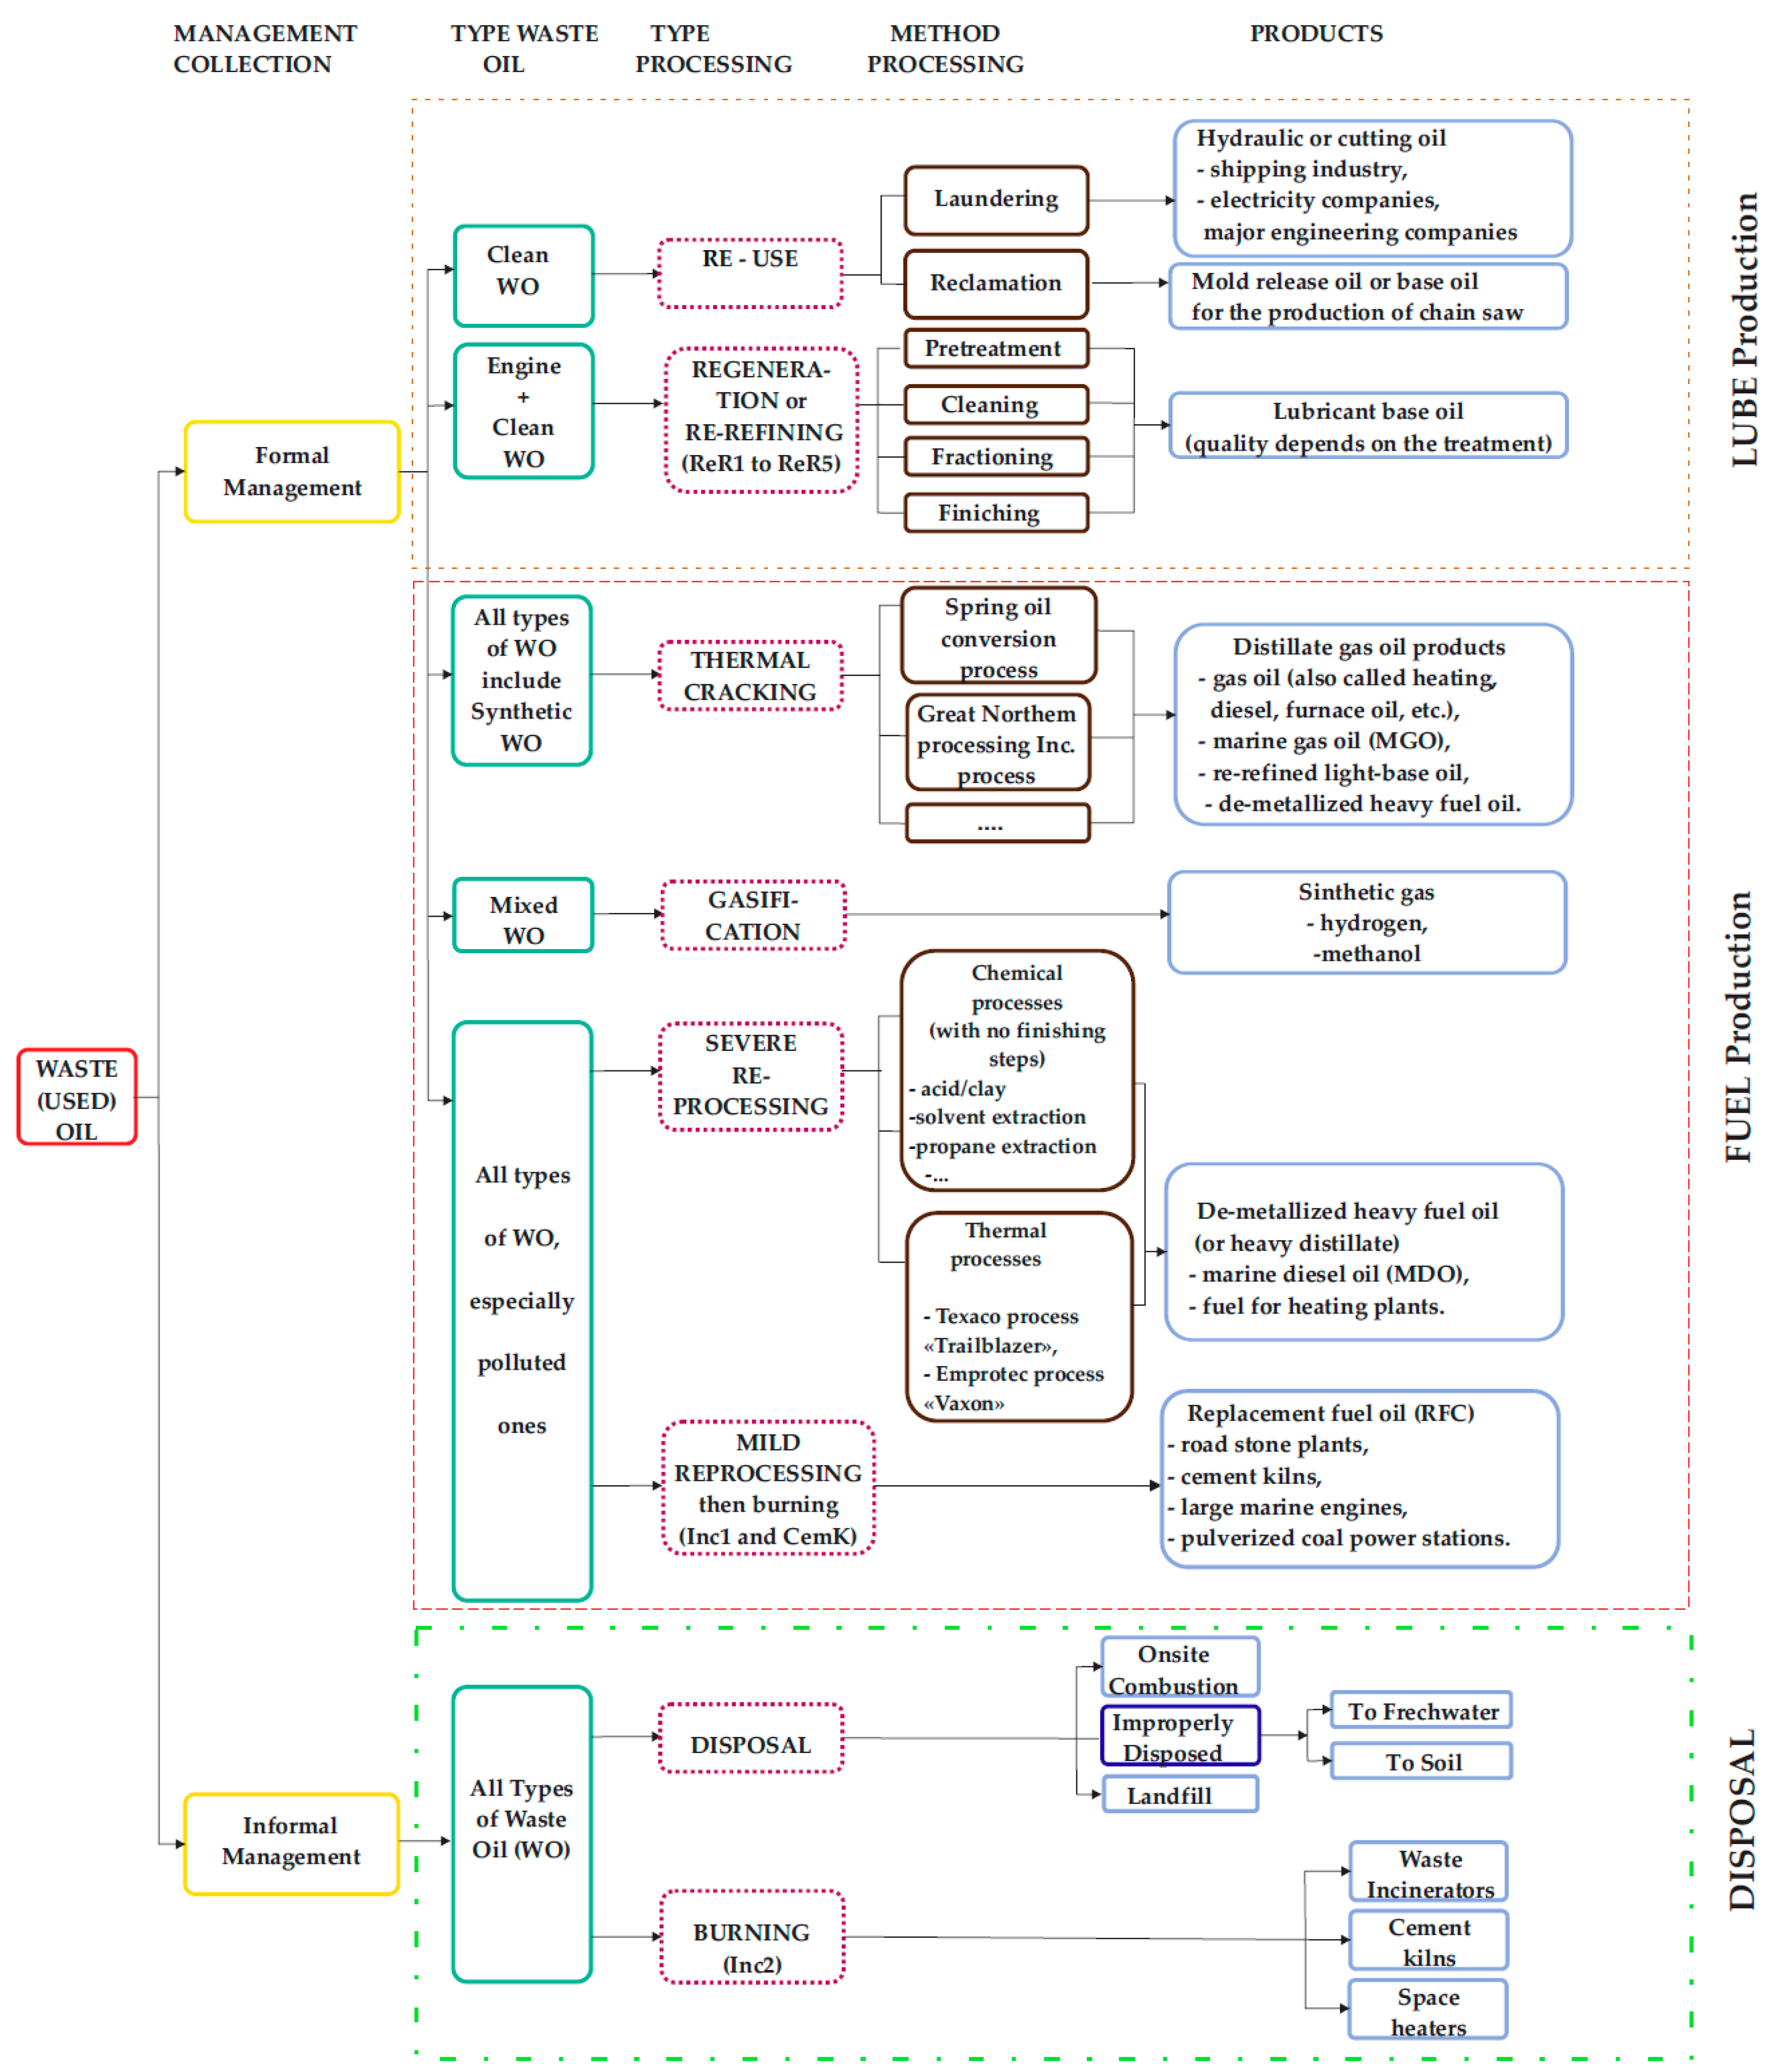
2. Description of the WLO Management in Serbia

The model used to assess the WLO recycling process in Serbia was developed by combining the existing solutions [14,15] with the models developed by the authors depending on the current situation in the country. Employing LCA software for the waste oil treatment in Serbia enabled a more in-depth analysis of the impact of waste oils on humans and the environment regarding GHG emissions, acidity, ecotoxicity, etc. Figure 1 shows a potential model for management, collection, separation, processing, and disposal of waste lubricating oil in Serbia developed by the authors.
Approximately 5.7 Mt of lubricant are consumed annually in EU countries [16]. At least half of this amount, i.e., about 2.7 Mt, can be collected for further processing. The proper management of WLO, which consists of the proper collection, transport, processing, and disposal of WLO, represents a significant amount of valuable and useful raw material [17,18].
According to qualifications, waste lubricant oils (WLO) belong to hazardous waste. In addition to environmental problems, WLOs pose a great danger to human health because they contain harmful pollutants in the form of heavy metals, polycyclic aromatic hydrocarbons (PAHs), and polychlorinated biphenyls (PCBs) [13]. PAHs naturally occur in mineral oil and are removed by vacuum processing. However, the use of mineral oils as engine oils increases oil PAH* concentrations due to fuel combustion. The ratio of PAHs in used oil can be three times higher than that in virgin oil [19]. PCBs are mainly found in transformer oil in the form of organochloride. The ban on PCBs’ production and use due to their toxic and extremely stable properties was passed in the 1980s. However, by testing waste oils, certain amounts of PCBs can still be found [20].
Figure 1 shows all possible ways of treating waste oil depending on the technology available to certain countries or economies.
From the energy point of view, waste oils can be considered a valuable resource because their burning can generate energy, whereas the process of waste oil refining can result in a valuable base or oil suitable for further use [21]. According to the previous studies of El-Fadel and Khouri [22], a total of 1.6 L of recycled waste oil can be used to produce 1 L of engine oil. Furthermore, Ucar et al. [23] obtained 40 MJ/kg of energy by burning 1 kg of WLO in their study on waste oil processing. When recycling WLOs by the pyrolytic process, higher energy values are obtained per one kilogram of waste oil. For such oils, 45.7 MJ/kg were obtained, indicating the values of pure diesel fuel [24]. The advantages of this procedure are manifested in the increase of processed oil energy value by 12% relative to waste oil, processing of 84–88% of waste into pure pyrolytic oil, creation of low compounds of PCBs and PAHs in the oil, low emission of waste gases, and small pollution impacts on the environment [25].
According to the Fuchs data for 2018, oils are mainly classified into the following categories: engine, industrial, process, and lubricating oils for marine engines. Of the total amount sold in 2017, engine oils accounted for 57% [26].
Accordingly, the authors wanted to present all the possible ways of treating and managing WLO.
The authors have developed a model for waste oil collection, management and treatment in Serbia (Figure 2) which illustrates the actual oil collection situation from 2015 to 2020. The data used for the LCA analysis performed refer to the period from 2015 to 2019. The data for 2017 are not available. The data on WLOs amounts were obtained from two leading state institutions: the Environmental Protection Agency (EPAS) and the Statistical Office of the Republic of Serbia (SORS).

3. Methodology

Within the methodology section, WLO quantities for potential treatment, WLO treatment scenarios and the life cycle assessment method were defined.

3.1. Quantities of WLO in Serbia

In 2010, the Regulation on Conditions, Manner, and Procedure of Waste Oil Management was adopted in the Republic of Serbia (RSerb). However, the participants’ position in collecting, transporting, and processing waste oils is not clearly defined. The EU subsidies and taxes incentives received in recent years have often been awarded to dubious companies which do not have defined legal procedures for collecting, transporting, and treating oil. The Environmental Protection Agency of Serbia (EPAS) has access to completely different data compared to the Statistical Office of the Republic of Serbia (SORS), which also deals with WLO. The authors had great difficulty in obtaining relevant data on the quantities of WLO in Serbia. All data on the quantities of WLOs in Serbia used herein were obtained from the official institutions dealing with this issue.
According to the EPAS data, a total of 38,654 (t) of lubricating oil are sold annually in Serbia. However, the unofficial data obtained from oil distributors, producers, and importers indicate that annual lubricate oil sales approximate to 54,000 (t) in the RSerb market. The authors wish to point out the major environmental problems that arise due to the uncollected WLO. The quantities of uncollected WLO are greater than those of treated oil and end up in unknown waste streams.
Table 1 and Table 2 show the annual quantities of new oils sold and WLOs collected and exported.
According to the results of Xintao Hu et al. [29], the process of PCB oil recycling can be performed well in cement kilns. Cement kilns were found to develop a sufficiently high combustion temperature to burn WLO with an acceptable emission of pollutants, thus polluting the environment less than other technologies.
Figure 3 shows the ratios between untreated, treated, and exported quantities of WLO and the amounts of new lubricating oil placed on the market.
According to the data of the Agency of the RSerb [27,28], the amounts of dangerous PCBs have been decreasing for years. Significant PSB quantities of 6806 tons were destroyed, especially after 2015. Thereafter, those quantities have ranged between 50 and 100 tons per year.
The difference between the amounts of oil placed on the Serbian market (new oil) annually and the treated, untreated and exported WLO is most alarming. Table 2 and Figure 3 show the quantities of (new) oil placed on the Serbian market and the quantities of oil that were treated, exported and untreated. Of particular concern are the quantities of untreated oil recorded in 2019, which are almost double in value compared to the previous ones.
It is known that of the total amount of oils placed on the market, 55 to 60% of oils are engine oils [26]. Engine oils claim the largest share of the total amount of oils in the market, as shown by officially published data from oil producers.
Table 3 shows the percentage and weight ratios of treated waste (all types of hazardous waste including waste oils) in the total amount of hazardous waste collected in the RSerb.
The amounts of treated WLO referred to the filtered amounts of oils (separated water and solid particles) repurposed for other applications.
The WLO incineration in RSerb is defined as incineration in cement kilns, as these are the only kilns that can burn hazardous waste at higher temperatures without major environmental consequences. Other incineration methods include unconventional treatments (such as furnaces in workshops, workshops, etc.), which are not mentioned herein but will be considered. Furthermore, the authors and the State Agencies EPAS and SORS are not aware of these quantities, thus the quantities of untreated oil burned in cement kilns were calculated using the data from official institutions and cement plants. The remainder of the untreated oil will be counted as landfill, incineration, and release into the environment, as the authors Xintao Hu et al. [29] assumed in their paper. Table 4 shows the quantities of marketed new oil according to the EPAS and SORS official data.
Untreated WLO quantities were calculated as the mean quantities of new oils marketed in the previous year deducted by the amount of WLO generated in the current year (Equation (1)). As engine oils account for 55 to 60% of the total volume of marketed oils, it is noteworthy that industrial oils mostly claim the remaining share. In practice, industrial oils last longer than one year in operation, whereas the life of engine oils is shorter or, as recommended, one year.
M U W L O = M N O   L Y M T W   L O C Y M E X   W L O     [ t ]    
where MUWLO—untreated amounts of WLO, MNO LY—distributed quantities of new lubrication oil in the previous year, MTW LOCY—treated waste lubrication oil in the current year, and MEX WLO—exported waste oil.

3.2. WLO Treatment Scenarios in Serbia

According to the data of the Serbian institutions dealing with waste collection and treatment analysis (Table 3), WLO is partially filtered and incinerated in cement plants, whereas the rest of WLO is disposed of informally. Upon comparing Table 3 and Table 4, it is evident that a large amount of WLO in Serbia is without a final destination. Therefore, the authors considered only the amount of WLO that can currently be treated in the existing cement plants with the highest degree of replacement of the basic fuel (petroleum coke) up to 12% [30, 31]. The rest of the untreated WLO was observed through re-refining WLO into base oil by various methods such as the Cyclon, Evergreen, HyLube, MRD, and Viscolube methods. Moreover, the scenarios involving WLO incineration, with or without recovery, were also considered. In this way, the authors argued possible present and future scenarios of WLO treatment and emphasised the beneficial impacts of certain scenarios on ecosystems, energy consumption, and the possibility of obtaining new products through a circular economy.

3.2.1. Incineration in Cement Kilns

The use of alternative fuels in cement kilns has been present for over 40 years. Depending on legal regulations, environmental standards, and the price of available alternative fuels, the criteria for selecting alternative fuels in the cement industry are almost non-existent. Based on its internal standards, each of the cement producers sets certain criteria for selecting materials as an alternative fuel. These criteria are presented through several standards listed in the papers [32,33]. Table 5 shows the use of alternative fuels in different countries of the world.
Table 6 shows, in percentage terms, the most common types of waste used as alternative fuels in cement plants [34,35].
As seen in Table 6, the use of oil in the cement industry depends on the manufacturer and the applied cement production technology. The Serbian cement industry consists of three cement plants owned by Lafarge-Holcim, CRH, and TITAN. The Lafarge-Holcim cement plant is the only cement plant in the country that boasts WLO processing technology. Of the other two cement plants, CRH uses Solid Recovered Fuel (SRF), whereas TITAN has not yet embarked on the process of using waste as alternative fuel and persists in using petroleum coke as a primary fuel.
The share of alternative fuels used in the CRH and TITAN cement plants ranges up to 30% of the total amount of fuel used (including petroleum coke and coal), with an increasing trend until 2025 [36]. The share of WLO used in the Lafarge-Holcim cement production ranges up to 12% of the total amount of fuel used [31].
The available production capacity of the Lafarge-Holcim cement plant approximates to 1,500,000 t/year, or 1,200,000 t/year of clinker. According to their public data, the Serbian cement plants use about 50% of their capacity per year. WLO accounts for about 12% of the total amount of fuel used annually in the Lafarge-Holcim cement plant for a cement production of 600,000 t/year. The Lafarge-Holcim cement production claims a 42.88% share of the total cement production in Serbia. Based on the data obtained [37], the consumption of WLO per ton of clinker is 95 kg with a WLO net calorific value (NCV) of 35 MJ/kg. Moreover, the clinker ratio in cement production is 80% of the total amount, i.e., 0.8 kg of clinker is needed to obtain one kilogram of Portland cement. For the cement clinker production in Serbia, WLO is consumed in quantities up to 11.4 kg/t of clinker.
Based on the data considered [31,38], the consumption of WLO in the cement plants in Serbia varies depending on the amount of cement produced (assuming that the share of WLO is at a level of 12% of the total amount of fuels burned). The authors used the data shown in Table 4 to calculate the amount of oil burned in the Serbian cement plants (MBCKWLO). These values range from 37 to 69.26% depending on the amount of treated (regenerated) oils. The higher the percentage of burnt oils in cement plants, the less the amount of untreated oils. Table 7 shows the ratios of treated, untreated and burned WLOs in cement plants annually (on average).
MBCKWLO is the maximum amount of WLO burned in cement kilns (t), MPC is the amount of cement produced (t/year) and MDWLO is the deposed amount of WLO (t/year).
M BCKWLO = M PC   ·   C C   ·   C PCSRB   ·   e WLO   [ t ] ,
where CC—the coefficient of clinker share in cement production (80% of clinker per ton of cement), CPCSRB—the share of the observed cement plant in the total cement production in Serbia (42.88% of the total amount of cement produced), and eWLO—the consumption of WLO to produce a ton of cement (11.4 kg/t).
M D W L O = M U W L O M B C K W L O   [ t ]  
The share of a cement plant’s volume of production in the total cement production in Serbia may vary. According to the cement production data from the Serbian cement plants [39], the authors obtained the data on the annual cement production in the Lafarge-Holcim cement plant.
MDWLO represents, in percentage terms, the amount of WLO partly deposited on the ground or partly released into the environment. However, EPAS and SORS, as authorized state institutions, do not have data on the quantities deposited on and into the land. Therefore, the WLO disposal is considered to encompass a 50% share of the incinerated WLO without energy recovery (namely the on-land incineration) and a 50% share of WLO deposited on the land.

3.2.2. Possible WLO Re-Refining Processes in Serbia

The possible processes for WLO re-refining in Serbia were based on the existing technological processes which yield excellent results. In addition to the beneficial impact on the environment, such processes generate usable products such as base oil of good quality. From a circular economy’s perspective, these processes are almost complete as waste oil is processed into usable base oil that can be reused for the same or a similar purpose. At present, there is no such process in Serbia because the companies dealing with the refining process intend to export all the collected oil from the country instead of building plants in the future.
The re-refining processes considered in this study include the Cyclon, Evergreen, HyLube, MRD, and Viscolube processes, which are described in the study of the Institute for Energy and Environmental Research (IFEU) [40]. The authors did not want to favour any of the re-refining processes considered, so they labelled them as ReR1 to ReR5.

3.2.3. WLO Incineration Processes in Serbia

The impacts of WLO burning are explored through two processes: the burning of WLO in heating plants (Inc1) with energy recovery and the burning of WLO in heating plants without energy recovery (Inc2). Incineration scenarios were modelled using the ecoinvent 3.7 life cycle inventory (LCI) data, which represent the incineration technology used in a Swiss Hazardous Waste Incinerator (HWI) plant (in 2000) equipped with a wet flue gas scrubber and the Selective Catalytic Reduction (SCR) technology to remove nitrogen oxides (NOx) from exhaust gases. [40,41].

3.2.4. Overview of the Potential WLO Treatment Scenarios in Serbia

In the first scenario, WLO is treated in cement kilns according to Table 7 for MBCKWLO, while other quantities of untreated MDWLO oil are treated with one of the re-refining technologies considered. The second scenario of WLO treatment uses three processes: WLO treatment in cement kilns, the re-refining process, and incineration in heating plants with energy recovery (the amounts of WLO are taken from Table 7 for MBCKWLO treated in the cement kilns, whereas the quantities that would be deposited in MDWLO are divided equally between the re-refining process and incineration in heating plants). The third scenario includes combustion processes in cement kilns, re-refining, and combustion in heating plants with and without energy recovery. The quantities of WLO treated in cement kilns are taken from Table 7 for MBCKWLO, whereas the deposited quantities of MDWLO are equally divided between the processes of re-refining and incineration in heating plants with and without energy recovery. The fourth scenario considers the effects of WLO treatment through the incineration process in cement kilns (using WLO quantities for MTWLOCY from Table 7 because, according to the data obtained from the cement kilns [31], the real quantities are approximate to the MTWLOCY quantities for 2017) and the rest is re-refined or incinerated in heating plants with and without energy recovery (Table 8).

3.3. Life Cycle Assessment

The environmental impact of different scenarios is estimated with the life cycle assessment (LCA) method (ISO 14040:2006 and ISO 14044:2006), which (according to the European Commission (COM (2003; 302)) is currently the best framework for assessing the potential environmental impacts of products. The LCA’s main goal is to identify which waste management system (see description of the scenarios in Section 3.2) is the most or least environmentally advantageous.
The present study assumes that the primary function of the scenarios considered is waste treatment, and the functional unit is defined as 1000 kg of waste lubricant oil. The modeling follows the cut-off system model approach [41], which assumes that the waste carries no upstream environmental burden into the waste management system [42]; in other words, waste is available burden-free to the waste treatment process and only impacts associated with its collection and transportation are accounted for. In each scenario, it is assumed that the average distance between collection centres and waste treatment facility is 100 km and that the waste lubricating oil is transported by road using a lorry of 16–32 metric tons gross vehicle weight.
The foreground system was modeled using secondary data. The foreground data, consisting of material and energy flows associated with five different re-refining technologies (ReR1–ReR5), are available from Fehrenbach [40]. The data on emissions from hazardous waste incinerator (relevant to Inc1 and Inc2) are available from [43] and are applicable to modern incineration practices in Europe. In Inc1, it was assumed that the net thermal and electric energy generated would amount to 25.82 MJ/kg and 2.44 MJ/kg, respectively [43]. Rotary kiln emissions for CemK were compiled from the inventory data of the works of Pires, A et al. [8] and the research data of Fehrenbach, H. [40]. It is assumed that the heat generated from the burning of WLO (40 MJ/kg of WLO) [40] can substitute the same amount of heat from petroleum coke burning, which is the primary source of energy in the Serbian cement factories. The background system (up- and downstream processes) was modelled with generic or average life cycle inventory (LCI) datasets available from the ecoinvent 3.7. LCI database [41].
Most of the waste treatment processes considered in this study are multifunctional, i.e., they produce several co-products (materials and/or energy). The problem of multifunctionality [44] is solved by the substitution method, which is suitable for waste management systems because the generated co-products can be produced using alternative methods and processes [8]. In ReR1–ReR5, a portion of the co-products produced (as specified in [40]) is used to meet the energy requirements of the process itself, and only the surplus is supplied to the market. Table 9 summarizes the main co-products from the analysed waste treatment processes, the avoided processes, and their respective LCI datasets.
The life cycle environmental impacts of the different waste management processes were estimated with the ReCiPe 2016 (H) method], which considers impacts within 18 midpoint and 22 endpoint impact categories [45]. At the endpoints, results are aggregated and expressed through three damage category indicators: (a) damage to human health is measured through the disability-adjusted loss of life years with the unit of DALY, (b) damage to ecosystem quality is measured through the loss of local species integrated over time with the unit of species×yr, and (c) damage to resource availability is measured in US dollars (USD) representing the extra costs of future mineral and fossil resource extraction due to a decrease in the availability of the total resource stock [45]. The ecoinvent 3.7 LCI database and the ReCiPe 2016 (H) LCIA method are integrated into the OpenLCA 1.7 LCA software [46], which was used to calculate the results.

4. Discussion of the Impact Assessment

The life cycle impact assessment results of the considered WLO treatment processes at the midpoint and aggregated endpoint levels are summarized in Table 10. The ReCiPe 2016 method calculates the impacts within 18 different midpoint categories. However, in-depth analyses of the results have shown that only a few of them are relevant in terms of their contribution to the overall environmental impacts in their respective area of protection. The combined effect of global warming and fine particulate matter formation predominates the impact within the human health area of protection. Emissions of fine particulates and greenhouse gases (or their avoidance) contribute with around 95% to the overall results within the human health damage category in 7 out of the 8 analysed processes. In Inc1, the avoidance of carcinogenic pollutants is also an important contributor to the aggregated results within the human health damage category. Changes in global warming, terrestrial acidification, and ozone formation cause most of the effects within the ecosystem quality damage category, whereas the contribution of all other impact categories was minimal (less than 2%). Changes in fossil fuel stocks can almost completely account for the results within the resource availability damage category.
In the substitution method, the inventory of the substituted (avoided) process is subtracted from the inventory of the analysed system, often resulting in negative overall environmental impacts [44]. The negative numbers in Table 10 indicate that there is a net benefit from the analysed waste management process as the overall impact of waste treatment is more than compensated by the avoided impacts from processes substituted with the co-products. The highest GHG savings are achieved in the CemK process (1100 kg CO2 eq/1000 kg WLO; Table 10), which can be accounted for by relatively high avoided carbon emissions associated with petroleum coke combustion (3.37 kg CO2/kg petroleum coke [40]). The re-refining of used lubricant oil can also contribute to the reduction of global warming, regardless of the technology applied. On average, GHG emissions with a potential impact of 516 kg CO2 eq are avoided with the re-refining of 1000 kg of used lubricant oil. Conversely, the incineration of WLO in hazardous-waste incinerators would lead to an increase in GHG emissions even when full energy recovery is assumed (Table 10). In terms of fossil fuel savings, the re-refining technologies performed slightly better than the CemK and Inc1 processes, resulting in an average saving of 1026 kg fossil oil equivalents (ca. 43 GJ) with each metric ton of WLO treated (Table 10). These results are fairly consistent with the results of Fehrenbach, who estimated that between 380 and 534 kg of CO2 eq and 1043 and 1110 kg of fossil oil equivalents were saved with the re-refining of 1000 kg of used lubricant oil depending on the re-refining technique [40]. Pires and Martinho concluded that, on average, 39 million kg CO2 eq could be saved in Portugal with the re-refining of 36,115 metric tons of the WLO generated in 2010 (corresponding to 1092 kg CO2 eq/1000 kg of WLO). More significant fossil fuel savings achieved by Pires and Martinho can be accounted for by the different system boundaries and inventory datasets used by the authors [8]. Boughton and Horvath [5] and Collins et al. [3] investigated the life cycle environmental impacts of various used oil management methods in the USA. However, a direct comparison cannot be drawn between their results because they used different functional units and different approaches to the issue of multifunctionality.
The ReCiPe endpoint values indicate the magnitude of damage caused to human health, ecosystem quality, and resource availability (Figure 4, Figure 5 and Figure 6). With the sole exemption of Inc2, the impacts of different waste management processes are negative in all three damage categories considered as the avoided impacts for the recovered materials and/or energy are higher than those caused by the re-refining or combustion/incineration processes. As shown in Figure 4, the damage caused to human health by the re-refining process (without credits) is estimated at 0.0013 DALY/t WLO (average of the five re-refining technologies).
With the credits for the recovered energy and materials, human health damage is reduced to −0.0014 DALY/t WLO. The combustion of WLO in cement kilns and hazardous-waste incinerators causes larger damage to human health than the re-refining process (0.0045 and 0.0028 DALY/t WLO, respectively). However, these processes are more favourable when avoided impacts are considered.
The WLO re-refining processes (without credits) consume more non-renewable resources than both the incineration of WLO in heating plants and the burning of WLO in cement kilns (Figure 6). This is due to larger amounts of electricity and fossil fuels used as auxiliary energy sources in the re-refining processes than in other waste management options. However, after applying the credits for energy and materials recovery, the impact on reducing availability reduces to −475 USD (average of the five re-refining processes), indicating a significant saving in non-renewable resources. Since more energy is recovered in CemK in comparison to the incinerators (Inc1), the estimated savings in non-renewable resources (with credits) for the assumed CemK option is higher than that of the incinerators: −407 USD/t for the CemK and −237 MJ/t for the Inc1 option.
The aggregated endpoint results obtained (Figure 4, Figure 5 and Figure 6) clearly indicate that the choice of the most or least environmentally advantageous waste management process is ambivalent and depends greatly on the environmental aspects considered. Re-refining is evidently favoured in terms of fossil resource savings. However, the combustion of used oil in cement kilns (i.e., the substitution of petroleum coke) exerts the most beneficial effects on ecosystem quality. On the other hand, the combustion of used oil in hazardous-waste incinerators with energy recovery is the best option provided the protection of human health is the highest priority. Another important observation is that the results obtained are very dependent on the assumptions made regarding the substituted processes. In this study, all the systems have been credited for the products that they generate (materials and energy) assuming that each product can be fully utilized. However, the lack of demand for such products in declining markets could lead to their underutilization, indicating that they are used only partially or not at all [47]. If the generated product is not fully utilized, any additional supply would go to waste depositing as the market is already oversupplied [48]. Consequently, no credits would be given for such product because the LCA does not consider the environmental impacts associated with the disposal process.
Figure 7, Figure 8 and Figure 9 show the potential environmental benefits of implementing various WLO management options in RSerb on an annual basis. The ReRavg process represents the average environmental impact of the five re-refining processes (ReR1-5) considered in the study. The results obtained at an aggregated endpoint level indicate that Scenarios 1 and 2 are significantly better management options than the other two management options considered. From a human health and environmental impact perspective (Figure 7 and Figure 8), Scenario 2 performs the best (including the re-refining, cement kiln incineration, and incinerator combustion with energy recovery of WLO). Conversely, if reducing the consumption of fossil resources is of primary concern, Scenario 1 was found the most suitable WLO management option (Figure 9).
Table 11 summarizes the life cycle impact assessment results at the midpoint level for the four WLO management options considered. Only the results obtained for the four most relevant midpoint impact categories (in terms of their contribution to the total impact at the aggregated endpoint level) are presented herein. At the state level, up to 22,100 t CO2 equivalent and 34,300 t oil equivalent could be saved annually if WLO is treated according to Scenario 1. Annual GHG savings from the Scenario 1 re-refining processes were estimated at 13,748 t CO2 eq, whereas additional savings (8385 t CO2 eq) could be expected from the incineration of WLO in cement kilns (CemK). Compared to Scenario 1, the implementation of Scenario 2 in Serbia would result in lower savings relative to avoided GHG emissions and fossil fuel consumption (13,305 t CO2 equivalent and 31,800 t oil equivalent on an annual basis). However, Scenario 2 would have more favourable impacts with regard to fine particulate matter formation and terrestrial acidification (Table 11).

5. Conclusions

The present study conclusively demonstrates that a substantial part of hazardous waste in the form of WLO remains untreated in Serbia, whereas large amounts of waste WLO are disposed of in unknown locations. The annual amount of untreated WLO in Serbia was used to propose different WLO management options that could be implemented in Serbia in the future.
The results obtained indicate that the WLO management scenario involving a combination of different WLO treatment processes (namely the re-refining of WLO to recover base oil sand the burning of WLO in cement kilns or waste incinerators with energy recovery) would have the most favourable impact on human health and ecosystems. However, if the preservation of fossil resources is of primary concern, then the scenario involving the burning of WLO in cement kilns and different re-refining techniques is the preferable choice. This is because the energy and/or materials recovered in the latter two processes could be used as a substitute for various fossil-based products, thus leading to significant resource preservation.
A detailed inventory and the life cycle impact assessment results for the treatment of 1000 kg of WLO (using common treatment techniques) are presented in the study. The results obtained are relevant for Serbia, but, after modifying some country-specific data (for example, the electricity mix), the datasets created could be used to estimate the impacts of WLO management models in other countries inclined to use one or a mix of the treatment techniques described herein.
Future research should focus on finding more effective and efficient ways of collecting the currently uncollected and untreated WLO in Serbia, which causes considerable harm to the environment. Future models should also include various pre-treatment processes that could enhance the efficiency of treatment processes and improve the quality of the co-products obtained.

Author Contributions

The contribution of the authors to this manuscript can be defined as conceptualization, L.D., M.J., D.Š. and V.K.; methodology, L.D., S.M., M.J. and M.O.; software, M.J., F.K. and D.Š.; validation, L.D., S.M. and F.K.; formal analysis, L.D., S.M., M.J. and D.Š.; investigation, L.D., S.M., M.J., F.K., D.Š., V.K. and M.O.; resources, S.M., D.Š. and F.K.; data curation, S.M., M.J. and F.K.; writing—original draft preparation, L.D., S.M., M.J., F.K., D.Š., V.K. and M.O.; writing—review and editing, L.D., S.M., M.J., F.K., D.Š., V.K. and M.O.; visualization, L.D., S.M., M.J. and D.Š.; supervision, S.M.; project administration, L.D. and S.M. All authors have read and agreed to the published version of the manuscript.

Funding

This research (paper) has been supported by the Ministry of Education, Science and Technological Development through the project No. 451-03-68/2020-14/200156 and project No. 451-03-9/2021-14/200134.

Institutional Review Board Statement

Not applicable.

Informed Consent Statement

Not applicable.

Data Availability Statement

The data presented in this study are available online. https://zenodo.org/record/5055128 (accessed on 16 May 2021).

Acknowledgments

The authors wish to thank the referee(s) for useful suggestions that essentially improved the manuscript.

Conflicts of Interest

The authors declare no conflict of interest.

References

  1. Communication from the Commission to the Council, the European Parliament, the European Economic and Social Committee and the Committee of the Regions—Thematic Strategy on the Sustainable Use of Natural Resources. Brussels: EU Publications. COM (2005) 670 Final. 2005. Available online: http://eur-lex.europa.eu (accessed on 28 April 2021).
  2. Unated Nations. Transforming Our World: The 2030 Agenda for Sustainable Development. 2015. Available online: https://sustainabledevelopment.un.org/post2015/transformingourworld (accessed on 28 April 2021).
  3. Collins, M.; Schiebel, K.; Dyke, P. Life Cycle Assessment of Used Oils Management; Environmental Resources Management Limited and American Petroleum Institute: Washington, DC, USA, 2017; pp. 1–367. Available online: https://www.api.org/~/media/Files/Certification/Engine-Oil-Diesel/Publications/LCA-of-Used-Oil-Mgmt-ERM-10012017.pdf (accessed on 28 April 2021).
  4. Finnveden, G.; Björklund, A.; Moberg, A.; Ekvall, T.; Moberg, Å. Environmental and economic assessment methods for waste management decision-support: Possibilities and limitations. Waste Manag. Res. 2007, 25, 263–269. [Google Scholar] [CrossRef]
  5. Boughton, B.; Horvath, A. Environmental assessment of used oil management methods. Environ. Sci. Technol. 2004, 38, 353–358. [Google Scholar] [CrossRef] [Green Version]
  6. Kalnes, T.N.; Shonnard, D.R.; Schuppel, A. LCA of a spent lube oil re-refining process. Comput. Aided Chem. Eng. 2006, 21, 713–718. [Google Scholar] [CrossRef]
  7. Botas, J.A.; Moreno, J.; Espada, J.J.; Serrano, D.P.; Dufour, J. Recycling of used lubricating oil: Evaluation of environmental and energy performance by LCA. Resour. Conserv. Recycl. 2017, 125, 315–323. [Google Scholar] [CrossRef]
  8. Pires, A.; Martinho, G. Life cycle assessment of a waste lubricant oil management system. Int. J. Life Cycle Assess. 2013, 18, 102–112. [Google Scholar] [CrossRef]
  9. Pinheiro, C.T.; Quina, M.J.; Gando-ferreira, L.M. Management of waste lubricant oil in Europe: A circular economy approach. Crit. Rev. Environ. Sci. Technol. 2020, 50, 1–37. [Google Scholar] [CrossRef]
  10. Hassanain, E.M.; Yacout, D.M.M.; Metwally, M.A.; Hassouna, M.S. Life cycle assessment of waste strategies for used lubricating oil. Int. J. Life Cycle Assess 2017, 22, 1232–1240. [Google Scholar] [CrossRef]
  11. Environmental Protection Agency. EPA Lifecycle Analysis of Greenhouse Gas Emissions from Renewable Fuels, E.P.A. 2010. Available online: https://nepis.epa.gov/Exe/ZyNET.EXE?ZyActionL=Register&User=anonymous&Password=anonymous&Client=EPA&Init=1 (accessed on 28 April 2021).
  12. Zaharioiu, A.; Bucura, F.; Ionete, E.I.; Ionete, R.E.; Ebrasu, D.; Sandru, C.; Marin, F.; Oancea, S.; Niculescu, V.; Miricioiu, M.G.; et al. Thermochemical Decomposition of Sewage Sludge—An Eco-Friendly Solution for a Sustainable Energy Future by Using Wastes. Rev. Chim. 2020, 71, 171–181. [Google Scholar] [CrossRef]
  13. Kanokkantapong, V.; Kiatkittipong, W.; Panyapinyopol, B.; Wongsuchoto, P.; Pavasant, P. Used lubricating oil management options based on life cycle thinking. Resour. Conserv. Recycl. 2009, 53, 294–299. [Google Scholar] [CrossRef]
  14. European Commission. Critical Review of Existing Studies and Life Cycle Analysis on the Regeneration and Incineration of WO, Taylor Nelson. 2001. Available online: https://ec.europa.eu/environment/pdf/waste/studies/oil/waste_oil_xsum.pdf (accessed on 28 April 2021).
  15. German Federal Environmental Agency. Integrierte Vermeidung und Verminderung der Umweltverschmutzung (IVU), Merkblatt Über die Besten Verfügbaren Techniken für Abfallbehandlungsanlagen Mit Ausgewählten Kapiteln in Deutscher Übersetzung. 2006. Available online: https://www.umweltbundesamt.de/sites/default/files/medien/419/dokumente/bvt_abfallbehandlung_zf.pdf (accessed on 28 April 2021).
  16. Groupement Européen de l’Industrie de la Régénération (GEIR). Waste lube oil Management in Europe. In Proceedings of the Green Planet Association Annual Conference, Bucharest, Romania, 28 May 2015; Available online: https://docplayer.net/47330491-Waste-lube-oil-management-in-europe.html (accessed on 29 April 2021).
  17. Rincón, J.; Cañizares, P.; García, M.T. Regeneration of used lubricant oil by ethane extraction. J. Supercrit. Fluid 2007, 39, 315–322. [Google Scholar] [CrossRef]
  18. Hamilton, S.F.; Sunding, D.L. Optimal recycling policy for used lubricating oil: The case of california’s used oil management policy. Environ. Resour. Econ. 2015, 62, 3–17. [Google Scholar] [CrossRef]
  19. Zakaria, M.P.; Takada, H.; Tsutsumi, S.; Ohno, K.; Yamada, J.; Kouno, E.; Kumata, H. Distribution of polycyclic aromatic hydrocarbons (PAHs) in rivers and estuaries in Malaysia: A widespread input of petrogenic PAHs. Environ. Sci. Technol. 2002, 36, 1907–1918. [Google Scholar] [CrossRef]
  20. Jahromi, F.A.; Kannan, N.; Zakaria, M.P.; Aris, A.Z. Persistent contaminants in waste oils: A short review on PCBs and PAHs as main contaminants. In From Sources to Solution; Aris, A., Tengku Ismail, T., Harun, R., Abdullah, A., Ishak, M., Eds.; Springer: Singapore, 2014. [Google Scholar] [CrossRef]
  21. Guerin, T. Environmental liability and life-cycle management of used lubricating oils. J. Hazard. Mater. 2008, 160, 256–264. [Google Scholar] [CrossRef]
  22. El-Fadel, M.; Khoury, R. Strategies for vehicle waste-oil management: A case study. Resour. Conserv. Recycl. 2001, 33, 75–91. [Google Scholar] [CrossRef]
  23. Ucar, S.; Karagoz, S.; Yanik, J.; Saglam, M.; Yuksel, M. Copyrolysis of scrap tires with waste lubricant oil. Fuel Process. Technol. 2005, 87, 53–58. [Google Scholar] [CrossRef]
  24. Lam, S.S.; Russell, D.A.; Lee, L.C.; Chase, A.H. Microwave-heated pyrolysis of waste automotive engine oil: Influence of operation parameters on the yield, composition, and fuel properties of pyrolysis oil. Fuel 2012, 92, 327–339. [Google Scholar] [CrossRef]
  25. Sınağ, A.; Gülbay, S.; Uskan, B.; Uçar, S.; Özgürler, B.S. Production and characterization of pyrolytic oils by pyrolysis of waste machinery oil. J. Hazard. Mater. 2010, 173, 420–426. [Google Scholar] [CrossRef]
  26. Fuchs. Future Challenges of the Lubricants Industry. 2018. Available online: https://www.fuchs.com/fileadmin/Home/Praes-entation/2018/180618_FCMD_CTO.pdf (accessed on 29 April 2021).
  27. Statistical Office of the Republic of Serbia. Available online: https://publikacije.stat.gov.rs/G2019/Pdf/G20191171.pdf (accessed on 29 April 2021).
  28. Environmental Protection Agency. Available online: http://www.sepa.gov.rs/download/Otpad_2011-2019_Finale.pdf (accessed on 29 April 2021).
  29. Xintao, H.; Jianxin, Z.; Qiong, D. Environmental life-cycle comparisons of two polychlorinated biphenyl remediation technologies: Incineration and base catalyzed decomposition. J. Hazard. Mater. 2011, 191, 258–268. [Google Scholar] [CrossRef]
  30. Rahman, A.; Rasul, M.G.; Khan, M.M.K.; Sharma, S. Recent development on the uses of alternative fuels in cement manufacturing process. Fuel 2015, 145, 84–99. [Google Scholar] [CrossRef]
  31. LafargeHolcim. Detailed Information on the Plant, Processes and Procedures. 2018. Available online: http://www.ekourbapv.vojvodina.gov.rs/wp-content/uploads/2018/10/III_Detaljni-podaci-o-postrojenju_LBFC-2018.pdf (accessed on 29 April 2021).
  32. Madlool, N.A.; Saidur, R.; Hossain, M.S.; Rahim, N.A. A critical review on energy use and savings in the cement industries. Renew. Sustain. Energy. Rev. 2011, 15, 2042–2060. [Google Scholar] [CrossRef]
  33. Mokrzyckia, E.; Uliasz-Bochenczyk, A.; Sarna, M. Use of alternative fuels in the polish cement industry. Appl. Energy 2003, 74, 101–111. [Google Scholar] [CrossRef]
  34. Rahman, A.; Rasul, M.G.; Khan, M.M.K.; Sharma, S. Impact of alternative fuels on the cement manufacturing plant performance: An overview. Procedia Eng. 2013, 56, 393–400. [Google Scholar] [CrossRef] [Green Version]
  35. Folliet, M.; Rivas, S.M. Increasing the Use of Alternative Fuels at Cement Plants: International Best Practice, International Finance Corporation. 2017. Available online: https://www.ifc.org/wps/wcm/connect/33180042-b8c1-4797-ac82-cd5167689d39/Alternative_Fuels_08+04.pdf?MOD=AJPERES&CVID=lT3Bm3Z (accessed on 29 April 2021).
  36. Lafarge. Industrial Ecology. Available online: https://www.lafarge.rs/2_2_2-Industrial_ecology (accessed on 29 April 2021).
  37. [BREF 2010] European Commission JRC-IPTS, IPPC Reference Document on Best Available Techniques in the Cement, Lime and Magnesium Oxide Manufacturing Industries. Available online: http://eippcb.jrc.ec.europa.eu/reference/ (accessed on 29 April 2021).
  38. Commission for Protection of Competition of the Republic of Serbia. Report on the Analysis of Competition Conditions on the Cement Market in the Republic of Serbia in the Period 2014–2017. Available online: http://www.kzk.gov.rs/kzk/wp-content/uploads/2018/12/Analiza-uslova-konkurencije-na-tr%C5%BEi%C5%A1tu-cementa-u-RS-2014-2017.pdf (accessed on 29 April 2021).
  39. Statistical Office of the Republic of Serbia. Manufacture of Industrial Products for 2015 to 2019 Years. Available online: https://www.stat.gov.rs/sr-latn/oblasti/industrija/proizvodnja-industrijskih-proizvoda-1/ (accessed on 29 April 2021).
  40. Fehrenbach, H. Ecological and Energetic Assessment of Re-Refining Used Oils to Base Oils: Substitution of Primarily Produced Base Oils including Semi-Synthetic and Synthetic Compounds; Institute for Energy and Environmental Research (IFEU): Heidelberg, Germany, 2005; Available online: https://www.ifeu.de/fileadmin/uploads/GEIR-final-report-LCA-21-04-05.pdf (accessed on 29 April 2021).
  41. Steubing, B.; Wernet, G.; Reinhard, J.; Bauer, C.; Moreno-Ruiz, E. The ecoinvent database version 3 (part II): Analyzing LCA results and comparison to version 2. Int. J. Life Cycle Assess 2016, 21, 1269–1281. [Google Scholar] [CrossRef] [Green Version]
  42. Ekvall, T.; Assefa, G.; Björklund, A.; Eriksson, O.; Finnveden, G. What life-cycle assessment does and does not do in assessments of waste management. Waste Manag. 2007, 27, 989–996. [Google Scholar] [CrossRef] [PubMed]
  43. Doka, G. Life Cycle Inventories of Waste Treatment Services, Ecoinvent report No. 13, Swiss Centre for Life Cycle Inventories 2003. Available online: https://www.doka.ch/13_I_WasteTreatmentGeneral.pdf (accessed on 29 April 2021).
  44. Moretti, C.; Corona, B.; Edwards, R.; Junginger, M.; Moro, A.; Rocco, M.; Shen, L. Reviewing ISO Compliant Multifunctionality Practices in Environmental Life Cycle Modeling. Energies 2020, 13, 3579. [Google Scholar] [CrossRef]
  45. Huijbregts, M.A.; Steinmann, Z.J.; Elshout, P.M.; Stam, G.; Verones, F.; Verones, F.; Vieira, M.; Zijp, M.; Hollander, A.; Van Zelm, R. ReCiPe2016: A harmonised life cycle impact assessment method at midpoint and endpoint level. Int. J. Life Cycle Assess 2017, 22, 138–147. [Google Scholar] [CrossRef]
  46. Di Noi, C.; Ciroth, A.; Srocka, M. OpenLCA 1.7. Comprehensive User Manual. GreenDelta GmbH 2017. Available online: https://www.openlca.org/wp-content/uploads/2017/11/openLCA1.7_User_Manual_v1.1.pdf (accessed on 29 April 2021).
  47. Ekvall, T. Attributional and consequential life cycle assessment. In Sustainability Assessment at the 21st Century; IntechOpen: New York, NY, USA, 2019. [Google Scholar] [CrossRef] [Green Version]
  48. European Commission—Joint Research Centre—Institute for Environment and Sustainability. International Reference Life Cycle Data System (ILCD) Handbook—General Guide for Life Cycle Assessment—Detailed Guidance, 1st ed.; EUR 24708 EN; Publications Office of the European Union: Luxembourg, 2010; Available online: https://eplca.jrc.ec.europa.eu/uploads/ILCD-Handbook-General-guide-for-LCA-DETAILED-GUIDANCE-12March2010-ISBN-fin-v1.0-EN.pdf (accessed on 29 April 2021).
Figure 1. Waste lubricant oil treatment. The purple squares of dashed lines indicate potential scenarios for WLO treatment. ReR1 ÷ ReR5—WLO treatment by the re-refining process (Cyclon, Evergreen, HyLube, MRD, and Viscolube), Inc1 and Inc2—WLO treatment by incineration, CemK—WLO treatment in cement kilns.
Applsci 11 06652 g001
Figure 2. The model for waste oil collection, management and treatment in Serbia in 2020. Solid red lines (arrows) indicate the financial flows (€/year): 1. income from new lubricant oils sold, 2. waste oil charge, 3. subsidies for waste oil collection, 4. waste management tax (green tax), 5. payment to the municipal collection points, 6. payment to the collection company, 7. distribution of the waste oil collection subsidies, 8. payment for the waste oil delivery, 9. oil export tax (incineration), and 10. waste oil disposal cost. Dashed green lines (arrows) indicate the material flows (t/year): 1. new lubricant oils sold, 2. transportation of waste oil to the municipal collection or companies’ internal collection points, 3. waste oil collected through the official collection system, 4. waste oil left outside the official collection system or disposed of illegally, 5. waste oil sent to the treatment or disposal plants, 6. waste oil undergoing the re-refining process, 7. waste oils left after the re-refining process (not suitable for further production), and 8. waste oils left after the regeneration processes. Dashed red box (re-refining process)—A potential process to be introduced in addition to the existing processes for waste oil treatment.
Applsci 11 06652 g002
Figure 3. Ratios between untreated, treated, and exported quantities of WLO and the amounts of new lubricating oil placed on the market [27,28].
Applsci 11 06652 g003
Figure 4. Impact of different WLO treatment technologies on human health (per 1000 kg WLO).
Applsci 11 06652 g004
Figure 5. Impact of different WLO treatment technologies on the ecosystem (per 1000 kg WLO).
Applsci 11 06652 g005
Figure 6. Impact of different WLO treatment technologies on resource availability (per 1000 kg WLO).
Applsci 11 06652 g006
Figure 7. Potential impact of different WLO management scenarios on human health in Serbia (on an annual basis).
Applsci 11 06652 g007
Figure 8. Potential impact of different WLO management scenarios on the ecosystem in Serbia (on an annual basis).
Applsci 11 06652 g008
Figure 9. Potential impact of different WLO management scenarios on resource availability in Serbia (on an annual basis).
Applsci 11 06652 g009
Table 1. Quantities of created WLO in (t) from 2015 to 2019 [27].
Source WLO20152016201720182019
WLOPCB∗WLOPCB∗WLOPCB∗WLOPCB∗WLOPCB∗
Agriculture, forestry, and fisheries--1633--111-68-
Mining97013917--2765612949
Manufacturing industry234628644735--462449544447
Power supply energy, gas, and steam3996775473100--286-323-
Water supply and wastewater management332291--281291
Construction128-18023--133-397-
Service sectors16811120919--1817113613
In TOTAL468468068640198--9764577751100
PCB∗—waste oil with PCB.
Table 2. Quantities of placed, made, treated, and exported oils in (t) from 2015 to 2019 [27,28].
YearNew Oil
[t]
Made WLO +PCB (Table 2)
[t]
Treated WLO
[t]
Exported WLO
[t]
201520,76811,4903042245
201616,97188384343116
201717,699-596741
201819,09898215042186
201938,6537851234844
Table 3. Ways of treatment and quantities of generated hazardous waste in Serbia in the period from 2015 to 2019 [27,28].
Year Incineration as a Fuel for Energy ProductionBurning
on
the Land
Recycled
(Filtering)
Disposal
on
the Land
Other
Ways
In Total
[t]
2015[%]15.237.55.339.5-
[t]46211411611202-2966
2016[%]9.0-3.839.10.1
[t]391-16516980.432254.43
2017[%]-----
[t]------
2018[%]8.6-4.132.7-
[t]434 2071649-2290
2019[%]4.1-3.926-
[t]96 92611-799
Table 4. Ratio of untreated and marketed oil [27,28].
YearMNO LY
[t]
MTWLOCY
[t]
MEX WLO
[t]
MUWLO
[t]
MUWLO
[%]
201420,767
201520,768304224517,48084.17
201616,971434311616,30978.53
201717,69959674110,96364.60
201819,098504218612,47170.46
201938,65323484416,70687.47
2020-4148 1126 234,37988.94
1,2 data obtained as the average values of previous years.
Table 5. Use of alternative fuels in different countries or regions [30].
Country or RegionSubstitution [%]Country or RegionSubstitution [%]
Australia (2013)7.8Germany (2010)53.6
Japan (2012)15.5EU (2012)18
Sweden (2011)45Poland (2010)45
Switzerland (2012)41Spain (2011)22.4
Nederlands (2011)85Belgium (2011)60
Canada (2008)11.3USA (2004)8
Table 6. Types of waste used as alternative fuels in the cement industry (%).
Waste Used as an Alternative Fuel
(%)
Holcim Group
(2011)
Cemex Group
(2011)
Heidelberg Group
(2011)
Italcementi Group
(2011)
Lafarge Group
(2011)
Waste oil5 3.78.522.1
Solvent and liquid waste11 4.721.9
Tyres101611.614.919.7
Impregnated sawdust6
Plastic9 26.44.733.1
Industrial and household waste (solid) 65 13.8
Industrial waste and other fossil-based fuel30
MBM246.115.7
Agricultural waste9104.211.1
Wood chip and other biomass15524.5 25.1
Sewage Sludge2 4.21.7
RDF 7.8
Other alternative fuel 14.6
Table 7. Ratios of treated (regenerated), untreated, and burned WLOs in clinker production (t/year).
YearMPC [39]
[t]
MTWLOCY
[t]
MUWLO
[t]
MBCKWLO
[t]
MBCKWLO
[%]
MDWLO
[t]
MDWLO
[%]
20151,654,390304217,48064693711,01163
20161,800,805434316,309704243.2926756.8
20171,907,689596710,963759369.26337030.74
20182,092,501504212,471818365.62428834.38
20192,151,404234816,706841350.36829349.64
20201,921,358 14148 234,379 3777722.6226,60277.38
1,2,3 data obtained as the average values of previous years.
Table 8. Different WLO treatment scenarios considered in this study.
UnitBurning in Cement Kilns (CemK)Re-Refining
(ReR1 to ReR5)
Burning in HWI with Energy Recovery
(Inc1)
Burning in HWI without Energy Recovery (Inc2)
Scenario 1t777726,602
Scenario 2t777713,30113,301
Scenario 3t7777886788678867
Scenario 4t5967947094709470
Table 9. Co-products obtained from different waste management processes and the main substitution assumptions.
Co-Product
(Output)
Relevant for TechnologySubstituted (Avoided) Process and Source of LCI DataSubstituted at Assumed Mass or Energy Ratio
Base oilReR1–ReR5Base oils produced in petroleum refinery (a)1:1
NaphthaReR1Naphtha produced in petroleum refinery (a)1:1
Light endsReR5Bitumen seal production (a)1:1
Flux oilReR3, ReR4Bitumen seal production (a)1:1
Gas oilReR2, ReR5Light fuel oil produced in petroleum refinery (a) (in ReR2) or diesel fuel produced in petroleum refinery (a) (in ReR5)1:1
Light fuel oilReR1Light fuel oil produced in petroleum refinery (a)1:1
Heavy fuel oil and residuesReR1, ReR3Heavy fuel oil produced in petroleum refinery (a)1:1
Bitumen additiveReR2Bitumen seal production (a)1:1
Heat from the combustion of waste oilCemK, Inc1Heat from petroleum coke (b) (in CemK), heat from natural gas (in Inc2) (a)1:1
Electricity from the combustion of waste oilInc1Electricity production (average Serbian electricity mix) (a)1:1
Sources of LCI data: (a) ecoinvent 3.7 cut-of LCI database [41]; (b) Emissions from the combustion of petroleum coke and the lower heating value of petroleum coke and waste mineral oil are available from [40], while the life cycle inventory data of petroleum coke production in petroleum refinery are available from the ecoinvent 3.7 LCI database [41].
Table 10. Life cycle impact assessment results at midpoint and aggregated endpoint levels (the net environmental impact of 1000 kg WLO treatment).
ReR1ReR2ReR3ReR4ReR5CemKInc1Inc2Unit
Midpoint impact categories
Freshwater eutrophication0.620.150.0680.170.12−0.023−1.70.18kg P eq
Freshwater ecotoxicity21−1.1−0.361.5−2.7−2.8−726.1kg 1,4-DCB
Stratospheric ozone depletion−0.001−8.9 × 10⁴−8.6 × 10⁴−8.8 × 10⁴−9.1 × 10⁴−7.0 × 10⁴−5.5 × 1041.1 × 105kg CFC11 eq
Marine ecotoxicity24−3.6−2.30.022−6.3−5.3−948.4kg 1,4-DCB
Human non-carcinogenic toxicity3806.6−8.246−25−69−1300160kg 1,4-DCB
Marine eutrophication0.040.0025−0.00110.0040.0027−0.003−0.115.4 × 104kg N eq
Fossil resource scarcity−1100−1000−1000−980−1000−900−8405kg oil eq
Global warming−530−460−460−540−600−11001502800kg CO2 eq
Ionizing radiation−18−21−22−22−26−24−570.78kBq Co-60 eq
Fine particulate matter formation−0.6−1.5−1.5−1.4−1.3−1.2−4.90.084kg PM2.5 eq
Human carcinogenic toxicity11−15−15−12−18−20−9929kg 1,4-DCB
Mineral resource scarcity−0.24−1.1−0.53−0.79−1.2−0.45−1.30.2kg Cu eq
Ozone formation, Human health−1.9−1.8−1.8−1.9−1.9−1.7−2.20.22kg NOx eq
Water consumption1.1−2.9−1.4−2.4−3.3−0.3−7.20.9m3
Terrestrial ecotoxicity−3600−140041−270−2700−620−450180kg 1,4-DCB
Terrestrial acidification−4.3−5−4.7−5.1−4.5−3.7−7.70.13kg SO2 eq
Ozone formation, Terrestrial ecosystems−2−2−1.9−2−2−1.8−2.30.22kg NOx eq
Land use−1.9−5.4−3.4−5.3−7.5−3.8−4.50.47m2 a crop eq
Aggregated endpoint categories
Damage to human health−7.5 × 10⁴−1.4 × 10³−1.4 × 10³−1.4 × 10³−1.5 × 10³−1.9 × 10³−3.6 × 1032.8 × 103DALY
Damage to ecosystem quality−2.3 × 10⁶−2.6 × 10⁶−2.5 × 10⁶−2.8 × 10⁶−2.9 × 10⁶−4.1 × 10⁶−2.8 × 1068.2 × 106species × yr
Damage to resource availability−540−460−460−450−470−410−2401.6USD
Table 11. Potential environmental impacts at midpoint level associated with different WLO management options in RSerb (on an annual basis).
Fossil Resource Scarcity
(kg Oil eq)
Global Warming (kg CO2 eq)Fine Particulate Matter Formation (kg PM2.5 eq)Terrestrial Acidification
(kg SO2 eq)
Scenario 1−3.43 × 10⁷−2.21 × 10⁷−4.33 × 10⁴−1.54 × 10⁵
Scenario 2−3.18 × 10⁷−1.33 × 10⁷−9.22 × 10⁴−1.94 × 10⁵
Scenario 3−2.35 × 1071.35 × 107−6.39 × 10⁴−1.38 × 10⁵
Scenario 4−2.30 × 1071.70 × 107−6.54 × 10⁴−1.39 × 10⁵
Publisher’s Note: MDPI stays neutral with regard to jurisdictional claims in published maps and institutional affiliations.

