
Effect of Column Flexural Stiffnesses on the Seismic Performance of Stiffened Steel Plate Shear Walls

1
School of Civil and Transportation Engineering, Guangdong University of Technology, Guangzhou 510006, China
2
School of Civil Engineering, Shi Jiazhuang Tiedao University, Shijiazhuang 050043, China
*
Author to whom correspondence should be addressed.
Buildings 2022, 12(11), 1965; https://doi.org/10.3390/buildings12111965
Submission received: 19 October 2022
/
Revised: 3 November 2022
/
Accepted: 9 November 2022
/
Published: 12 November 2022
(This article belongs to the Section Building Structures)
Abstract
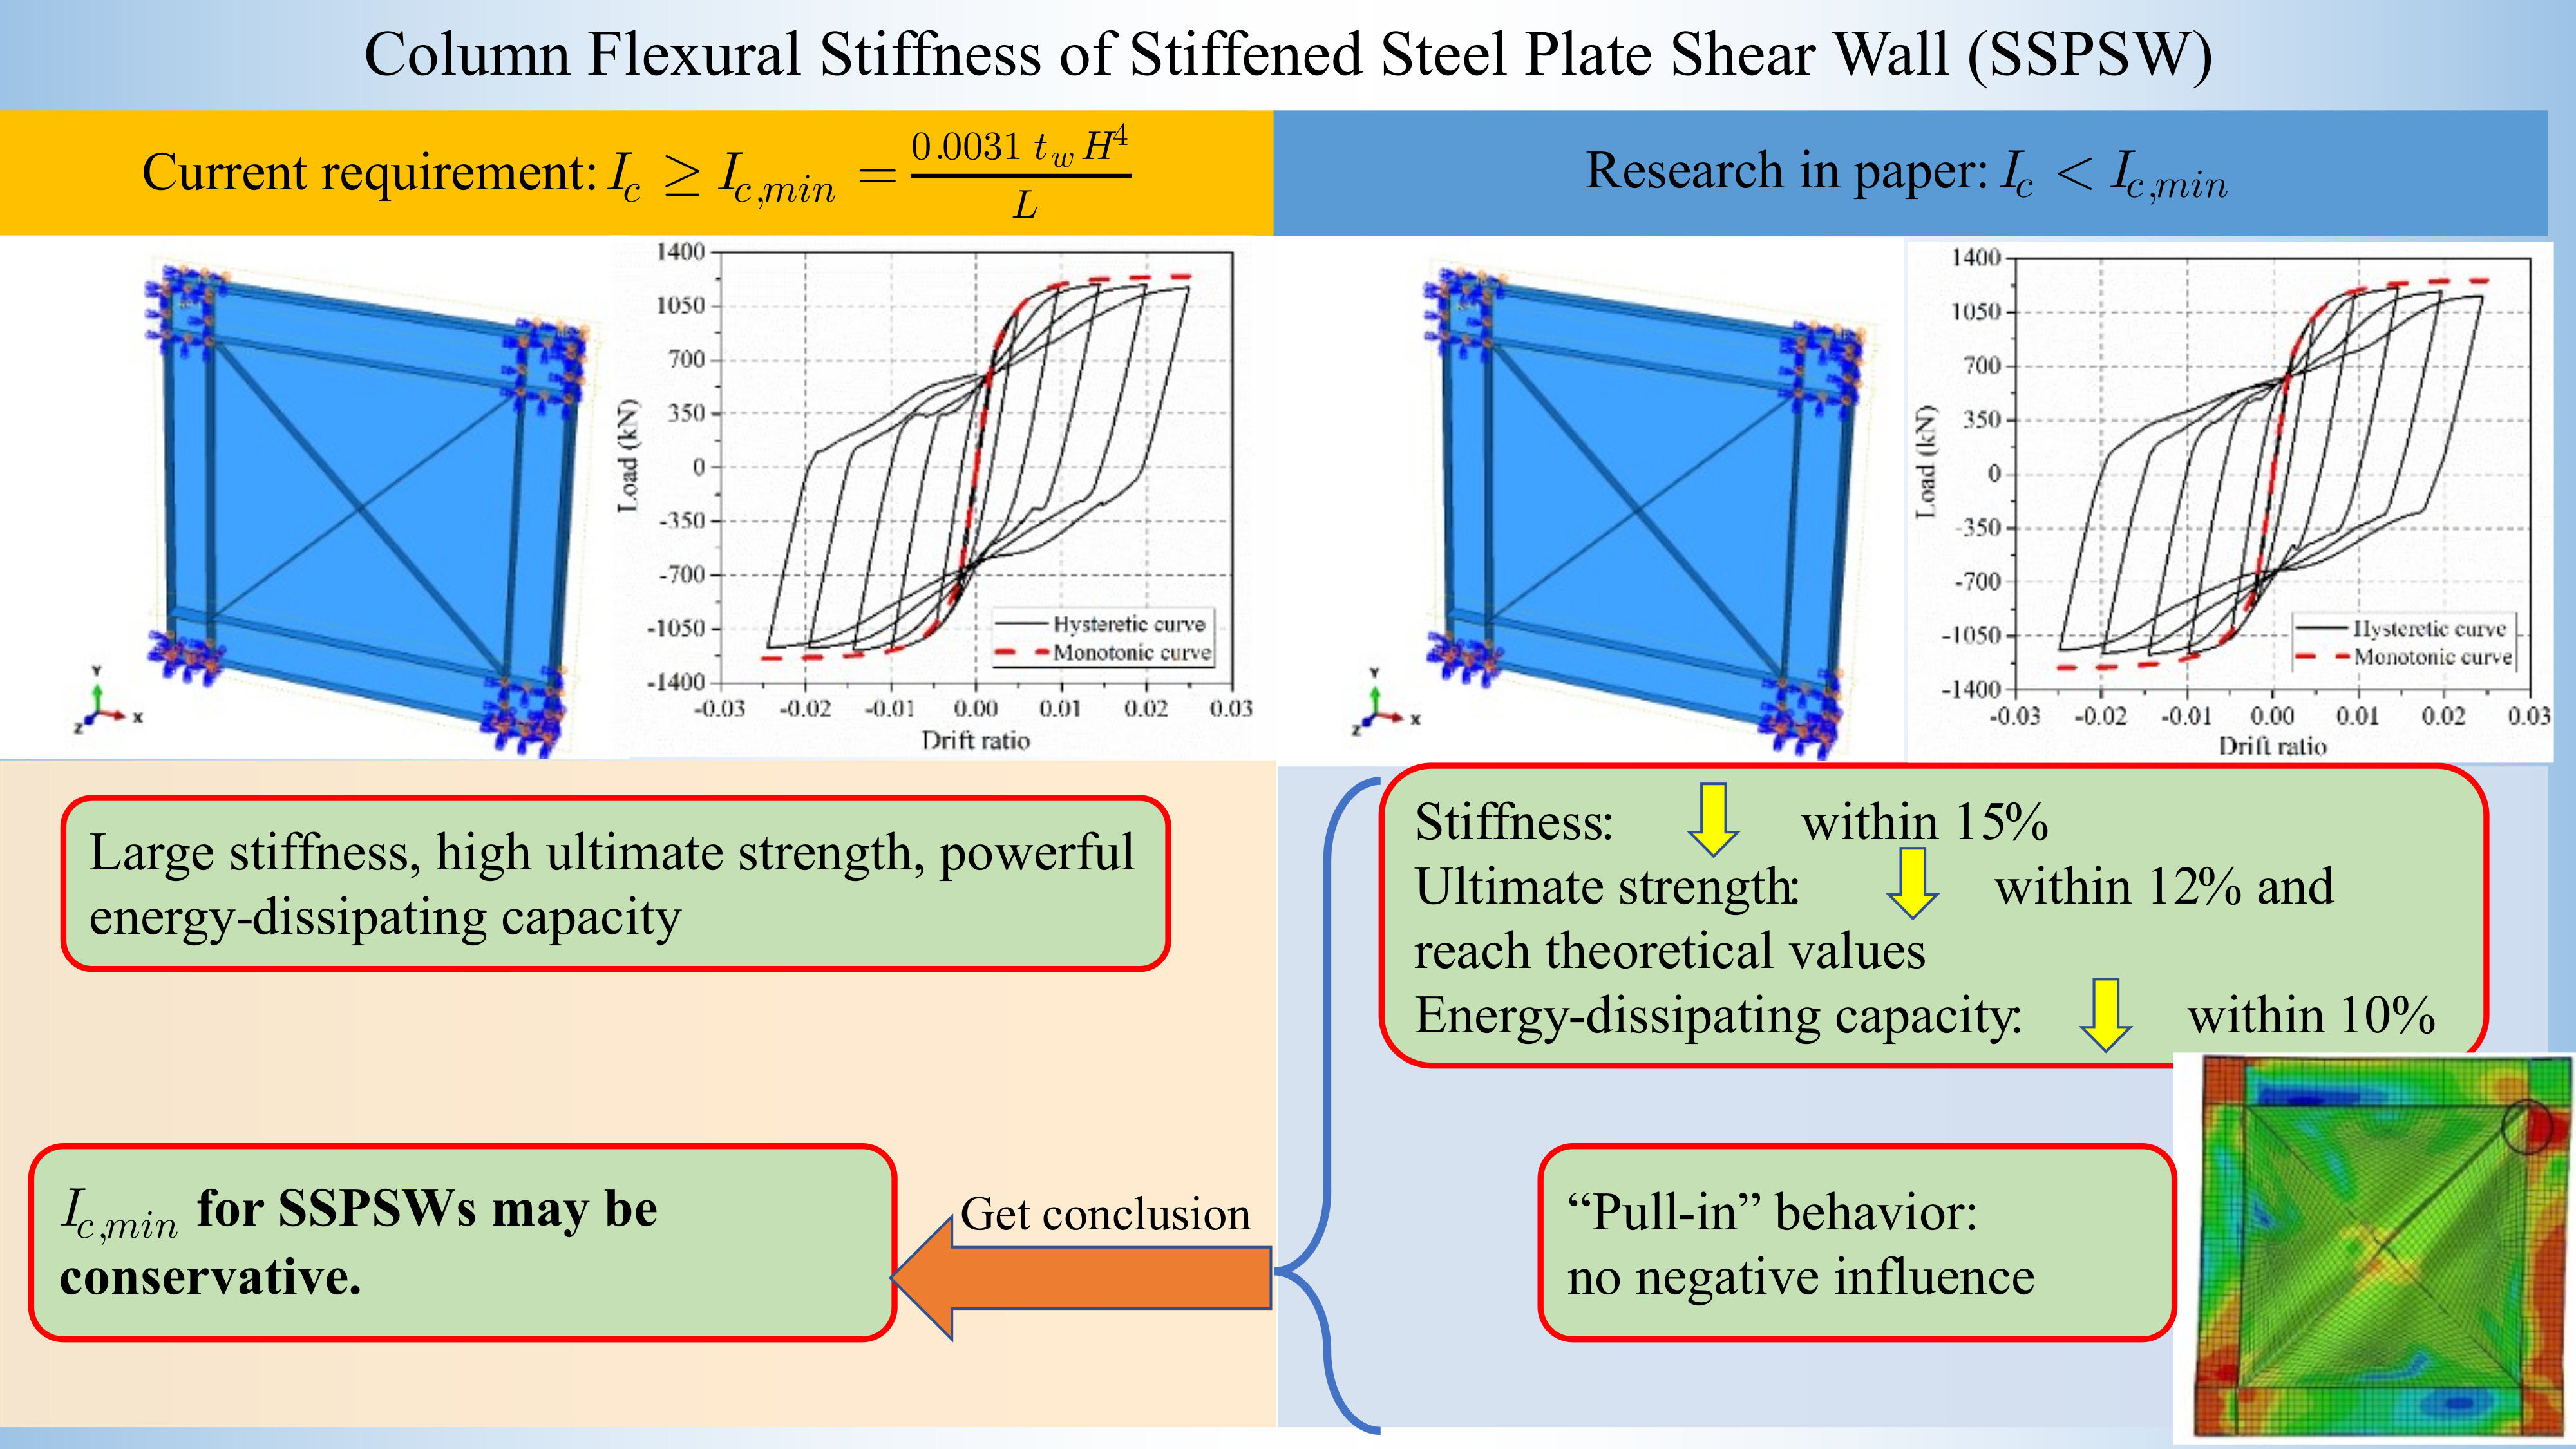
:Two types of lateral resistance structural systems, namely unstiffened steel plate shear walls (USPSWs) and stiffened steel plate shear walls (SSPSWs), are typically used in high-rise structures. Numerous experimental and numerical studies have been conducted on the structural performance of SSPSWs. However, few studies have been conducted to investigate the effect of column flexural stiffness on SSPSW systems. In this study, an analysis and numerical investigation of SSPSWs with variable column flexural stiffnesses was performed. The hysteretic performance, secant stiffness reduction and energy dissipation of SSPSWs with four column flexural stiffnesses were investigated. The column flexural stiffness reduction in the USPSWs and SSPSWs did not negatively influence the overall performance of drift ratios up to 2.5%. Moreover, the infill plates of the USPSWs and SSPSWs could achieve the ultimate strengths similar to the theoretical values despite the column not satisfying the minimum flexural stiffness requirements from CSA S16-09 and PEER/ATC72-1, which indicated that these requirements could be conservative.

1. Introduction
Steel plate shear walls (SPSWs) have been used in buildings in the USA, Japan, and Canada because of their high stiffness, high strength, and stable hysteretic characteristics [1,2]. SPSWs consist of a thin infill steel plate connected to columns and beams, which are called vertical boundary elements (VBEs) and horizontal boundary elements (HBEs). When resisting horizontal loads, unstiffened SPSWs (USPSWs) (Figure 1a) tend to buckle in shear at an early stage, and then form diagonal tension fields. To avoid early infill plate buckling and comprehensively utilize the infill plate, stiffened SPSWs (SSPSWs) (Figure 1b–d) have been proposed [3]. Owing to their superior utilization of the infill plate, SSPSWs exhibit even higher stiffness, strength, and energy dissipation than USPSWs do.
Several studies have been conducted on the structural performance of SSPSWs worldwide [4,5,6,7,8]. Sabouri-Ghomi and Sajjadi [9] conducted experiments with two similar one-story SPSWs with and without stiffeners to investigate their mechanical performance and revealed that stiffeners play a crucial role in the shear stiffness and shear yield displacement of the steel plate; however, their effect on the shear strength was negligible. Rahmzadeh et al. [10] investigated the influence of the rigidity and arrangement of stiffeners on the buckling performance of infill plates and revealed that the effective application of stiffeners in SSPSWs not only improved the structural behavior but also reduced the forces applied to boundary elements. Tong and Guo [11] studied the shear resistance behavior of stiffened steel corrugated shear walls. Their study indicated that stiffeners could not only restrain the out-of-plane displacement of the corrugated plate but also improve the shear strength and ductility of stiffened steel corrugated shear walls.
The effect of the column flexural stiffness on the performance of SPSWs has been investigated extensively. Machaly et al. [12] performed numerical analyses of USPSWs and concluded that the minimal column flexural stiffness requirement in AISC 341-10 [13] may not be sufficient to ensure the complete yielding of the infill plate. Curkovic et al. [14,15] investigated the seismic performance of USPSWs and composite plate shear walls (CPSWs) with variable column flexural stiffness values. Their studies revealed that the prescribed minimum column flexural stiffness requirements used for USPSWs and CPSWs were conservative. Furthermore, a column “pull-in” (bending in the direction close to the steel plate because of the tension field of the steel plate) did not exhibit a negative influence on the overall behavior of USPSW and CPSW systems.
Several standards include minimum flexural stiffness requirements for columns in SPSWs. Typically, the requirement is derived from the flexibility factor (ωh), which was first introduced by Wagner [16] in 1931 and is given by Equation (1). Kuhn et al. [17] and Qu and Bruneau [18] revealed that when ωh < 2.5, the maximum stress did not exceed the average stress within the tension field by more than 20%. In some standards [19], this limit is used directly, whereas in others [13,19], the requirement is used as a minimum allowable moment of inertia for the column (Ic,min). The limiting value is expressed by Equation (2) and is derived by setting the flexibility factor to 2.5.
where tw is the infill plate thickness, H is the story height, L is the SPSW width, and Ic is the moment of inertia of the column area. However, Qu and Bruneau [18] investigated the column flexural stiffness requirement for USPSW systems and concluded that the minimum column flexural stiffness requirement could be conservative. They suggested that further research studies should be conducted to confirm these findings. However, few research studies have explored whether this requirement is conservative for SSPSW systems. The effect of the column flexural stiffness on SSPSW systems is yet to be investigated.
Various simulation methods for the analysis of steel structures have been proposed and their reliabilities have been verified [20,21,22]. In this study, numerical analysis was performed to investigate the effect of the column flexural stiffness on the seismic performance of SSPSWs. First, a suite of SSPSWs was selected. The SSPSWs varied in column flexural stiffness and stiffener arrangement, but all satisfied the capacity design requirements. An initial investigation was performed to identify the stiffener dimensions that achieved full bracing of the infill plate. When suitable stiffener dimensions were selected, the seismic performances of the SSPSWs were investigated. Then, three groups of SSPSW models with different stiffener types, one group of USPSW models and one group of moment resistance frame (MRF) models were established with various column flexural stiffnesses. The key characteristics of the monotonic and cyclic load-deformation responses of these models, including the initial stiffness, secant stiffness, yield strength, ultimate strength, and energy dissipation, were examined and compared. Finally, some conclusions with certain reference significance for engineering design were obtained. Figure 2 shows the flow chart of the argument logic of this article.
2. Preparation before Analysis
2.1. Design of the SPSW Models
In this study, one-story one-bay SPSW models were used to perform analyses. The infill plate and beams were the same for all models. The column flexural stiffness, stiffener arrangement, and stiffness ratio of the stiffeners of the models varied considerably.
Models with four columns, which varied primarily in their flexural stiffness, were investigated. Variations in flexural stiffness were achieved by varying the width of the flange, bf, and the thickness, tf, of the flange. The overall depth, d, and thickness of the web, tweb, were kept constant so that the geometry of the frame and shear stiffness of the columns remained consistent for all cases. The infill plate of each model was placed in the corner of the frame space, and the four sides of the infill plate were fixed with frame members. The dimensions of the plate, columns, and beams of each of the models, named SPSW1 through SPSW4, are listed in Table 1.
Each of the four models satisfies the capacity design requirements in which the yielding of the material is expected to occur within the infill plate, whereas VBEs and HBEs remain elastic.
The columns of SPSW1 were selected such that their moment of inertia was equal to the required minimum given by Equation (2). The columns of models SPSW2, SPSW3, and SPSW4 were selected such that their moments of inertia were 81%, 64%, and 49% of the required minimum, respectively (Table 1).
Four stiffener arrangements were investigated, as displayed in Figure 1. These include (a) unstiffened, (b) cross-stiffened with one vertical and one horizontal stiffener (1VHS), (c) multi-rib stiffened with three vertical and three horizontal stiffeners (3VHS), and (d) diagonally stiffened (DS) cases.
The constitutive behavior of the steel used in the SPSW model is displayed in Figure 3 [23]. Steel with a yield stress of 345 MPa was selected as the boundary element, and steel with a yield stress of 250 MPa was selected as the infill plate and stiffeners. The infill plate was connected to the boundary frame members, and stiffeners were welded to the infill plate. The bottom of each column was fixed and the out-of-plane deformation of the flanges of all the beam-column joints were restrained (Figure 4).
The stiffness ratio of the stiffener to the panel (η) was used to measure the stiffness of the stiffeners in JGJ/T 380-2015 [24] and can be calculated using Equations (3) and (4).
where E is the modulus of elasticity of steel, Is is the moment of inertia of the stiffeners, D is the bending stiffness of the infill plate per unit width, l is the spacing between stiffeners, and υ is the Poisson’s ratio for steel.
To investigate the behavior of the various types of SSPSWs with different η, five η values (10, 30, 60, 90, and 120) were adopted for the SSPSW models. The resulting stiffener dimensions are listed in Table 2.
2.2. Finite Element Modeling of the SPSW Models
Finite element analysis software ABAQUS [25] was used to analyze the SPSW models under cyclic and monotonic loads. Shell elements (S4R) were used as the boundary frame members, infill plates, and stiffeners. The constitutive behavior of the steel used in finite element models is displayed in Figure 3 [23]. The von Mises criterion was used as the material yield criterion, the isotropic hardening rule was used in the nonlinear pushover analysis and the kinematic hardening rule was used in the cyclic analysis. The nodes in the beam-to-column connection regions were restrained to prevent out-of-plane displacement. To consider the initial imperfections, the first eigenmode shape of elastic buckling with an amplitude of 1/1000 of the height of the infill plate under a lateral load was assigned to the infill plate prior to the analysis of each SPSW model.
In each analysis, axial compression loads were applied first and then held constant, whereas displacement-controlled lateral loading was applied. Axial compression loads were applied to each column, as displayed in Figure 1 and Figure 5. The magnitude of each load was equal to 0.2Afy, where A is the cross-sectional area of the column, and fy is the yield stress of the column.
Both monotonic and cyclic lateral loading patterns were analyzed. The cyclic loading pattern is illustrated in Figure 5. The drift ratio was set as θ = Δ/H, where Δ is the imposed displacement. The maximum drift ratio of 0.025 rad is greater than the collapse limit (0.02 rad) of the code for the seismic design of buildings in China [26]. The lateral displacement was applied to the top region of the outside flange of a column, as displayed in Figure 1 and Figure 5.
In the isotropic hardening criterion, the relationship between the force and displacement obtained in the forward pushover direction is the same as the relationship in the reverse pushover direction. Therefore, the reverse pushover curves of all models in this paper are symmetrical about the origin center through the forward pushover curve, which is convenient to compare the results of reverse cyclic curves.
2.3. Verification of Finite Element Modeling Methodology
To verify the accuracy of the finite element analyses, another batch of models was established and calculated to compare the modeling results with the published experimental results. Five specimens were compared, including specimens SPSW−HS2 and SPSW−HS tested by Li et al. [27,28], DS−PSW, DS−SPSW, and the frame specimen tested by Sabouri-Ghomi et al. [9]. The finite element mesh for each specimen is displayed in Figure 6, along with the key dimensions of each component.
The constitutive behavior of the steel used in each verifying model and the cyclic loading protocol of each verifying model were detailed in [9,27,28]. In addition, the maximum displacement of the monotonic pushover loading was the maximum displacement of cyclic loading in [9,27,28]. Other settings for verifying models were described in the first and the fourth paragraphs of Section 2.2.
A comparison between the numerical and experimental results is displayed in Figure 7. The agreement between the numerical and experimental results was deemed satisfactory for this study. Due to the development of tears in the infill plate in specimen DS−SPSW, the carrying capacity of DS−SPSW in the experiment decreased. However, the tears could not be effectively simulated in the finite element model, and the comparison between the numerical and experimental results of DS−SPSW only consider loading displacement to 40 mm (4.17% drift).
3. Effect of the Stiffener Stiffness Ratio (η)
The effect of the stiffness ratio of the stiffener and stiffness of the panel (η, Equation (3)) was investigated to select an appropriate value for subsequent analyses detailing the effect of the column flexural stiffness. Only one model, SPSW1, was used for these analyses, because the stiffener requirements are primarily related to the dimensions of the plate, not the columns. Five values of η (10, 30, 60, 90, and 120) were used for each of the three stiffener arrangements (1VHS, 3VHS, and DS) for 15 SSPSW cases. The USPSW case was also analyzed. The load-deformation results from the monotonic and cyclic analyses for each case are displayed in Figure 8, Figure 9 and Figure 10. A comparison of the envelope curves constructed from the cyclic responses is detailed in Figure 11.
Figure 8, Figure 9 and Figure 10 reveal that the hysteresis curves for the SSPSWs become less pinched and fuller when η increases. However, computing metrics from the load-deformation response allow a quantitative comparison. The metrics of interest in this study are yield strength, ultimate strength, ultimate displacement, initial stiffness, and secant stiffness.
To determine the yield point, an idealized elastoplastic envelope curve was defined, as displayed in Figure 12 [14,29].
The definitions of the idealized elastoplastic envelope curve and energy-dissipation coefficients are displayed in Figure 12 and Figure 13. The yield point (δy, Vy) was defined based on the equal plastic energy; therefore, the area enclosed by the idealized elastoplastic envelope curve was equal to that of the actual envelope curve [14,29,30]. The first inelastic behavior point (δyi, Vyi) was defined as the point at which permanent residual deformation developed because of cyclic loading for the first time. Furthermore, the maximum displacement (δmax) was defined in two methods. If the envelope curve appeared to exhibit softening behavior, δmax was equal to the value corresponding to 0.8 times the ultimate strength during the softening force-displacement stage. However, when the envelope curve did not exhibit softening, δmax was defined as the maximum displacement of the envelope curve.
The energy dissipation capacity of SPSWs can be evaluated using the energy dissipation coefficient, which was calculated using [30]:
where S(ABC+CDA) is the area of the hysteresis curve and S(OBE+ODF) represents the corresponding triangular areas.
The deformation and load at the yield point, peak point, and ultimate point are presented in Table 3. As expected, the SSPSW model exhibited greater strength than the USPSW model. The increase in strength ranged from 3% to 12% for the 1VHS stiffener arrangement, 4% to 21% for the 3VHS stiffener arrangement, and 8% to 22% for the DS stiffener arrangement. Greater increases from the unstiffened model were observed for higher values of η. However, for the 1VHS and 3VHS arrangements, a slight increase in strength was observed with the increase in the stiffness ratio when η ≥ 60. This result indicates that for these greater values of stiffness ratio, the stiffeners achieved full bracing and essentially divided the infill plate into cells.
This observed value is consistent with the Chinese standard [24], which identifies η ≥ 50 as the limit for full bracing. Other scholars, such as Guo et al. [31] (η ≥ 40), have determined similar limits. For the DS arrangement, strength increases of approximately the same magnitude were observed over the entire range of stiffness ratios investigated because diagonal stiffeners directly contribute to lateral resistance in addition to bracing the plate.
The initial stiffness and secant stiffness at drift ratios of 0.4% (elastic state) and 2% (elastoplastic state) are presented in Table 4. Figure 14 displays a comparison of the secant stiffness as a function of the drift ratio for various values of η. The SSPSW models exhibited greater initial and secant stiffnesses than the USPSW model did. The increase in the initial stiffness ranged from 17% to 26% for the 1VHS stiffener arrangement, 29% to 34% for the 3VHS stiffener arrangement, and 32% to 45% for the DS stiffener arrangement. Further increases from the unstiffened model were observed for higher values of η. However, for the 1VHS and 3VHS arrangements, a slight increase in the initial stiffness was observed with an increasing stiffness ratio when η ≥ 60. For the DS arrangement, stiffness increases of approximately the same magnitude were observed over the entire range of stiffness ratios investigated because diagonal stiffeners directly contribute to lateral resistance in addition to bracing the plate.
The secant stiffnesses at 0.4% drift with various η decreased to 0.64–0.66, 0.61–0.67, and 0.57–0.67 of the initial stiffnesses of SPSW1−1VHS, SPSW1−3VHS, and SPSW1−DS, respectively.
However, when the drift ratio was 2%, the secant stiffnesses with various η decreased to approximately 0.15–0.17 of the initial stiffnesses of the three types of SSPSWs. These results revealed that the secant stiffness reduction of the SSPSWs was affected by η in the elastic state, whereas it was negligibly influenced by η in the elastoplastic state.
The cumulative energy dissipation and energy dissipation coefficients are displayed in Figure 15 and Figure 16. As displayed in Figure 15 and Figure 16, the cumulative energy dissipations and energy dissipation coefficients of SPSW1−1VHS and SPSW1−3VHS were insignificantly affected by η when η ≥ 60, whereas those of SPSW1−DS were continually affected by η. The change in η had an insignificant effect on the energy-dissipation capacity of the SSPSWs with horizontal and vertical stiffeners when the stiffeners were sufficient to separate the infill plate into cells. However, the energy-dissipation capacity of the SSPSWs with diagonal stiffeners continuously improved when η increased.
As mentioned previously, these analysis results indicated that improving the stiffness of the stiffeners further when η ≥ 60 is useless when upgrading most mechanical performance indicators of the SPSWs with horizontal and vertical stiffeners, but useful for those of the SPSWs with diagonal stiffeners.
4. Effect of Column Flexural Stiffnesses
To investigate the effect of column flexural stiffness on the seismic performance of stiffened SPSWs, the hysteretic performance, secant stiffness reduction and energy dissipation of three types of SSPSWs with four column flexural stiffnesses were evaluated. In addition, four USPSW models with various column flexural stiffnesses were analyzed to compare their seismic behavior with that of the SSPSW models. Four MRF models with variable column flexural stiffnesses were used to determine the contribution of the boundary frame to the bearing capacity and stiffness of the SSPSW and USPSW models.
4.1. Performance of the SPSW Models without Infill Plate
To investigate the effect of column flexural stiffness on the seismic performance of the MRFs, MRF models with variable column flexural stiffnesses were analyzed. The hysteretic curves, envelope curves, and secant stiffness reductions of the MRFs with various column flexural stiffnesses are displayed in Figure 17, which revealed that the reduction in column flexural stiffness resulted in a decrease in the bearing capacity of the MRF. The analysis results of the MRF with respect to the yield strength, ultimate strength, and corresponding displacement as well as the maximum displacement and corresponding strength are presented in Table 5. As presented in Table 5, for all the MRF models, yielding occurred at a drift ratio of approximately 1%. The ultimate strengths of MRF2, MRF3, and MRF4 were 0.90, 0.82, and 0.72 of the ultimate strength of MRF1, respectively, whereas the plastic section module ratios of MRF2, MRF3, and MRF4 were 0.81, 0.64, and 0.50 of the ratio of MRF1, respectively. Furthermore, the reductions in the ultimate strengths of the MRFs were considerably lower than those in the column flexural stiffness.
The initial stiffness and secant stiffness with drift ratios of 0.4% and 2% for MRFs with variable flexural stiffnesses are listed in Table 6. As presented in Table 6, the initial stiffness values of MRF2, MRF3, and MRF4 are 11%, 19%, and 29% lower than that of MRF1, respectively. The reduction in the initial stiffness of the MRFs was similar to that in the ultimate strength of the MRFs. Furthermore, in all the MRFs, the secant stiffness (drift ratio = 0.4%) was almost equal to the initial stiffness, whereas the secant stiffness (drift ratio = 2%) was approximately 56% of the initial stiffness. These results indicate that the reduction in column flexural stiffness did not negatively influence the overall behavior of the MRFs (Figure 17f).
4.2. Performance of the Unstiffened SPSW Models
The hysteretic curves, envelope curves, and secant stiffness reduction curves for USPSWs with variable column flexural stiffnesses are displayed in Figure 18 and Figure 19 (the hysteretic curve of USPSW1 is displayed in Figure 8a). The hysteretic curves of the USPSWs are pinched in the middle. The results for the USPSWs with respect to the yield strength, ultimate strength, and corresponding displacement as well as the maximum displacement and corresponding strength are listed in Table 5. All the yielding for the USPSWs models occurred at a drift ratio of approximately 0.35%, which was earlier than the MRFs. The reductions in the ultimate strengths of USPSW2, USPSW3, and USPSW4 were 3%, 8%, and 14%, respectively, which were lower than that of USPSW1. As the strengths and initial stiffnesses of the USPSWs were considerably improved by the infill plate, the reductions in the ultimate strengths of the USPSWs were less than those of the MRFs when the column flexural stiffness decreased.
The initial stiffness and secant stiffness with drift ratios of 0.4% and 2% for USPSWs with variable flexural stiffnesses are listed in Table 6. The initial stiffness values of USPSW2, USPSW3, and USPSW4 are 0.96, 0.94, and 0.87, respectively, of the initial stiffness of USPSW1. As the column flexural stiffness decreased, the reductions in the initial stiffnesses of the USPSWs were smaller than those of the MRFs. Furthermore, in all USPSWs, the secant stiffnesses (drift ratio = 0.4% and 2%) were approximately 71% and 18% of the initial stiffnesses, respectively. This result revealed that, compared with the MRFs, although the infill plate could improve the initial stiffness of the USPSWs, the secant stiffnesses of the USPSWs reduced considerably more than those of the MRFs when buckling occurred in the infill plate. Furthermore, the USPSWs exhibited stable stiffness degradation even if the column did not satisfy the minimal flexural stiffness requirement in the specification (Figure 19b).
4.3. Performance of the Stiffened SPSW Models
To investigate the effect of column flexural stiffness on the performance of the SSPSWs, the SPSW−1VHS, SPSW−3VHS, and SPSW−DS models (η = 90) with variable column flexural stiffnesses were analyzed. The hysteretic, envelope, and secant stiffness reduction curves for SPSW−1VHS, SPSW−3VHS, and SPSW−DS with variable column flexural stiffnesses are displayed in Figure 20, Figure 21 and Figure 22 (the hysteretic curves for SPSW1−1VHS, SPSW1−3VHS, and SPSW1−DS are illustrated in Figure 8e, Figure 9d and Figure 10d, respectively). As displayed in Figure 20 and Figure 21, the three types of SSPSWs could effectively alleviate the pinching phenomenon of USPSWs through appropriate arrangement of stiffeners. As the stiffeners of the SPSW−3VHS could prevent shear buckling before shear yielding, the hysteresis curves for the SPSW−3VHS were greater than those of the SPSW−1VHS for each column flexural stiffness. Furthermore, in contrast to the horizontal and vertical stiffeners, the diagonal stiffeners could increase the tension field of the infill plate and improve the SPSW strength. Therefore, the diagonal stiffeners increased the additional bending moment on the frame columns and reduced the bearing capacity of the SPSWs at a later stage of loading.
The strength and stiffness results for SPSW−1VHS, SPSW−3VHS, and SPSW−DS with variable column flexural stiffnesses are presented in Table 5 and Table 6. As displayed in Table 5 and Table 6, all the yielding for the SSPSW models occurred at a drift ratio of approximately 0.32%, which was almost the same timing as the USPSWs and earlier than the MRFs. As the column flexural stiffness decreased, the reductions in the initial stiffness and ultimate strength of the SPSW−1VHS, SPSW−3VHS, and SPSW−DS models were similar to those of the USPSW model. For SPSW−1VHS, SPSW−3VHS, and SPSW−DS, the mean values of the secant stiffness of the 0.4% drift ratio with variable column flexural stiffnesses were reduced to approximately 0.67, 0.74, and 0.69 of the initial stiffness. Furthermore, the mean values of the secant stiffnesses (drift ratio = 2%) of SPSW−1VHS, SPSW−3VHS, and SPSW−DS with variable column stiffnesses were reduced to 0.17, 0.17, and 0.16, respectively, of their initial stiffness values. These results revealed that all three types of SSPSW models had stable secant stiffness reduction, despite the column not satisfying the minimal flexural stiffness requirement (Figure 22).
4.4. Comparison between Unstiffened and Stiffened SPSW Models
The cumulative energy dissipations, energy dissipation coefficients, and final energy dissipation results of MRF, USPSW, SPSW−1VHS, SPSW−3VHS, and SPSW−DS with variable column flexural stiffnesses are displayed in Figure 23 and Figure 24 and Table 7, respectively. As illustrated in Figure 23 and Table 7, with a decrease in the column flexural stiffness, the cumulative energy dissipations of the MRFs, USPSWs, and SSPSWs decreased. Furthermore, the reduction in the cumulative energy dissipation of the SSPSWs was less than and similar to those of the MRFs and USPSWs, respectively, when the column flexural stiffness decreased. The final energy dissipations of the SPSW−1VHS, SPSW−3VHS, and SPSW−DS models increased by an average of 33% (255.6/192.4 kN·m), 75% (337.6/192.4 kN·m), and 37% (263.6/192.4 kN·m), respectively, compared with those of the USPSW models.
As displayed in Figure 24, in all the MRFs, the energy dissipation coefficients of the “stronger” MRFs were slightly higher than those of the “weaker” MRFs within a drift ratio of 1.5%. However, the “weaker” MRFs exhibited higher energy dissipation coefficients after a 1.5% drift ratio. Furthermore, in all the USPSW and SSPSW models, “stronger” models revealed higher energy dissipation coefficients with a 0.5% drift ratio, whereas after the 0.5% drift ratio, the “weaker” models exhibited slightly higher energy dissipation coefficients. The energy dissipation coefficients of the MRFs, USPSWs, and SSPSWs increased with the drift ratio. When the drift ratios were in the range of 0.5−2.5%, the energy dissipation coefficients of the MRFs increased almost linearly, whereas those of the USPSWs and SSPSWs gradually decreased. The mean values of the final energy dissipation coefficients of the SPSW−1VHS, SPSW−3VHS, and SPSW−DS models were 1.14 times (2.03/1.77), 1.39 times (2.46/1.77), and 1.10 times (1.94/1.77) those of USPSW models, respectively. These results indicate that the energy dissipations of the SPSWs with horizontal and vertical stiffeners were greater than those of the SPSWs with diagonal stiffeners at the same η when the stiffeners could prevent infill plate buckling prior to shear yield.
As displayed in Table 5 and Table 6, because of the infill plate contribution to the strength and the initial stiffness of the USPSWs, the mean values of the ultimate strength and the initial stiffness of USPSWs improved considerably by approximately 2.74 times (975.6/356.4 kN) and 8.42 times (151.6/18.0 kN/mm) those of the MRFs, respectively. However, the increases in the ultimate strength and initial stiffness of the stiffeners for the USPSWs were smaller than those of the infill plate for the MRFs. The mean values of the ultimate strength increases of SPSW−1VHS, SPSW−3VHS, and SPSW−DS compared to USPSWs were approximately 12% (1090.9/975.5 kN), 20% (1171.7/975.5 kN), and 19% (1157.0/975.5 kN), respectively. Furthermore, the increases in the initial stiffnesses of SPSW−1VHS, SPSW−3VHS, and SPSW−DS were approximately 24% (188.3/151.6 kN/mm), 31% (197.9/151.6 kN/mm), and 39% (211.1/151.6 kN/mm) of those of USPSW, respectively.
The ultimate strength of the USPSW infill plate (Vp-USPSW) was calculated from AISC 341-2010 [13] using Equation (6). Stiffeners were used to preclude premature buckling of the infill plate. The limiting infill plate thickness (tlim), below which shear buckling occurs prior to shear yielding for plates stiffened by Timoshenko and Woinowsky-Krieger [32], was calculated using Equation (7). When the spacing of the stiffeners was equal in each direction, the limiting infill plate slenderness ratio below which shear buckling was precluded was calculated using Equation (8). The minimum required stiffnesses of the stiffeners can be calculated using Equation (9). Based on Equations (7)–(9) [1], the stiffeners of the SPSW−3VHS could prevent shear buckling before shear yielding, whereas the stiffeners of the SPSW−1VHS and SPSW−DS could not produce shear yielding prior to shear buckling. The diagonal stiffeners differed from the horizontal and vertical stiffeners, which could have increased the tension fields of the infill plate. Therefore, the ultimate strengths of the infill plates of SPSW−1VHS, SPSW−3VHS, and SPSW−DS can be calculated using Equations (10)–(12) [9,33].
In the aforementioned equations, σy is the yield stress of the infill plate, α is the inclination of the infill plate tension field diagonals with respect to the column axis, and s1 and s2 are the smaller and larger spacings between stiffeners, respectively. Here, j = 2.5(h/a)2 − 2 ≥ 0.5, and h and a are the maximum horizontal and vertical spacings between stiffeners, respectively. Furthermore, As is the cross-sectional area of the tensile or compressive diagonal stiffeners, σst and σsc are the tensile and compressive axial stresses in the diagonal stiffeners, respectively, and θs is the angle between the diagonal stiffeners and horizontal axis.
The mean values of the ultimate strength of the infill plate for the USPSW, SPSW−1VHS, SPSW−3VHS, and SPSW−DS with variable column flexural stiffness values are presented in Table 8. As listed in Table 8, the stiffeners improved the ultimate strength of the infill plate. The ultimate strengths of the infill plates of the SPSW−1VHS, SPSW−3VHS, and SPSW−DS were 19%, 32%, and 29% higher than those of the infill plate of the USPSW, respectively. With the exception of SPSW−DS, the finite element values of the infill plates of the USPSW, SPSW−1VHS, and SPSW−3VHS all reached the theoretical values. However, the finite element value of the infill plate of the SPSW−DS was slightly lower than the theoretical value because a sufficient tension field did not occur in the infill plate.
The von Mises stress contour plots and maximum stress locations for USPSW4, SPSW4−1VHS, SPSW4−3VHS, and SPSW4−DS at a drift ratio of 2.5% are displayed in Figure 25. As detailed in Figure 25, USPSW4, SPSW4−1VHS, and SPSW4−DS exhibited considerable “pull-in” behavior for their columns because of the transverse loads caused by the tension field action within the infill plate. However, SPSW4−3VHS revealed slight column “pull-in” deformation despite the column flexural stiffness being reduced to 0.49 of the minimum stiffness requirements in the design code. However, all USPSW and SSPSW models revealed stable secant stiffness reduction, energy dissipation, and bearing capacity based on the aforementioned analysis. Therefore, the column “pull-in” behavior had no negative influence on the overall performance of the USPSWs and the SSPSWs.
5. Conclusions
To investigate the effect of the column flexural stiffness on the seismic performance of stiffened steel plate shear walls, by using a numerical simulation analysis method based on finite element analysis software, five groups of MRF, USPSW, SPSW−1VHS, SPSW−3VHS, and SPSW−DS models were examined based on the capacity design approach. First, five stiffness ratios of the stiffeners to the panel (η = 10, 30, 60, 90, and 120) were adopted to design the stiffeners of SPSW−1VHS, SPSW−3VHS, and SPSW−DS, and the performances of the SSPSWs with variable η were investigated. Subsequently, a suitable η (90) was used to design the stiffeners of the SSPSWs by comparing the performances of the SSPSWs with variable η. Finally, 20 one-story one-bay MRF, USPSW, SPSW−1DS, SPSW−3VHS, and SPSW−DS models with variable column flexural stiffness values were analyzed. The results revealed the following:
The change in η had an almost insignificant influence on the ultimate strength, initial stiffness, and energy dissipation of the SPSWs with horizontal and vertical stiffeners when η ≥ 60. However, the change in η had a distinct effect on the ultimate strength, initial stiffness, and energy dissipation of the SPSWs with diagonal stiffeners when η = 10–120.
For the models investigated, stiffening the plate resulted in a marginal increase in the strength, initial stiffness, and energy dissipation when compared with the addition of the plate. Although the strength of the unstiffened SPSWs was approximately twice that of the MRFs, the strength of the stiffened SPSWs was only 10–20% greater than that of the unstiffened SPSWs. Similarly, the initial stiffness of the unstiffened SPSWs was approximately eight times that of the MRFs, whereas the initial stiffness of the stiffened SPSWs was only 30–40% greater than that of the unstiffened SPSWs. Furthermore, the energy dissipation of the unstiffened SPSWs was approximately three times that of the MRFs, whereas the energy dissipation of the stiffened SPSWs was only 30–80% greater than that of the unstiffened SPSWs.
As the column flexural stiffness decreased, the reductions in the initial stiffness, ultimate strength, and energy dissipation of the SSPSW models were approximately 4–15%, 4–12%, and 2–10%, respectively, which were similar to and less than those of the USPSW models (4–13%, 4–14%, and 4–10%, respectively) and MRF models (11–29%, 10–28%, and 10–25%, respectively).
The column flexural stiffness was reduced to 51% of the minimum stiffness requirements. All the USPSW and SSPSW models exhibited stable secant stiffness reduction until the 2.5% drift ratio, despite the minimum flexural stiffness requirements of the frame columns not being satisfied.
The ultimate strengths of the infill plates of the USPSWs and SSPSWs could reach the theoretical values despite the minimum flexural stiffness requirements of the frame columns not being satisfied. The column “pull-in” behavior had no negative influence on the overall performance of USPSWs and SSPSWs. The minimal column flexural stiffness requirement values for USPSWs and SSPSWs may be overly conservative.
In summary, these conclusions have reference significance for engineers and scholars. The appropriate limit range of the column stiffness in SSPSWs and the optimization of frame column section in SSPSWs could be studied in future research.
Author Contributions
Conceptualization, J.H. and S.L.; methodology, Y.L. and S.L.; formal analysis, S.L. and Y.L.; data curation, Y.L. and S.L.; writing—original draft preparation, S.L.; writing—review and editing, Y.L. and S.C.; visualization, X.D. and S.C.; supervision, J.H.; project administration, J.H. and S.C.; funding acquisition, J.H. All authors have read and agreed to the published version of the manuscript.
Funding
This study was supported by National Natural Science Foundation of China (Grant No. 51708226, 51638009, 51808357).
Institutional Review Board Statement
Not applicable.
Informed Consent Statement
Not applicable.
Data Availability Statement
Not applicable.
Conflicts of Interest
The authors declare no conflict of interest.
References
- Sabelli, R.; Bruneau, M. Design Guide 20: Steel Plate Shear Walls; American Institute of Steel Construction: Chicago, IL, USA, 2007. [Google Scholar]
- Lubell, A.S.; Prion, H.G.L.; Ventura, C.E.; Rezai, M. Unstiffened Steel Plate Shear Wall Performance under Cyclic Loading. J. Struct. Eng. 2001, 127, 973–975. [Google Scholar] [CrossRef]
- Alinia, M.M.; Sarraf Shirazi, R. On the Design of Stiffeners in Steel Plate Shear Walls. J. Constr. Steel Res. 2009, 65, 2069–2077. [Google Scholar] [CrossRef]
- He, J.; Lin, S.; Li, Y.; Dong, X.; Chen, S. Genetic Algorithm for Optimal Placement of Steel Plate Shear Walls for Steel Frames. Buildings 2022, 12, 835. [Google Scholar] [CrossRef]
- Du, Y.; Shao, Y.; Zhong, L. Repairing Damaged Steel Plate Shear Wall with Additional Ribs. Structures 2022, 41, 222–234. [Google Scholar] [CrossRef]
- Hajimirsadeghi, M.R.; Fanaie, N. Steel Plate Shear Walls with Large Disconnected Lengths of Web Plate to Vertical Boundary Element. Structures 2021, 34, 4596–4615. [Google Scholar] [CrossRef]
- Khaloo, A.; Ghamari, A.; Foroutani, M. On the Design of Stiffened Steel Plate Shear Wall with Diagonal Stiffeners Considering the Crack Effect. Structures 2021, 31, 828–841. [Google Scholar] [CrossRef]
- Xu, Z.; Tong, G.; Zhang, L. Design of Vertically Stiffened Steel Plate Walls under Combined Uniaxial Compression and Shear Loads. Structures 2020, 26, 348–361. [Google Scholar] [CrossRef]
- Sabouri-Ghomi, S.; Sajjadi, S.R.A. Experimental and Theoretical Studies of Steel Shear Walls with and without Stiffeners. J. Constr. Steel Res. 2012, 75, 152–159. [Google Scholar] [CrossRef]
- Rahmzadeh, A.; Ghassemieh, M.; Park, Y.; Abolmaali, A. Effect of Stiffeners on Steel Plate Shear Wall Systems. Steel Compos. Struct. 2016, 20, 545–569. [Google Scholar] [CrossRef]
- Tong, J.-Z.; Guo, Y.-L. Shear Resistance of Stiffened Steel Corrugated Shear Walls. Thin-Walled Struct. 2018, 127, 76–89. [Google Scholar] [CrossRef]
- Machaly, E.B.; Safar, S.S.; Amer, M.A. Numerical Investigation on Ultimate Shear Strength of Steel Plate Shear Walls. Thin-Walled Struct. 2014, 84, 78–90. [Google Scholar] [CrossRef]
- ATC. Modelling and Acceptance Criteria for Seismic Design and Analysis of Tall Buildings; PEER/ATC-72-1; Applied Technology Council: Redwood City, CA, USA, 2010. [Google Scholar]
- Curkovic, I.; Skejic, D.; Dzeba, I. Seismic Performance of Steel Plate Shear Walls with Variable Column Flexural Stiffness. Steel Compos. Struct. 2019, 33, 1–18. [Google Scholar] [CrossRef]
- Curkovic, I.; Skejic, D.; Dzeba, I.; Matteis, G.D. Seismic Performance of Composite Plate Shear Walls with Variable Column Flexural Stiffness. Steel Compos. Struct. 2019, 33, 19–36. [Google Scholar]
- Wagner, H. Flat Sheet Metal Girders With Very Thin Metal Web. Part 3: Sheet Metal Girders With Spars Resistant to Bending—The Stress in Uprights—Diagonal Tension Fields; NACA: Washington, DC, USA, 1931.
- Kuhn, P.; Peterson, J.P.; Levin, L.R. A Summary of Diagonal Tension Part I: Methods of Analysis; NACA-TN-2661; NACA: Washington, DC, USA, 1952.
- Qu, B.; Bruneau, M. Behavior of Vertical Boundary Elements in Steel Plate Shear Walls. Eng. J. 2010, 47, 109–122. [Google Scholar]
- CSA S16-09; Design of Steel Structures. Canadian Standards Association: Toronto, ON, Canada, 2009.
- Hozjan, T.; Turk, G.; Srpčič, S. Fire Analysis of Steel Frames with the Use of Artificial Neural Networks. J. Constr. Steel Res. 2007, 63, 1396–1403. [Google Scholar] [CrossRef]
- Zarringol, M.; Thai, H.-T.; Naser, M.Z. Application of Machine Learning Models for Designing CFCFST Columns. J. Constr. Steel Res. 2021, 185, 106856. [Google Scholar] [CrossRef]
- Almasabha, G.; Alshboul, O.; Shehadeh, A.; Almuflih, A.S. Machine Learning Algorithm for Shear Strength Prediction of Short Links for Steel Buildings. Buildings 2022, 12, 775. [Google Scholar] [CrossRef]
- Zirakian, T.; Zhang, J. Structural Performance of Unstiffened Low Yield Point Steel Plate Shear Walls. J. Constr. Steel Res. 2015, 112, 40–53. [Google Scholar] [CrossRef]
- JGJ/T 380-2015; Technical Specification for Steel Plate Shear Walls. China Architecture and Building Press: Beijing, China, 2015.
- Abaqus 2020; Dassault Systèmes Simulia Corp.: Providence, RI, USA, 2020.
- GB 50011-2010; Code for Seismic Design of Buildings. China Architecture and Building Press: Beijing, China, 2010.
- Li, F.; Li, H.; Li, Z.; Li, Z.; Chen, X.; Ding, L. Cyclic Test of Diagonally Stiffened Steel Plate Shear Wall. J. Xian Univ. Archit. Technol. Sci. Ed. 2009, 41, 57–62. [Google Scholar]
- Li, F.; Li, S.; Guo, H.; Wang, D.; Liu, J. Experimental Investigation of Seismic Performance of Steel Plate Shear Walls. J. Xian Univ. Archit. Technol. Sci. Ed. 2011, 166–169, 657–663. [Google Scholar] [CrossRef]
- Park, H.-G.; Kwack., J.-H.; Jeon, S.-W.; Kim, W.-K.; Choi, I.-R. Framed Steel Plate Wall Behavior under Cyclic Lateral Loading. J. Struct. Eng. 2007, 133, 378–388. [Google Scholar] [CrossRef]
- Jacobsen, L.S. Steady Forced Vibration as Influenced by Damping: An Approximate Solution of the Steady Forced Vibration of a System of One Degree of Freedom under the Influence of Various Types of Damping. Bull. Seismol. Soc. Am. 1930, 20, 196–223. [Google Scholar] [CrossRef]
- Guo, Y.L.; Chen, G.D.; Miao, Y.W. Elastic Buckling Behavior of Steel Plate Shear Wall with Cross or Diagonal Stiffeners. Eng. Mech. 2006, 23, 84–91. [Google Scholar] [CrossRef]
- Timoshenko, S.P.; Woinowsky-Krieger, S. Theory of Plates and Shells, 2nd ed.; McGraw-Hill: New York, NY, USA, 1959. [Google Scholar]
- Alavi, E.; Nateghi, F. Experimental Study of Diagonally Stiffened Steel Plate Shear Walls. J. Struct. Eng. 2013, 139, 1795–1811. [Google Scholar] [CrossRef]
Figure 1.
SPSW models with different stiffener arrangements: (a) unstiffened; (b) 1VHS; (c) 3VHS; (d) DS.
Figure 1.
SPSW models with different stiffener arrangements: (a) unstiffened; (b) 1VHS; (c) 3VHS; (d) DS.

Figure 2.
Flow chart of the argument logic of this article.

Figure 3.
Constitutive behavior of steel.

Figure 4.
Boundary conditions and loading location.

Figure 5.
Loading patterns.

Figure 6.
Specimen finite element model: (a) SPSW−HS2; (b) SPSW−HS; (c) DS−PSW; (d) DS−SPSW; (e) Frame.
Figure 6.
Specimen finite element model: (a) SPSW−HS2; (b) SPSW−HS; (c) DS−PSW; (d) DS−SPSW; (e) Frame.

Figure 7.
Comparison between numerical and experimental results: (a) SPSW−HS2; (b) SPSW−HS; (c) DS−PSW; (d) DS−SPSW; (e) frame.
Figure 7.
Comparison between numerical and experimental results: (a) SPSW−HS2; (b) SPSW−HS; (c) DS−PSW; (d) DS−SPSW; (e) frame.

Figure 8.
Hysteretic curves for SPSW1−1VHS with different η: (a) η = 0 (USPSW1); (b) η = 10; (c) η = 30; (d) η = 60; (e) η =90; (f) η = 120.
Figure 8.
Hysteretic curves for SPSW1−1VHS with different η: (a) η = 0 (USPSW1); (b) η = 10; (c) η = 30; (d) η = 60; (e) η =90; (f) η = 120.

Figure 9.
Hysteretic curves for SPSW1−3VHS with different η: (a) η = 10; (b) η = 30; (c) η = 60; (d) η =90; (e) η = 120.
Figure 9.
Hysteretic curves for SPSW1−3VHS with different η: (a) η = 10; (b) η = 30; (c) η = 60; (d) η =90; (e) η = 120.

Figure 10.
Hysteretic curves for SPSW1−DS with variable η: (a) η = 10; (b) η = 30; (c) η = 60; (d) η =90; (e) η = 120.
Figure 10.
Hysteretic curves for SPSW1−DS with variable η: (a) η = 10; (b) η = 30; (c) η = 60; (d) η =90; (e) η = 120.

Figure 11.
Envelope curves for: (a) SPSW1−1VHS, (b) SPSW1−3VHS, and (c) SPSW1−DS with variable η.

Figure 12.
Definition of the idealized elastoplastic envelope curve.

Figure 13.
Definition of the energy dissipation coefficients.

Figure 14.
Secant stiffness reductions of: (a) SPSW1−1VHS, (b) SPSW1−3VHS, and (c) SPSW1−DS with different η.
Figure 14.
Secant stiffness reductions of: (a) SPSW1−1VHS, (b) SPSW1−3VHS, and (c) SPSW1−DS with different η.

Figure 15.
Cumulative energy dissipations of: (a) SPSW1−1VHS, (b) SPSW1−3VHS, and (c) SPSW1−DS with different η.
Figure 15.
Cumulative energy dissipations of: (a) SPSW1−1VHS, (b) SPSW1−3VHS, and (c) SPSW1−DS with different η.

Figure 16.
Energy dissipation coefficients of: (a) SPSW1−1VHS, (b) SPSW1−3VHS, and (c) SPSW1−DS with different η.
Figure 16.
Energy dissipation coefficients of: (a) SPSW1−1VHS, (b) SPSW1−3VHS, and (c) SPSW1−DS with different η.

Figure 17.
Hysteresis curves, envelope curves, and secant stiffness reduction curves for the MRFs with variable column flexural stiffnesses: (a) MRF1; (b) MRF2; (c) MRF3; (d) MRF4; (e) Envelope curves; (f) Secant stiffness reduction curves.
Figure 17.
Hysteresis curves, envelope curves, and secant stiffness reduction curves for the MRFs with variable column flexural stiffnesses: (a) MRF1; (b) MRF2; (c) MRF3; (d) MRF4; (e) Envelope curves; (f) Secant stiffness reduction curves.

Figure 18.
Hysteresis curves for the USPSWs with variable column flexural stiffnesses: (a) USPSW2; (b) USPSW3; (c) USPSW4.
Figure 18.
Hysteresis curves for the USPSWs with variable column flexural stiffnesses: (a) USPSW2; (b) USPSW3; (c) USPSW4.

Figure 19.
USPSW curves: (a) Envelope curves; (b) Secant stiffness reduction curves.

Figure 20.
Hysteresis curves for: (a) SPSW2−1VHS, (b) SPSW3−1VHS, (c) SPSW4−1VHS, (d) SPSW2−3VHS, (e) SPSW3−3VHS, (f) SPSW4−3VHS, (g) SPSW2−DS, (h) SPSW3−DS and (i) SPSW4−DS with variable column flexural stiffnesses.
Figure 20.
Hysteresis curves for: (a) SPSW2−1VHS, (b) SPSW3−1VHS, (c) SPSW4−1VHS, (d) SPSW2−3VHS, (e) SPSW3−3VHS, (f) SPSW4−3VHS, (g) SPSW2−DS, (h) SPSW3−DS and (i) SPSW4−DS with variable column flexural stiffnesses.

Figure 21.
Envelope curves for: (a) SPSW−1VHS, (b) SPSW−3VHS, and (c) SPSW−DS with variable column flexural stiffnesses.
Figure 21.
Envelope curves for: (a) SPSW−1VHS, (b) SPSW−3VHS, and (c) SPSW−DS with variable column flexural stiffnesses.

Figure 22.
Secant stiffness reduction curves for: (a) SPSW−1VHS, (b) SPSW−3VHS, and (c) SPSW−DS with variable column flexural stiffnesses.
Figure 22.
Secant stiffness reduction curves for: (a) SPSW−1VHS, (b) SPSW−3VHS, and (c) SPSW−DS with variable column flexural stiffnesses.

Figure 23.
Cumulative energy dissipations of: (a) MRF; (b) USPSW; (c) SPSW−1VHS; (d) SPSW−3VHS; (e) SPSW−DS with variable column flexural stiffnesses.
Figure 23.
Cumulative energy dissipations of: (a) MRF; (b) USPSW; (c) SPSW−1VHS; (d) SPSW−3VHS; (e) SPSW−DS with variable column flexural stiffnesses.

Figure 24.
Energy dissipation coefficients of the (a) MRF, (b) USPSW, (c) SPSW−1VHS, (d) SPSW−3VHS and (e) SSPSWs with variable column flexural stiffnesses.
Figure 24.
Energy dissipation coefficients of the (a) MRF, (b) USPSW, (c) SPSW−1VHS, (d) SPSW−3VHS and (e) SSPSWs with variable column flexural stiffnesses.

Figure 25.
Von Mises stress contour plots of (a) USPSW4, (b) SPSW4−1VHS, (c) SPSW4−3VHS and (d) SPSW4−DS at the drift ratio of 2.5% (unit: MPa).
Figure 25.
Von Mises stress contour plots of (a) USPSW4, (b) SPSW4−1VHS, (c) SPSW4−3VHS and (d) SPSW4−DS at the drift ratio of 2.5% (unit: MPa).


Table 1.
Specifications of the four SPSW models with different column flexural stiffnesses (mm).
| Model | Infill Plate (b × h × tw) | VBEs (Column) (d × bf × tweb × tf) | HBEs (Beam) (d × bf × tweb × tf) | Ic/Ic,min |
|---|---|---|---|---|
| SPSW1 | 1500 × 1500 × 3.75 | H215 × 210 × 8 × 14 | H250 × 125 × 10 × 14 | 1.00 |
| SPSW2 | H215 × 190 × 8 × 12 | 0.81 | ||
| SPSW3 | H215 × 170 × 8 × 10 | 0.64 | ||
| SPSW4 | H215 × 150 × 8 × 8 | 0.49 |
Table 2.
Dimensions of the stiffeners (mm).
| Stiffener Arrangement | η | ||||
|---|---|---|---|---|---|
| 10 | 30 | 60 | 90 | 120 | |
| 1VHS | −24 × 4 | −34.5 × 4 | −40 × 5 | −46 × 5 | −51 × 5 |
| 3VHS | −21 × 3 | −27.5 × 4 | −32 × 5 | −36.5 × 5 | −40.5 × 5 |
| DS | −31 × 4 | −40.5 × 5 | −50.5 × 5 | −58 × 5 | −60 × 6 |
Table 3.
Analysis results of SSPSWs with variable η.
| Model | η | Yield Point | Peak Point | Ultimate Point | ||||||
|---|---|---|---|---|---|---|---|---|---|---|
| Δyi | Pyi | Pyi/Py1 | Δui | Pui | Pui/Pu1 | Δmi | Pmi | Pmi/Pm1 | ||
| USPSW1 | 0 | 6.2 | 979.0 | 1.00 | 26.2 | 1041.1 | 1.00 | 42.8 | 1033.8 | 1.00 |
| SPSW1−1VHS | 10 | 5.4 | 1012.3 | 1.03 | 25.7 | 1075.1 | 1.03 | 43.7 | 1069.0 | 1.03 |
| 30 | 5.4 | 1047.1 | 1.07 | 30.4 | 1105.3 | 1.06 | 43.2 | 1089.7 | 1.05 | |
| 60 | 5.5 | 1076.3 | 1.10 | 34.8 | 1140.5 | 1.10 | 43.5 | 1133.3 | 1.10 | |
| 90 | 5.5 | 1088.2 | 1.11 | 34.7 | 1164.4 | 1.12 | 42.9 | 1154.8 | 1.12 | |
| 120 | 5.5 | 1089.8 | 1.11 | 34.9 | 1165.8 | 1.12 | 43.4 | 1155.0 | 1.12 | |
| SPSW1−3VHS | 10 | 5.1 | 1025.7 | 1.05 | 30.5 | 1087.2 | 1.04 | 43.3 | 1078.4 | 1.04 |
| 30 | 5.0 | 1090.9 | 1.11 | 30.2 | 1147.5 | 1.10 | 43.2 | 1135.5 | 1.10 | |
| 60 | 5.3 | 1155.2 | 1.18 | 39.2 | 1223.1 | 1.17 | 43.6 | 1221.6 | 1.18 | |
| 90 | 5.4 | 1164.9 | 1.19 | 43.3 | 1247.2 | 1.20 | 43.3 | 1247.2 | 1.21 | |
| 120 | 5.4 | 1168.1 | 1.19 | 43.5 | 1257.8 | 1.21 | 43.5 | 1257.8 | 1.22 | |
| SPSW1−DS | 10 | 5.0 | 1053.3 | 1.08 | 25.5 | 1120.3 | 1.08 | 43.5 | 1107.8 | 1.07 |
| 30 | 5.0 | 1095.4 | 1.12 | 25.4 | 1148.0 | 1.10 | 43.3 | 1133.7 | 1.10 | |
| 60 | 5.2 | 1139.7 | 1.16 | 25.2 | 1188.2 | 1.14 | 43.2 | 1171.6 | 1.13 | |
| 90 | 5.2 | 1165.2 | 1.19 | 25.8 | 1220.2 | 1.17 | 43.2 | 1187.8 | 1.15 | |
| 120 | 5.4 | 1213.8 | 1.24 | 25.6 | 1266.8 | 1.22 | 42.9 | 1229.5 | 1.19 | |
Note: Units of strength and displacement in the table are kN and mm, respectively.
Table 4.
Stiffness results of the SSPSWs with variable η.
| Stiffener Arrangement | η | Initial Stiffness, Ki [kN/mm] | Ki/K1 | Secant Stiffness at 0.4% Drift, Kei [kN/mm] | Kei/Ke1 | Kei/Ki | Secant Stiffness at 2% Drift, Kpi [kN/mm] | Kpi/Kp1 | Kpi/Ki |
|---|---|---|---|---|---|---|---|---|---|
| Unstiffened | 0 | 160.9 | 1.00 | 113.1 | 1.00 | 0.70 | 29.8 | 1.00 | 0.18 |
| 1VHS | 10 | 188.5 | 1.17 | 121.6 | 1.08 | 0.64 | 31.1 | 1.05 | 0.16 |
| 30 | 201.0 | 1.25 | 130.9 | 1.16 | 0.65 | 31.9 | 1.07 | 0.16 | |
| 60 | 201.0 | 1.25 | 133.4 | 1.18 | 0.66 | 32.9 | 1.11 | 0.16 | |
| 90 | 202.7 | 1.26 | 133.8 | 1.18 | 0.66 | 33.5 | 1.13 | 0.17 | |
| 120 | 203.3 | 1.26 | 133.7 | 1.18 | 0.66 | 33.4 | 1.12 | 0.16 | |
| 3VHS | 10 | 207.8 | 1.29 | 126.5 | 1.12 | 0.61 | 31.1 | 1.04 | 0.15 |
| 30 | 214.8 | 1.34 | 145.0 | 1.28 | 0.68 | 33.7 | 1.13 | 0.16 | |
| 60 | 214.9 | 1.34 | 153.0 | 1.35 | 0.71 | 35.0 | 1.18 | 0.16 | |
| 90 | 214.9 | 1.34 | 154.5 | 1.37 | 0.72 | 35.6 | 1.20 | 0.17 | |
| 120 | 214.9 | 1.34 | 154.7 | 1.37 | 0.72 | 35.7 | 1.20 | 0.17 | |
| DS | 10 | 212.2 | 1.32 | 129.3 | 1.14 | 0.61 | 32.1 | 1.08 | 0.15 |
| 30 | 224.8 | 1.40 | 140.2 | 1.24 | 0.62 | 33.0 | 1.11 | 0.15 | |
| 60 | 225.9 | 1.40 | 148.3 | 1.31 | 0.66 | 34.2 | 1.15 | 0.15 | |
| 90 | 228.8 | 1.42 | 152.3 | 1.35 | 0.67 | 35.4 | 1.19 | 0.15 | |
| 120 | 233.9 | 1.45 | 158.6 | 1.40 | 0.68 | 36.0 | 1.21 | 0.15 |
Table 5.
Analysis results for the MRFs, USPSWs, SPSW−1VHS, SPSW−3VHS, and SPSW−DS with various column flexural stiffnesses.
Table 5.
Analysis results for the MRFs, USPSWs, SPSW−1VHS, SPSW−3VHS, and SPSW−DS with various column flexural stiffnesses.
| Model | Yield Point | Peak Point | Ultimate Point | ||||||
|---|---|---|---|---|---|---|---|---|---|
| Δyi/mm | Pyi/kN | Pyi/Py1 | Δui/mm | Pui/kN | Pui/Pu1 | Δmi/mm | Pmi/kN | Pmi/Pm1 | |
| MRF1 | 17.7 | 372.7 | 1.00 | 42.2 | 414.9 | 1.00 | 42.2 | 414.9 | 1.00 |
| MRF2 | 17.8 | 334.5 | 0.90 | 42.2 | 372.0 | 0.90 | 42.2 | 372.0 | 0.90 |
| MRF3 | 18.2 | 308.4 | 0.83 | 42.5 | 339.3 | 0.82 | 42.5 | 339.3 | 0.82 |
| MRF4 | 18.6 | 278.1 | 0.75 | 42.5 | 299.5 | 0.72 | 42.5 | 299.5 | 0.72 |
| USPSW1 | 6.2 | 979.0 | 1.00 | 26.2 | 1041.1 | 1.00 | 42.8 | 1033.8 | 1.00 |
| USPSW2 | 6.2 | 945.5 | 0.97 | 34.8 | 1002.4 | 0.96 | 42.8 | 993.5 | 0.96 |
| USPSW3 | 6.3 | 907.6 | 0.93 | 25.9 | 959.4 | 0.92 | 43.5 | 942.8 | 0.91 |
| USPSW4 | 6.1 | 845.9 | 0.86 | 26.1 | 899.3 | 0.86 | 43.0 | 852.2 | 0.82 |
| SPSW1−1VHS | 5.5 | 1088.2 | 1.00 | 34.7 | 1164.4 | 1.00 | 42.9 | 1154.8 | 1.00 |
| SPSW2−1VHS | 5.5 | 1054.7 | 0.97 | 34.4 | 1123.0 | 0.96 | 43.5 | 1119.2 | 0.97 |
| SPSW3−1VHS | 5.7 | 1008.6 | 0.93 | 34.2 | 1069.0 | 0.92 | 43.1 | 1056.2 | 0.91 |
| SPSW4−1VHS | 5.7 | 952.2 | 0.87 | 29.8 | 1007.4 | 0.87 | 43.3 | 958.2 | 0.83 |
| SPSW1−3VHS | 5.4 | 1164.9 | 1.00 | 43.3 | 1247.2 | 1.00 | 43.3 | 1247.2 | 1.00 |
| SPSW2−3VHS | 5.5 | 1125.4 | 0.97 | 43.3 | 1196.6 | 0.96 | 43.3 | 1196.6 | 0.96 |
| SPSW3−3VHS | 5.6 | 1083.2 | 0.93 | 43.4 | 1150.0 | 0.92 | 43.4 | 1150.0 | 0.92 |
| SPSW4−3VHS | 5.7 | 1038.8 | 0.89 | 43.0 | 1093.2 | 0.88 | 43.0 | 1093.2 | 0.88 |
| SPSW1−DS | 5.2 | 1165.2 | 1.00 | 25.8 | 1220.2 | 1.00 | 43.2 | 1187.8 | 1.00 |
| SPSW2−DS | 5.3 | 1135.9 | 0.97 | 25.5 | 1189.0 | 0.97 | 43.2 | 1150.6 | 0.97 |
| SPSW3−DS | 5.5 | 1089.7 | 0.94 | 25.5 | 1143.3 | 0.94 | 42.9 | 1094.6 | 0.92 |
| SPSW4−DS | 5.5 | 1026.8 | 0.88 | 21.6 | 1075.6 | 0.88 | 43.0 | 1007.2 | 0.85 |
Note: Py1, Pu1, and Pm1 are the yield strength, ultimate strength, and strength corresponding to the maximum displacement for MRF1, USPSW1, SPSW1−1VHS, SPSW1−3VHS, and SPSW1−DS, respectively, in each type of model.
Table 6.
Stiffness results for MRF, USPSW, SPSW−1VHS, SPSW−3VHS, and SPSW−DS with variable column flexural stiffnesses.
Table 6.
Stiffness results for MRF, USPSW, SPSW−1VHS, SPSW−3VHS, and SPSW−DS with variable column flexural stiffnesses.
| Model | Initial Stiffness/Ki [kN/mm] | Ki/K1 | Secant Stiffness (Drift Ratio = 0.4%)/Kei [kN/mm] | Kei/Ke1 | Kei/Ki | Secant Stiffness (Drift Ratio = 2%)/Kpi [kN/mm] | Kpi/Kp1 | Kpi/Ki |
|---|---|---|---|---|---|---|---|---|
| MRF1 | 21.1 | 1.00 | 21.1 | 1.00 | 1.00 | 11.8 | 1.00 | 0.56 |
| MRF2 | 18.9 | 0.89 | 18.9 | 0.89 | 1.00 | 10.5 | 0.89 | 0.56 |
| MRF3 | 17.1 | 0.81 | 17.0 | 0.81 | 1.00 | 9.6 | 0.81 | 0.56 |
| MRF4 | 15.1 | 0.71 | 15.1 | 0.71 | 1.00 | 8.6 | 0.73 | 0.57 |
| USPSW1 | 160.9 | 1.00 | 113.1 | 1.00 | 0.70 | 29.8 | 1.00 | 0.18 |
| USPSW2 | 155.0 | 0.96 | 109.6 | 0.97 | 0.71 | 29.2 | 0.98 | 0.19 |
| USPSW3 | 150.9 | 0.94 | 105.4 | 0.93 | 0.70 | 27.6 | 0.93 | 0.18 |
| USPSW4 | 139.6 | 0.87 | 100.2 | 0.89 | 0.72 | 25.4 | 0.85 | 0.18 |
| SPSW1−1VHS | 202.7 | 1.00 | 133.8 | 1.00 | 0.66 | 33.5 | 1.00 | 0.17 |
| SPSW2−1VHS | 196.0 | 0.97 | 129.5 | 0.97 | 0.66 | 32.7 | 0.97 | 0.17 |
| SPSW3−1VHS | 181.8 | 0.90 | 124.3 | 0.93 | 0.68 | 31.2 | 0.93 | 0.17 |
| SPSW4−1VHS | 172.6 | 0.85 | 119.9 | 0.90 | 0.69 | 29.3 | 0.87 | 0.17 |
| SPSW1−3VHS | 214.9 | 1.00 | 154.5 | 1.00 | 0.72 | 35.6 | 1.00 | 0.17 |
| SPSW2−3VHS | 205.2 | 0.95 | 148.9 | 0.96 | 0.73 | 34.3 | 0.96 | 0.17 |
| SPSW3−3VHS | 190.8 | 0.89 | 141.4 | 0.92 | 0.74 | 33.0 | 0.93 | 0.17 |
| SPSW4−3VHS | 180.6 | 0.84 | 135.6 | 0.88 | 0.75 | 31.3 | 0.88 | 0.17 |
| SPSW1−DS | 228.8 | 1.00 | 152.3 | 1.00 | 0.67 | 35.4 | 1.00 | 0.15 |
| SPSW2−DS | 218.5 | 0.95 | 148.4 | 0.97 | 0.68 | 34.0 | 0.96 | 0.16 |
| SPSW3−DS | 203.1 | 0.89 | 140.2 | 0.92 | 0.69 | 32.3 | 0.91 | 0.16 |
| SPSW4−DS | 194.0 | 0.85 | 135.1 | 0.89 | 0.70 | 30.2 | 0.85 | 0.16 |
Note: K1, Ke1, and Kp1 are the initial stiffness, secant stiffness of the drift ratio of 0.4%, and secant stiffness of the drift ratio of 2% for MRF, USPSW, SPSW1−1VHS, SPSW1−3VHS, and SPSW1−DS, respectively, in each type of model.
Table 7.
Final energy dissipation results for MRF, USPSW, SPSW−1VHS, SPSW−3VHS, and SPSW−DS with variable column flexural stiffnesses.
Table 7.
Final energy dissipation results for MRF, USPSW, SPSW−1VHS, SPSW−3VHS, and SPSW−DS with variable column flexural stiffnesses.
| Model | Final Energy Dissipation/(CDE)I [kN·m] | (CDE)i/(CDE)1 | Model | Final Energy Dissipation/(CDE)i [kN·m] | (CDE)i/(CDE)1 |
|---|---|---|---|---|---|
| MRF1 | 61.3 | 1.00 | USPSW1 | 202.7 | 1.00 |
| MRF2 | 55.0 | 0.90 | USPSW2 | 194.5 | 0.96 |
| MRF3 | 51.2 | 0.84 | USPSW3 | 190.5 | 0.94 |
| MRF4 | 46.1 | 0.75 | USPSW4 | 181.9 | 0.90 |
| SPSW1−1VHS | 270.8 | 1.00 | SPSW1−3VHS | 352.2 | 1.00 |
| SPSW2−1VHS | 264.2 | 0.98 | SPSW2−3VHS | 342.0 | 0.97 |
| SPSW3−1VHS | 249.8 | 0.92 | SPSW3−3VHS | 334.2 | 0.95 |
| SPSW4−1VHS | 237.5 | 0.88 | SPSW4−3VHS | 321.9 | 0.91 |
| SPSW1−DS | 273.4 | 1.00 | |||
| SPSW2−DS | 269.3 | 0.99 | |||
| SPSW3−DS | 260.1 | 0.95 | |||
| SPSW4−DS | 251.6 | 0.92 |
Table 8.
Mean values of the ultimate strength of the infill plate for USPSW, SPSW−1VHS, SPSW−3VHS, and SPSW−DS with variable column flexural stiffnesses.
Table 8.
Mean values of the ultimate strength of the infill plate for USPSW, SPSW−1VHS, SPSW−3VHS, and SPSW−DS with variable column flexural stiffnesses.
| Model | USPSW | SPSW−1VHS | SPSW−3VHS | SPSW−DS |
|---|---|---|---|---|
| Finite element values/VFEM [kN] | 619.1 | 734.5 | 815.3 | 800.6 |
| Theoretical values/Vt [kN] | 589.7 | 702.0 | 811.9 | 844.1 |
| VFEM/Vt | 1.05 | 1.05 | 1.00 | 0.95 |
Publisher’s Note: MDPI stays neutral with regard to jurisdictional claims in published maps and institutional affiliations. |
© 2022 by the authors. Licensee MDPI, Basel, Switzerland. This article is an open access article distributed under the terms and conditions of the Creative Commons Attribution (CC BY) license (https://creativecommons.org/licenses/by/4.0/).
Share and Cite
MDPI and ACS Style
He, J.; Li, Y.; Lin, S.; Dong, X.; Chen, S. Effect of Column Flexural Stiffnesses on the Seismic Performance of Stiffened Steel Plate Shear Walls. Buildings 2022, 12, 1965. https://doi.org/10.3390/buildings12111965
AMA Style
He J, Li Y, Lin S, Dong X, Chen S. Effect of Column Flexural Stiffnesses on the Seismic Performance of Stiffened Steel Plate Shear Walls. Buildings. 2022; 12(11):1965. https://doi.org/10.3390/buildings12111965
Chicago/Turabian StyleHe, Jianian, Yicheng Li, Shuhong Lin, Xian Dong, and Shizhe Chen. 2022. "Effect of Column Flexural Stiffnesses on the Seismic Performance of Stiffened Steel Plate Shear Walls" Buildings 12, no. 11: 1965. https://doi.org/10.3390/buildings12111965
Note that from the first issue of 2016, this journal uses article numbers instead of page numbers. See further details here.