
Plasma Assisted Re-Ignition of Aeroengines under High Altitude Conditions


Department of Engineering for Innovation, University of Salento, Via per Monteroni, 73100 Lecce, Italy
*
Author to whom correspondence should be addressed.
Aerospace 2022, 9(2), 66; https://doi.org/10.3390/aerospace9020066
Submission received: 29 December 2021
/
Revised: 19 January 2022
/
Accepted: 20 January 2022
/
Published: 26 January 2022
(This article belongs to the Special Issue 11th EASN International Conference on Innovation in Aviation & Space to the Satisfaction of the European Citizens)
Abstract
:Re-ignition of aeroengines under high altitude conditions is of great importance to the safety and use of lean-burn flame. This study is focused on the experimental and numerical characterization of flow dynamics and flame re-ignition in a rectangular burner. A ring-needle type plasma actuator was considered and run by high-voltage (HV) nanopulsed plasma generator. The electrical power delivered to the fluid and an optimal value of reduced electric field (EN) was calculated considering non-reactive flow. Smoke flow visualizations using a high-speed camera and proper orthogonal decomposition (POD) were performed to recognize the most dominant flow structures. Experimental results revealed the transport effects due to plasma discharge, such as the induced flow, that could have a strong impact on the recirculation zone near the corners of combustor, improving the mixing performance and reducing the ignition delay time. Two different numerical tools (ZDPlasKin and Chemkin) were used to investigate the ignition characteristics. ZDPlasKin calculated the thermal effect and the plasma kinetic of nanopulsed plasma discharge at the experimentally measured EN. Finally, based on the output of ZDPlasKin, Chemkin estimated the flame ignition at low pressure and low temperature conditions. It was noticed that time required to achieve the maximum flame temperature with plasma actuation is significantly less than the auto-ignition time (‘clean case’, simulation result of the model without considering the plasma effect). Maximum reduction in ignition time was observed at inlet pressure 1 bar (3.5 × 10⁻⁵ s) with respect to the clean case (1.1 × 10⁻³ s). However, as the inlet pressure is reduced, the ignition delay time was increased. At 0.6 bar flame ignition occurred in clean case at 0.0048 s and at 0.0022 s in presence of the plasma actuation, a further decrease of the pressure up to 0.4 bar leads the ignition at 0.0027 s and 0.0063 s in clean and plasma actuation, respectively.
1. Introduction
Lean and premixing combustion techniques are one of the most prominent methods of lowering the flame temperature and subsequently NOx emissions, however, this approach produces severe flame instabilities which have to be avoided. Moreover, at present, a major challenge of aerospace combustors is ignition at high altitude conditions characterized by low pressure and low temperature. In this context, several passive control strategies have been used to investigate flame stabilization by modifying the combustor geometry in a permanent way. However, plasma-assisted combustion technology is the most encouraging technique to actively control the combustion characteristics under real-time operating conditions [1].
These days, two different types of plasmas, one is the thermal plasma (equilibrium plasma) in which rotational and vibrational temperatures and particularly the electron temperature of active species are in thermal equilibrium and electron number density and neutral gas temperature are very high, for example plasma torch and spark plug. The other type of plasma is the non-thermal plasma (NTP). It is also known as non-equilibrium plasma or cold plasma. In NTP, the electrical power is primarily used to produce energetic electrons useful for activating the reagents, while the gas temperature remains constant. Recently, the use of NTP is considered one of the most promising techniques to improve the flame ignition by shortening the ignition delay time, increasing lean flame stabilization, accelerating low-temperature oxidation, and extending lean blowout limits [1,2]. NTP has great capability to improve the flame ignition and combustion thanks to thermal effects (via temperature rise), kinetic effects (via plasma generated vibrationally and electronically excited molecules and neutral radicals), and transport effects. These last effects are given by diffusion transport enhancement effect via fuel reforming and low temperature oxidation and convective transport improvement due to plasma generated ionic wind, hydrodynamic instability, and flow motion via Coulomb and Lorentz forces [3].
Successful demonstrations of plasma-assisted ignition (PAI) has been performed by using different NTPs—such as atmospheric pressure discharge, microwave discharge, radio frequency discharge, corona discharge, surface discharge, direct current glow discharge (DCGD), laser ignition, and dielectric barrier discharge (DBD) [4]. Among NTP technologies, the dielectric barrier discharge (DBD) is widely considered and credit goes to the simplicity of its design and the wide range of operating modes. DBD plasma actuators showed great interest in aeronautics due to reattaching of separated flows and controlling of the boundary layer from transition to turbulence [5,6] due to the induced flow field, hence they could be used also to modify the flow dynamics close to the recirculation area of the combustors. The arrangement of DBD is based on two electrodes; one is connected with high voltage while the other one is grounded. The time varying voltage is required to drive the DBD in occurrence of capacitive coupling [4]. Basically, DBD is working into two different operations modes: the sinusoidal wave form and nanosecond repetitively pulsed discharge (NRPD). The NRPD has garnered much attention due to its wide capacity of generating excited states and active radicals by ionization, dissociation, and electron impact excitation reactions, which could be due to of high reduced electric field EN values which improved the flame ignition [7]. Moreover, NRPD also generate the fast gas heating which helps to improve the ignition via improvement in thermal pathways [8]. However, during the NRPD electron impact reactions (plasma chemistry) have different time scales than the gas phase reactions (combustion chemistry) [9].
Bernard [10,11] experimentally investigated a turbulent air jet under the effects of DBD driven by sinusoidal generator. The turbulent spectrum, turbulent kinetic energy, and velocity profiles have been analyzed; it was also noticed that DBD plasma actuation could lead to improve the mixing performance. Xu [12] studied the impacts of AC-DBD in coaxial methane/air burner. During the tests, the high-voltage electrode was around the outer burner tube whereas an inner burner tube acted as a grounded electrode. The authors noticed that flame structure was strongly affected by the electric field EN generated by means of the AC-DBD plasma discharge.
Many experimental and numerical studies have been performed to develop the kinetic model including plasma actuated reactions to investigate the ignition enhancement by NRPD. Aleksandrov [9] performed the plasma kinetic modeling of CH4/air mixture and revealed that the neutral radicals and active species produced through NRDP accelerated the ignition process. However, only atoms and free radicals were considered in their simulation work and the effects of excited species were neglected. Ju [7] studied the kinetic mechanism by only including electronical species of oxygen and hydrogen by neglecting the role of vibrational species. Kosarev [13] focused on the numerical and experimental approaches to characterize the ignition kinetics of CH4:O2:Ar mixture at temperature ranges of 1230 K to 1719 K and pressure of 0.3 bar to 1.1 bar by subjecting high-voltage NRDP in the shock tube. It has been noticed that ignition times were considerably reduced with the use of NRDP. However, this study neglected the evolution of vibrational and electronical excitation species. Starik [14] investigated the combustion mechanism of methane/air mixture, including kinetics of singlet oxygen but without the modeling of plasma discharge and vibrational species. Uddi [15] performed the experimental and comparative measurements of oxygen atom in air and methane–air mixture subjecting NRDP by using laser induced fluorescence, but they neglected the treatment of vibrational species.
Although many studies have been performed during the last decade, the accurate mechanism and fundamental knowledge of ignition enhancement by plasma discharge is still at exploratory stages. Furthermore, few studies focused on the re-ignition of aeroengine under high altitude conditions is of great importance to the safety and use of lean-burn.
Hence, this study performed a numerical characterization of the ignition delay time in a rectangular burner, particularly under high altitude conditions. A ring-needle type plasma actuator powered by a high-voltage nanosecond pulsed generator was used. Firstly, an experimental analysis was performed. The electrical power delivered to the fluid and an optimal value of reduced electric field (EN) was measured through dedicated experiments under non-reactive flow, which could be appropriate for the numerical analysis of flame ignition. Smoke flow visualizations were also carried out by using a high-resolution camera to investigate the fluid dynamics effects of plasma actuation on the flow behavior. The preliminary POD analysis was also performed to recognize the major dominant flow structures generated at different plasma actuation conditions. Finally, two different numerical tools (ZDPlasKin and Chemkin) were used to investigate the flame ignition characteristics under high altitude conditions.
2. Experimental Setup and Electrical Characterization
The experimental setup was implemented to study the effects on the flow of NRPD such as the induced flow in the recirculation zone. A ring-needle plasma actuator was installed in a rectangular burner and operated by nanosecond pulsed generator. The plasma actuator consisted of two copper electrodes, one is a ring type electrode with the inner diameter = 32 mm and the outer diameter = 52 mm, connected to the HV. The second one is the grounded electrode that is a needle with a length of 330 mm and the diameter equal to 1 mm, placed at the center of the ring electrode at the standoff distance s = 0 mm, and acted as grounded. The standoff distance referred to the position of the needle electrode from the upper edge of the ring electrode.
The effects of the output voltage of the HV power supply and of the standoff distance were analyzed, as reported in Table 1. At first, two different percentage values of the HV voltage were considered, in particular 20% and 40% of the maximum output voltage of the power supply Vmax, by keeping constant the standoff distance equal to 0 mm. Secondly, the standoff distance varied from 0 mm to 20 mm and 40 mm at 40%Vmax applied voltage and frequency.
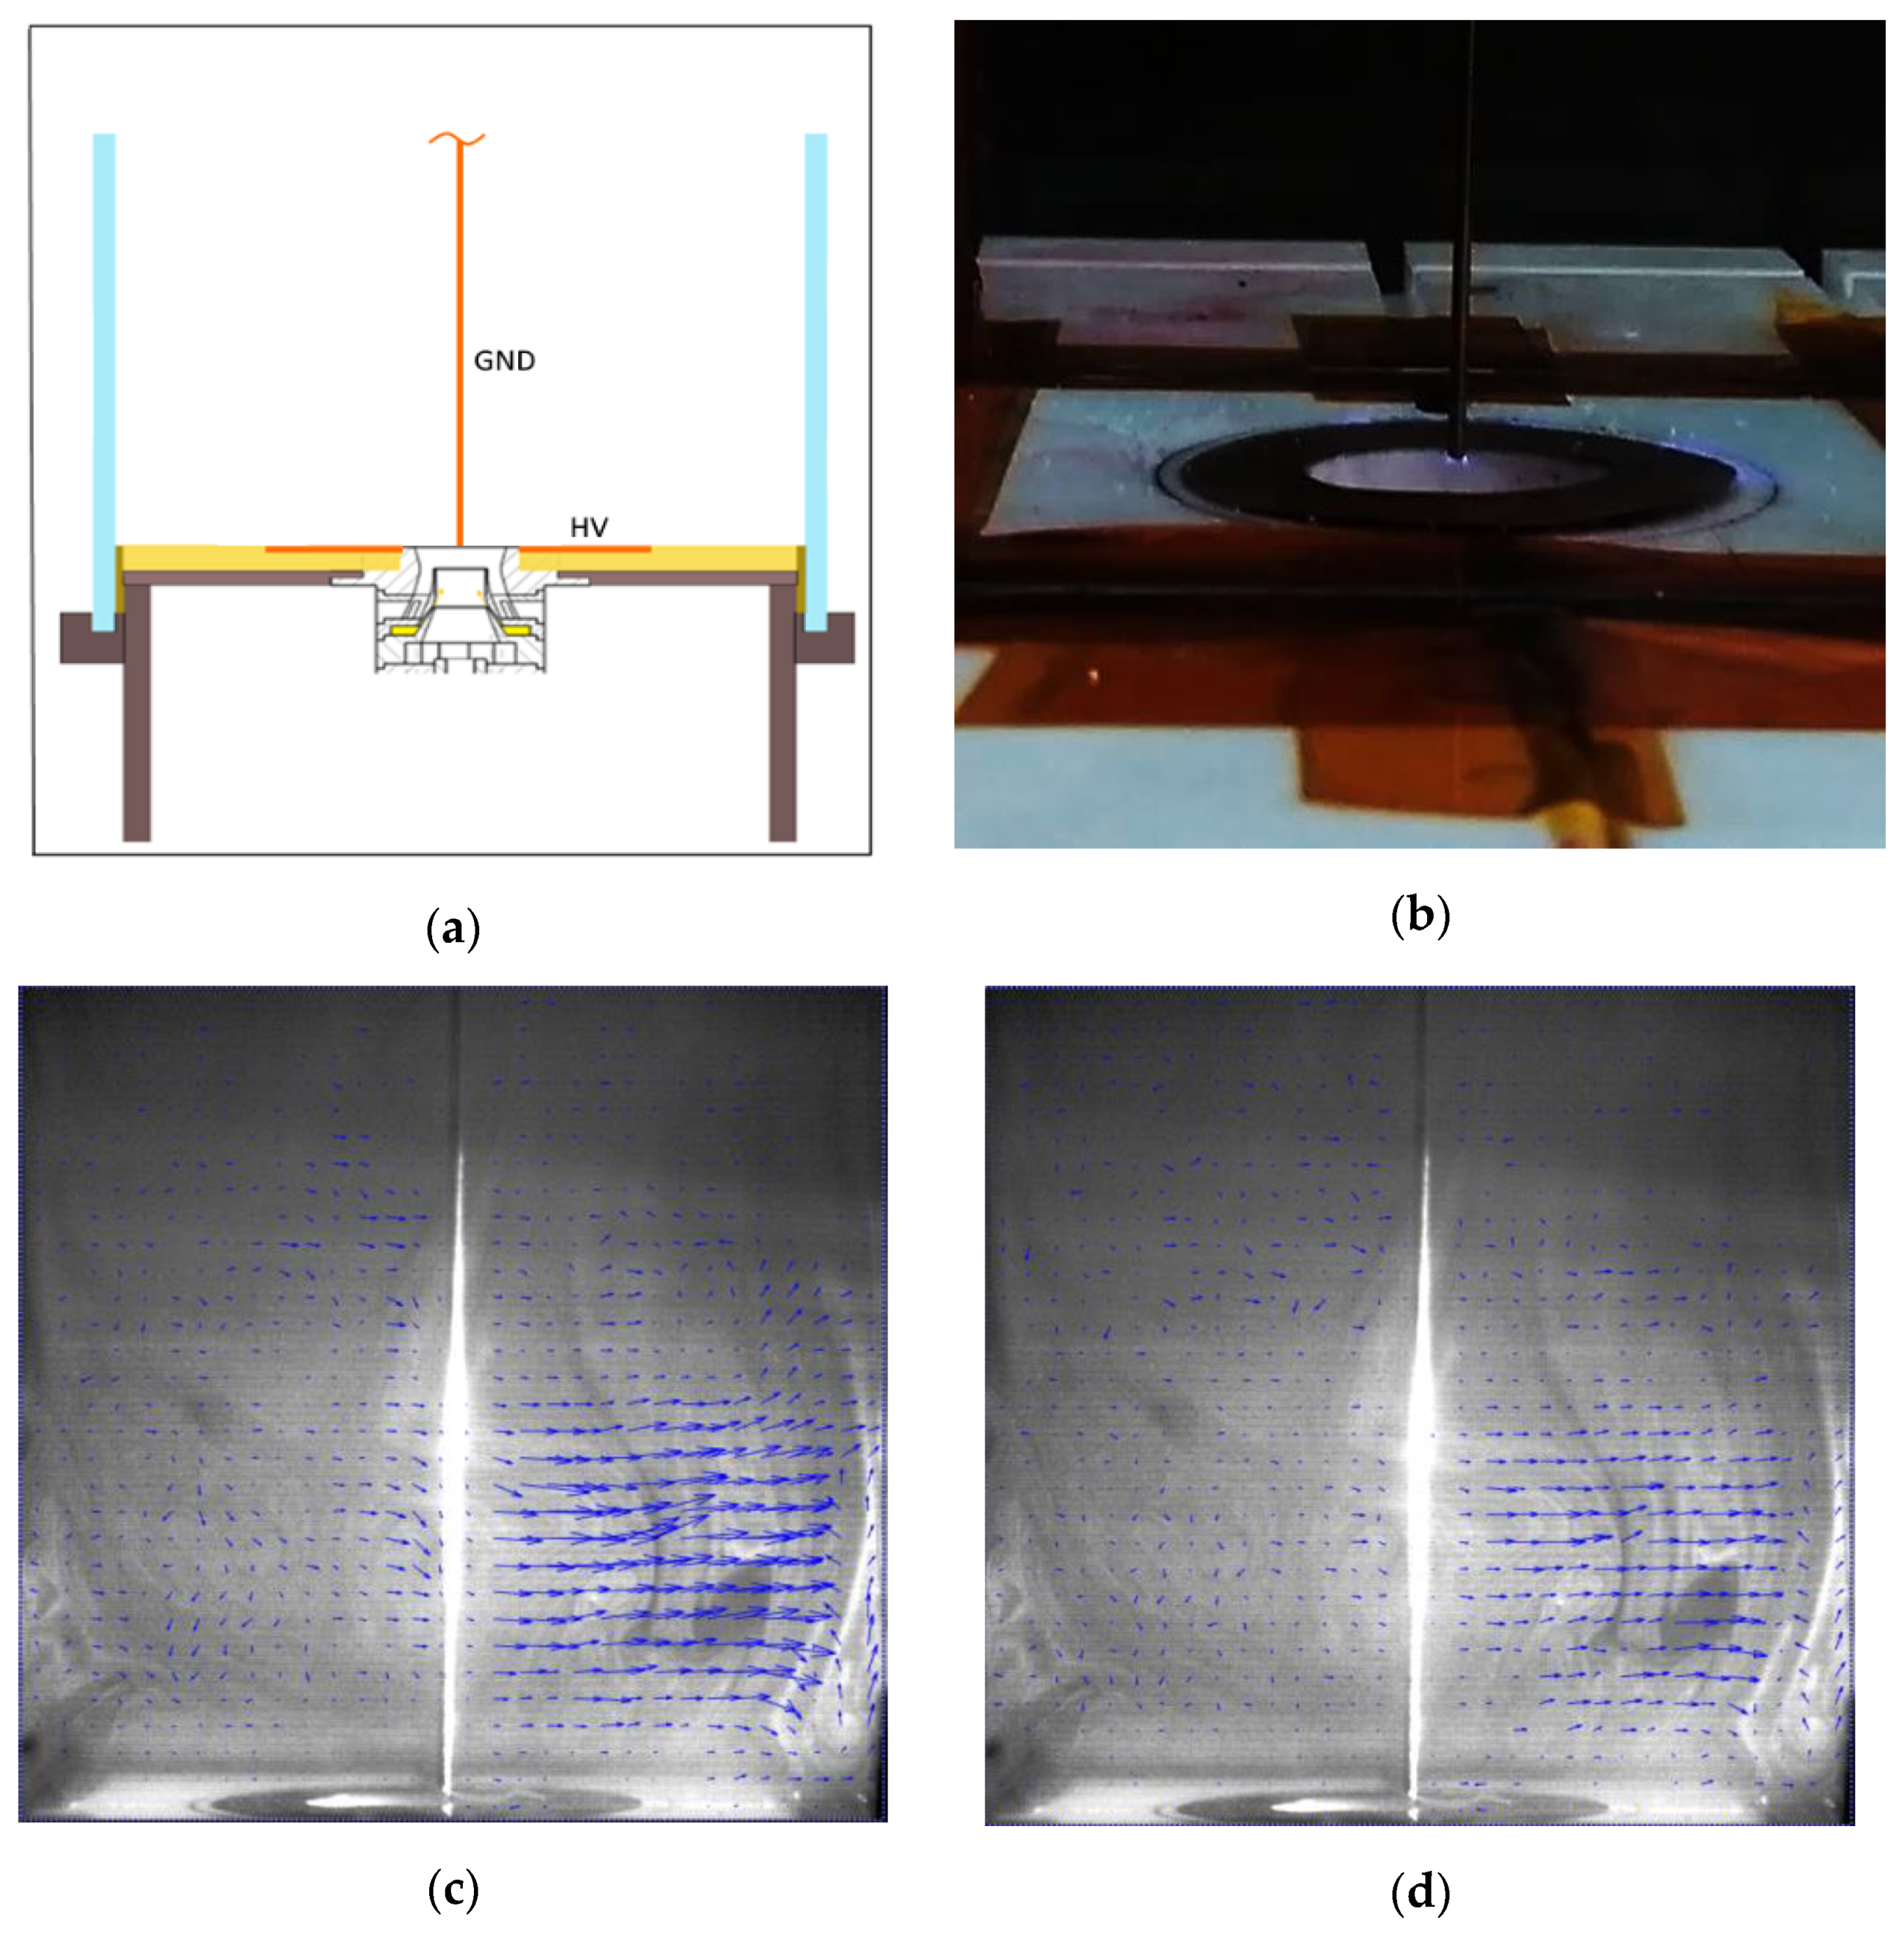
Figure 1 shows the sketch of the rectangular burner with the position of grounded electrode (GND) and the high-voltage (HV) electrode, location of plasma, and expected instantaneous streamlines. Plasma was generated at the tip of needle electrode and at the corners of disk electrode as in Figure 1b. Figure 1c,d depicts the instantaneous velocity streamlines for the test case at high-voltage amplitude equal to 40%Vmax, frequency equal to 30% and standoff distance equal to 0 mm and 20 mm, respectively. They clearly define the recirculation zone at the rectangular corners of the burner that could help to promote the combustion process. All the tests were conducted considering non-reactive flow at ambient conditions. A faraday cage was used to protect the system from electromagnetic field caused by high EN. Figure 2 depicts a detailed view of experimental setup for combustion and electrical characterization. The electrical setup consisted of HV nanosecond pulsed generator, current transformer, HV probe, oscilloscope, and a personal computer. The current transformer and HV probe were connected to the oscilloscope to acquire the time dependent voltage and current signals.
3. Numerical Procedure
Numerical modeling of PAI has been performed by using a zero-dimensional plasma kinetic model (ZDPlasKin) [16] and the chemical kinetic model (CHEMKIN) [17]. Figure 3 depicts the detailed explanation of numerical methodology. The extended version of chemical kinetics mechanisms for methane/air plasma assisted combustion was implemented from the literature by considering both electron impact reactions and gas phase reactions [18,19,20,21]. The mechanism consisted of 161 species and 1382 reactions—including charged transfer reactions, vibrationally excited reactions, electronically excited reactions, three body recombination reactions, ionization, relaxation, and dissociation reactions. ZDPlasKin solver was used to predict the thermal and kinetic effects of NRPD on pre-mixed methane/air at the same measured experimental reduced electric field EN. Boundary conditions for numerical analysis in terms of pressure, temperature, and electrical feeding were same as in Experimental Test 2 (Table 1). The Boltzmann equation solver was coupled with ZDPlaskin to estimate the temporal evolution of neutral radicals and active species. Finally, based on the output of ZDPlasKin, Chemkin was used to predict the flame ignition at high altitude conditions—i.e., low pressure and low temperature. The closed homogenous batch reactor was used for the ignition analysis. The detailed description of numerical procedure and experimental validation of extended version of mechanism has been presented in our previously published articles [22,23].
4. Results and Discussions
4.1. Electrial Characterization
Table 2 presented the electrical output in terms of electrical power delivered to the non-reactive flow at different plasma actuation conditions; in particular, the electrical power per pulse and the mean electrical power were reported.
It has been noticed that the power delivered to fluid is almost same in Test 1 and 2; however, with the increase of standoff distances, it significantly reduced as in Test 3 and 4. Therefore, it was concluded that controlling of plasma discharge could be possible in two ways, either to control voltage amplitude or to adjust the standoff distance by moving needle in y-axis. The time dependent evolution of voltage-current characteristics at different HV amplitude voltages and standoff distances has been shown in Figure 4. The voltage signal was highly variable due to NRPD mode of actuation. The current signals presented several high-amplitude spikes due to the plasma discharges that lead to a fast electrical impedance change within the actuator. The maximum peak voltage was noticed in Test 2 which was selected for numerical analysis. The voltage signal and gap distance between ring and needle electrodes were considered for the prediction of the EN, because EN is the major factor to control energy deposition and production of active species during NRPD. Energy obtained by electric field is transmitted to the various excitation states via electron impacted reactions. The temporal evolution of EN of Test 2 is shown in Figure 5, it shows the several peaks during the single pulse discharge. The mean integral value of EN in the time interval of 10−6 was about 200 Td. This value has been previously proved to improve the combustion characteristic time of methane flame [22,23,24]. Therefore, numerical analysis of ignition characteristics has been performed by considering the electrical output of Test 2.
4.2. Flow Visualization
The smoke flow visualizations have been carried out by using a high-resolution camera (MEMRECAM GX-3). An advantage of the flow analysis under quiescent conditions is that it could be possible to better analyze the plasma induced flow due to the momentum transfer, which otherwise would be hidden by effects due to the chemical reactions.
The Plexiglas box was seeded with incense smoke. For assessing the ability of the incense smoke seeding particles to follow the flow field, the particle relaxation time and the Stokes number St were evaluated.
The Stokes number is the ratio between the particle residence time and the characteristic time of the carrier fluid corrected with the slip correction factor, Cc.
where ρp is the particle density, d is the particle diameter, v is a characteristic velocity scale of the flow, μ is the fluid viscosity, l is a characteristic length scale of the flow, and Cc the slip correction factor (or Cunningham’s correction factor) [25]. Chinese joss sticks were used for seeding, it was estimated a particle diameter around 0.3 μm and a particle density of 1.06 g/cm3 [26,27]. It was found that, at standard conditions (293 K and 101 kPa), the slip correction factor was around 1.554 [28,29].
The particle residence time was estimated equal to 0.00004 s and the Stokes number St equal to 0.0018, assuming v of 0.1 m/s (set to mean velocity measured in previous LDV experiments) and l equal to 3.3 cm (inner diameter). According to [30], St << 0.1 returns an acceptable flow tracing accuracy with errors below 1%.
Smoke flow visualizations at the downstream region of the exposed electrodes at different HV voltage amplitudes (Tests 1–2) and standoff distances (Test 2, 3, and 4) were performed for the identification of vortical flow pattern generated in quiescent atmospheric air, as shown in Figure 6 and Figure 7. It has been noticed that in Test 1 and Test 2, flow field was uniformly distributed; only one leading vortex was observed on the corners of closed box that could modify the flow recirculation in the burners, with an improvement of the combustion. Moreover, with the increase of the standoff distance, as in Test 3 and Test 4, uniformity and mixing performance were gradually decreased, and the flow was moved to upstream of the closed box.
Moreover, for a deep analysis of the induced flow vortices and coherent structures, the preliminary investigation of POD analysis of non-reactive flow was performed, which allows the identification of dominant structures from random data. The sign and the intensity of POD eigen structures represent the coherent flow structures. The relative contribution of each mode to the flow field reconstruction is described by their energy. The first POD mode represents the most energetic flow structure, and it is strictly related to the flow variance. The relative mode energy is mainly consumed and distributed by the first three modes in all test cases as shown in Figure 8. Though, the influence of the first mode was relatively high, while POD modes above number 3 are less significant. Hence, only the first three modes were considered for the POD flow analysis. The POD structures at different amplitudes and standoff distances are shown in Figure 9 and Figure 10, respectively. In Test 1, Mode 1, and Mode 2 were more symmetric and they have approximately the same relative energy as shown in Figure 8. However, in Test 2, Mode 1, and Mode 2 present quite different structures and almost 80% of relative energy were captured by Mode 1. Besides this, when the standoff distance was 0 mm, flow disturbances was quite attached to the needle electrode and located on the downstream of closed box as in Test 1 and 2; however, with the increase of standoff distance as in Test 3 and 4 the flow was moved to the corners and upstream of the rectangular box.
4.3. Production of Active Particles
Different from traditional ignition techniques, which depend mainly on gas heating, NTP provides enhancement through kinetics. This happens through collisions between energetic electrons and abundant particles such as diatomic nitrogen and oxygen, finally leading to the generation of radicals that promote ignition. In our previous studies, it has been noticed that the deposition of nanopulsed plasma discharge decomposed the methane/air and improved the concentrations of neutral radicals such as H, CH, OH, CH3, O, and O3 by following the electron impact reactions [22,23,24].
In this paper, numerical analysis of neutral radicals has been performed at different inlets pressure aiming to see particularly the effects on concentration of particles at low pressure. Experimental EN = 200 Td, inlet temperature equal to 300 K, and initial reaction of CH4/N2/O2 were considered. Figure 11 showed the production of free radicals H, CH3, O, O3, CH, and OH at three different inlet pressure values. It has been perceived that with the use of plasma discharge active particles were produced; however, by decreasing the inlet pressure, the concentrations of all neutral radicals were also significantly reduced and minimum concentrations were observed at 0.4 bar. This effect could be due to the slow speed of electron impacts reactions and low ionization process at low pressure conditions. However, still the production rate of radicals is applicable to enhance the flame ignition at low pressure as discussed in the next section of ignition process. At a pressure of 1 bar, the peak concentration of all radicals ranges between 10−1 and 10−2 except CH which lies between 10−3 and 10−4. Table 3 is showing the conditions that have been used to simulate the plasma effects.
4.4. Ignition Characteristics at Low Pressure and Temperature Conditions
The impact of needle-ring nanopulsed plasma actuator on the flame ignition was analyzed at low pressure and fixed inlet temperature and plasma actuation conditions. Experiments showed that the transport effects of plasma needle-disk plasma actuator could improve the mixing of the fuel/air mixture, which a possible contribution to the reduction of ignition delay time. ZDPlasKin permitted to estimate the thermal and kinetics effects due to the nanopulsed plasma discharge at the experimentally measured EN. Finally, based on the thermal and kinetic outputs of ZDPlasKin, in terms of rise of the mixture temperature and production of active species, Chemkin estimated the flame ignition at low pressure and low temperature conditions. A closed homogeneous batch reactor (CHBR) was used to predict the ignition delay time.
The closed homogenous batch reactor has been commonly used for the analysis of ignition delay timings in Chemkin solver. Two important parameters were available in the setting of solver to define the ignition process: maximum concentrations of OH species and temperature inflection point. This means that the computation of ignition delay timings could be predicted by maximum molar fraction of OH species and temperature inflection point (TIP). The TIP is defined as the position where the rate of change of temperature with reference to time is largest.
Figure 12 shows the comparative analysis of ignition delay time of clean case (without plasma) and plasma actuation at different inlet pressures at constant inlet mixture temperature equal to 1400 K and EN = 200 Td. It was noticed that the time required to achieve the maximum flame temperature with plasma actuation is significantly reduced in comparison with autoignition time (clean case, without plasma actuation). At 1 bar, the ignition time was 1.1 × 10⁻³ s while it was reduced at 3.5 × 10⁻⁵ s in presence of plasma actuation. However, lowering the inlet pressure, the ignition delay time increased for both the clean case (without plasma effect) and plasma assisted case. Results showed that plasma-assisted ignition is more efficient at low pressures. At 0.6 bar flame ignition occurred in case without plasma effects at (0.0048 s) and plasma assisted ignition (0.0022 s), simultaneously, at 0.4 bar it achieved at 0.0063 s and 0.0027 s without and with plasma actuation, respectively. Figure 13 depicts the temporal evolution of maximum molar concentration of OH species at different inlet pressures during the inlet plasma discharge. It has been noticed that maximum OH concentrations were produced at the same time at which temperature inflection point was achieved. At the same pressure, the maximum OH is higher and reached in a shorter time in the case of plasma actuation than in the case without plasma. It is also possible to see the evolution of the OH during the first stage.
Ignition in low-temperature repetitively pulsed nanosecond discharge plasmas occurs mainly due to plasma chemical radical species reactions rather than due to rapid localized heating. In particular, the ignition enhancement is due to the conversion of electron energy into the bond energy of free/active radicals produced during the plasma discharge processes. Then, the bond energy of free/active radicals is transformed into internal energy during the ignition process.
Adding to this, flame ignition analysis was also carried out at low inlet mixture temperature by putting constant inlet pressure of 0.4 bar and 0.6 bar. Figure 14 shows the comparative behavior of ignition delay time at different low inlet temperature ranges from 1000 K to 1300 K, investigating the time required to achieve the maximum combustion temperature. It has been noted that, with the increase of inlet temperature, ignition time was reduced, and minimum reduction was observed at 1300 K for both 0.4 bar and 0.6 bar; however, the reduction effect was bit high at 0.6 bar than the 0.4 bar. At a low temperature of 1000 K, ignition times were observed at 0.013 s and 0.010 s for 0.4 and 0.6 bar, respectively. Moreover, the maximum combustion temperature of all initial mixture temperature values was similar around 2700 K for both mixture pressure values. Simultaneously, the parametric study at different inlet temperatures was performed at two different operating pressure values and the results are shown in Figure 15. It has been noticed that the rise of the inlet temperature reduced the influence of the ignition delay time on the operating pressure.
5. Conclusions
The present work investigated the experimental and numerical characterization of flow structures and ignition delay time, particularly at high altitude conditions—i.e., low inlet pressure and temperature. Plasma assisted ring-needle plasma actuator was developed and powered by a high-voltage nanosecond pulse generator. The electrical characterization has been performed considering different percentage values of the HV amplitude and different standoff distances. The mean power and optimum value of EN were experimentally measured and used in the numerical study for the prediction of the ignition delay time. Smoke flow visualizations and the POD analysis showed the transport effects of the plasma discharges, which generated an induced flow in the recirculation zone near the corners of the combustor, with a possible effect on the mixing of the fuel/air mixture. Finally, predictions of the ignition delay time for the case without plasma effects and the plasma assisted ignition cases at different inlet pressure and temperature values were performed, assuming for the plasma effects the experimental EN equal to 200 Td. It was noticed that the time required to achieve the maximum flame temperature with PAI is significantly reduced in comparison with the autoignition time. Maximum reduction in ignition time was observed at 1 bar (3.5 × 10⁻⁵ s) with respect to the case without plasma (1.1 × 10⁻³ s). However, decreasing the inlet pressure, the ignition delay time of clean and PAI were increased. At 0.6 bar the flame ignition occurred at 0.0022 s in case without plasma and at 0.0048 s for the PAI, while at 0.4 bar it was achieved at 0.0027 s and 0.0063 s without and with PAI, respectively. The flame ignition analysis was also carried out at different inlet temperature values at constant operating pressure, equal to 0.4 bar and 0.6 bar. It has been noted that with the increase of the inlet temperature, the ignition delay time was reduced, and the minimum reduction was observed at 1300 K for both 0.4 bar and 0.6 bar; however, the reduction was less significant at 0.6 bar than at 0.4 bar. At a low temperature of 1000 K, the ignition delay time was equal to 0.013 s and 0.010 s for 0.4 and 0.6 bar, respectively.
Author Contributions
Conceptualization, M.G.D.G.; Methodology, M.G.D.G.; Software, G.M.; Validation, G.M.; Formal analysis, G.M.; Investigation, G.M. and S.B.; Data curation, G.M. and S.B.; Writing—original draft preparation, G.M. and S.B.; Writing—review and editing, M.G.D.G.; Visualization, G.M. and S.B.; Supervision, M.G.D.G.; Project administration, M.G.D.G.; Funding acquisition, M.G.D.G. All authors have read and agreed to the published version of the manuscript.
Funding
The work was supported and funded by the PON R&I 2014–2020 Asse I “Investimenti in Capitale Umano” Azione I.1 “Dottorati Innovativi con caratterizzazione industriale”—Corso di Dottorato in “Ingegneria dei Sistemi Complessi” XXXV ciclo—Università degli Studi del Salento”—Borsa Codice: DOT1312193 no. 3. This project is also received funding from the Clean Sky 2 Joint Undertaking (JU) under the grant agreement no. 831881 (CHAiRLIFT). The JU received support from the European Union’s Horizon 2020 research and innovation program and the Clean Sky 2 JU members other than the Union.
Conflicts of Interest
The authors declare no conflict of interest.
References
- Starikovskiy, A.; Aleksandrov, N. Plasma-Assisted Ignition and Combustion. Prog. Ener. Comb. Sci. 2013, 39, 61–110. [Google Scholar] [CrossRef] [Green Version]
- Ju, Y.; Lefkowitz, J.K.; Reuter, C.B.; Won, S.H.; Yang, X.; Yang, S.; Sun, W.; Jiang, Z.; Chen, Q. Plasma Assisted Low Temperature Combustion. Plasma Chem. Plasma Process. 2016, 36, 85–105. [Google Scholar] [CrossRef]
- Starikovskiy, S.M. Topical review: Plasma-assisted ignition and combustion. J. Phys. D Appl. Phys. 2006, 39, 265–299. [Google Scholar] [CrossRef]
- Ruma, M.; Ahasan, H.; Ranipet, H.B. A Survey of Non-thermal plasma and their generation methods. Int. J. Renew. Energy Environ. Eng. 2016, 4, 6–12. [Google Scholar]
- De Giorgi, M.G.; Pescini, E.; Marra, F.; Ficarella, A. Plasma actuator scaling down to improve its energy conversion efficiency for active flow control in modern turbojet engines compressors. Appl. Therm. Eng. 2016, 106, 334–350. [Google Scholar] [CrossRef]
- Francioso, L.; De Pascali, C.; Pescini, E.; De Giorgi, M.G.; Siciliano, P. Modelling, fabrication and plasma actuator coupling of flexible pressure sensors for flow separation detection and control in aeronautical applications. J. Phys. D Appl. Phys. 2016, 49, 235201. [Google Scholar] [CrossRef]
- Ju, Y.; Sun, W. Plasma Assisted Combustion: Dynamics and Chemistry. Prog. Energy Combust. Sci. 2015, 48, 21–83. [Google Scholar] [CrossRef]
- Tholin, F.; Lacoste, D.A.; Bourdon, A. Influence of Fast-Heating Processes and O Atom Production by a Nanosecond Spark Discharge on the Ignition of a Lean H2-Air Premixed Flame. Combust. Flame 2014, 161, 1235–1246. [Google Scholar] [CrossRef]
- Aleksandrov, N.L.; Kindysheva, S.V.; Kukaev, E.N.; Starikovsjaya, S.M.; Starikovskii, A.Y. Simulation of the Ignition of a Methane-Air Mixture by a High-Voltage Nanosecond Discharge. Plasma Phys. Rep. 2009, 35, 867–882. [Google Scholar] [CrossRef]
- Benard, N.; Braud, P.; Pons, J.; Touchard, G.; Moreau, E. Quasi-steady and unsteady actuation by surface non-thermal plasma discharge for control of a turbulent round air jet. J. Turbul. 2007, 8, N49. [Google Scholar] [CrossRef]
- Bernard, N.; Bonnet, P.J.; Touchard, G.; Moreau, E. Flow control by dielectric barrier discharge actuators: Jet mixing enhancement. AIAA J. 2008, 46, 2293–2305. [Google Scholar] [CrossRef]
- Xu, C.; Li, L. Electric effects on the pre-mixing process in DBD assisted combustions. Appl. Mech. Mater. 2015, 722, 235–238. [Google Scholar] [CrossRef]
- Kosarev, I.N.; Aleksandrov, N.L.; Kindysheva, S.V.; Starikovskaia, S.M.; Starikovskii, A.Y. Kinetics of Ignition of Saturated Hydrocarbons by Nonequilibrium Plasma: CH4-Containing Mixtures. Combust. Flame 2008, 154, 569–586. [Google Scholar] [CrossRef]
- Starik, A.M.; Kozlov, V.E.; Titova, N.S. On the influence of singlet oxygen molecules on the speed of flame propagation in methane–air mixture. Combust. Flame 2010, 157, 313–327. [Google Scholar] [CrossRef]
- Uddi, M.; Jiang, N.; Mintusov, E.; Adamovich, I.V.; Lempert, W.R. Atomic oxy- gen measurements in air and air / fuel nanosecond pulse discharges by two photon laser induced fluorescence. Proc. Combust. Inst. 2009, 32, 929–936. [Google Scholar] [CrossRef]
- Pancheshnyi, S.; Eismann, B.; Hagelaar, G.J.M.; Pitchford, L.C. ZDPlaskin Zero-Dimensional Plasma Kinetic Solver 2008. Available online: http://www.zdplaskin.laplace.univ-tlse.fr/ (accessed on 8 September 2021).
- Lutz, A.E.; Kee, R.J.; Miller, J.A. SENKIN: A FOR- TRAN Program for Predicting Homogeneous Gas Phase Chemical Kinetics with Sensitivity Analysis; Report No. SAND87-8248; Sandia National Laboratories: Livermore, CA, USA, 1988. [Google Scholar]
- Capitelli, M.; Ferreira, C.M.; Gordiets, B.F.; Osipov, A.I. Plasma Kinetics in Atmospheric Gases; Springer: Berlin/Heidelberg, Germany, 2000. [Google Scholar]
- Flitti, A.; Pancheshnyi, S. Gas heating in fast pulsed discharges in N2–O2 mixtures. Eur. Phys. J. Appl. Phys. 2009, 45, 21001. [Google Scholar] [CrossRef] [Green Version]
- Mao, X.; Rousso, A.; Chen, Q.; Ju, Y. Numerical modeling of ignition enhancement of CH4/O2/He mixtures using a hybrid repetitive nanosecond and DC discharge. Proc. Combust. Inst. 2019, 37, 5545–5552. [Google Scholar] [CrossRef]
- Mao, X.; Chen, Q.; Guo, C. Methane pyrolysis with N2/Ar/He diluents in a repetitively-pulsed nanosecond discharge: Kinetics development for plasma assisted combustion and fuel reforming. Energy Convers. Manag. 2019, 200, 112018. [Google Scholar] [CrossRef]
- Fontanarosa, D.; Mehdi, G.; De Giorgi, M.G.; Ficarella, A. Assessment of the impact of nanosecond plasma discharge on the combustion of methane air flames. E3S Web Conf. 2020, 197, 10001. [Google Scholar] [CrossRef]
- Mehdi, G.; Bonuso, S.; De Giorgi, M.G. Effects of Nanosecond Repetitively Pulsed Discharges Timing for Aeroengines Ignition at Low Temperature Conditions by Needle-Ring Plasma Actuator. Energies 2021, 14, 5814. [Google Scholar] [CrossRef]
- Mehdi, G.; De Giorgi, M.G.; Fontanarosa, D.; Bonuso, S.; Ficarella, A. Ozone Production With Plasma Discharge: Comparisons Between Activated Air and Activated Fuel/Air Mixture. In Proceedings of the ASME Turbo Expo 2021: Turbomachinery Technical Conference and Exposition, Virtual, 7–11 June 2021; Volume 3B. Combustion, Fuels, and Emissions V03BT04A036. [Google Scholar] [CrossRef]
- Yoon, S.; Ross, J.; Mench, M.; Sharp, K. Gas-phase particle image velocimetry (PIV) for application. J. Power Sources 2006, 160, 1017–1025. [Google Scholar] [CrossRef]
- Cheng, Y.S.; Bechtold, E.; Yu, C.C.; Hung, I.F. Incense smoke: Characterization and dynamics in indoor environments. Aerosol Sci. Technol. 1995, 23, 271–281. [Google Scholar] [CrossRef]
- See, S.W.; Balasubramanian, R.; Joshi, U.M. Physical characteristics of nanoparticles emitted from incense smoke. Sci. Technol. Adv. Mater. 2007, 8, 25–32. [Google Scholar] [CrossRef] [Green Version]
- Hosokawa, M.; Kiyoshi, N.; Naito, M.; Yokoyama, T. Nanoparticle Technology Handbook, 1st ed.; Elsevier: Amsterdam, The Netherlands, 2007; ISBN 9780080558028. [Google Scholar]
- Hinds, W.C.; Zhu, Y. Aerosol Technology: Properties, Behaviour, and Measurement of Airborne Particles; John Willey & Sons, Inc.: Los Angeles, CA, USA, 1998. [Google Scholar]
- Tropea, C.; Yarin, A.L.; Foss, J.F. Springer Handbook of Experimental Fluid Mechanics; Springer: Berlin, Germany, 2007. [Google Scholar]
Figure 1.
(a) A sketch of the burner indicating the electrodes, GHD: grounded electrode and HV: annular high-voltage electrode, (b) location of plasma, (c) instantaneous streamlines for the test case 2 (standoff distance 0 mm), and (d) instantaneous streamlines for the test case 3 (standoff distance 20 mm).

Figure 2.
(a) Experimental setup; (b) Electrical characterization.

Figure 3.
Detailed description of numerical methodology.

Figure 4.
Voltage V(t) and current I(t) characteristics at different percentage of applied voltage and standoff distances.
Figure 4.
Voltage V(t) and current I(t) characteristics at different percentage of applied voltage and standoff distances.

Figure 5.
Temporal evolution of experimental EN of Test 2.

Figure 6.
Comparative analysis of smoke flow visualizations at different percentage of amplitudes and fixed standoff distance 0 mm.
Figure 6.
Comparative analysis of smoke flow visualizations at different percentage of amplitudes and fixed standoff distance 0 mm.

Figure 7.
Comparative analysis of smoke flow visualizations at different standoff distances 0 mm, 20 mm, and 40 mm at fixed percentage of amplitude.
Figure 7.
Comparative analysis of smoke flow visualizations at different standoff distances 0 mm, 20 mm, and 40 mm at fixed percentage of amplitude.

Figure 8.
Comparative characterization of relative energy of first 10 modes at different voltage amplitudes and standoff distances.
Figure 8.
Comparative characterization of relative energy of first 10 modes at different voltage amplitudes and standoff distances.

Figure 9.
POD analysis of first three modes at different voltage amplitudes and fixed standoff distance of 0 mm.
Figure 9.
POD analysis of first three modes at different voltage amplitudes and fixed standoff distance of 0 mm.

Figure 10.
POD analysis of first three modes at different standoff distances of 0 mm, 20 mm, and 40 mm, and fixed voltage amplitude.
Figure 10.
POD analysis of first three modes at different standoff distances of 0 mm, 20 mm, and 40 mm, and fixed voltage amplitude.

Figure 11.
Neutral radicals produced due to plasma actuation at three different inlet pressures.

Figure 12.
Comparative behavior of ignition characteristics of clean case (without plasma effect, black line) with plasma actuation (red dashed line) at low pressure conditions (a) 1 bar, (b) 0.6 bar, (c) 0.4 bar considering constant inlet temperature 1400 K, EN 200 Td, and stoichiometric conditions.

Figure 13.
Maximum molar fraction of OH concentration achieved at certain period of time (a) different inlet pressures during the plasma discharge; (b) with or without the plasma discharge at 1 bar.
Figure 13.
Maximum molar fraction of OH concentration achieved at certain period of time (a) different inlet pressures during the plasma discharge; (b) with or without the plasma discharge at 1 bar.

Figure 14.
Comparative anlaysis of ignition delay time in presence of PAI at different inlet temperatures from 1000 K to 1300 K at constant low pressure (a) 0.4 bar (b) 0.6 bar.
Figure 14.
Comparative anlaysis of ignition delay time in presence of PAI at different inlet temperatures from 1000 K to 1300 K at constant low pressure (a) 0.4 bar (b) 0.6 bar.

Figure 15.
Parametric study of ignition delay time at low inlet temperatures at fixed inlet pressure 0.4 and 0.6 bar in presence of PAI.
Figure 15.
Parametric study of ignition delay time at low inlet temperatures at fixed inlet pressure 0.4 and 0.6 bar in presence of PAI.


Table 1.
Plasma actuated experimental conditions.
| Test Case No. | Actuator Configuration | Actuation Conditions | Standoff Distance (mm) | |||
|---|---|---|---|---|---|---|
| High-Voltage | Ground | Generator | Amplitude (% Vmax) | Frequency (% Fmax) | ||
| 1. | Disk | Needle | Nanopulsed Generator | 20% | 30% | 00 |
| 2. | 40% | 30% | 00 | |||
| 3. | 40% | 30% | 20 | |||
| 4. | 40% | 30% | 40 | |||
Table 2.
Electrical output of plasma actuated test cases.
| Test Case No. | Voltage Peak (V) | Repetition Rate (Hz) | Pulse Electrical Power (W) | Mean Electrical Power (W) | Uncertainty Pulse Electrical Power (W) |
|---|---|---|---|---|---|
| 1. | 14,152.01 | 813.6697 | 644.4663 | 1.2581 | 70 |
| 2. | 16,795.8 | 755.287 | 660.782 | 1.1974 | 70 |
| 3. | 166.6829 | 1196.602 | 4.2125 | 0.0121 | 0.4 |
| 4. | 189.9815 | 1059.098 | 6.2117 | 0.0158 | 0.5 |
Table 3.
Production of active radicals during the pulse discharge.
| Pressure | H | O | OH | CH | CH3 | O3 |
|---|---|---|---|---|---|---|
| 1 bar | 0.02581 | 0.0671 | 0.001818 | 0.000175622 | 0.03046 | 0.05062 |
| 0.6 bar | 0.000558261 | 0.00203 | 0.000944928 | 4.912 × 10⁻⁶ | 0.00146 | 0.00151 |
| 0.4 bar | 2.96967 × 10⁻⁵ | 0.000108 | 6.22008 × 10⁻⁵ | 2.5848 × 10⁻⁷ | 8.967 × 10⁻⁵ | 6.6069 × 10⁻⁵ |
Publisher’s Note: MDPI stays neutral with regard to jurisdictional claims in published maps and institutional affiliations. |
© 2022 by the authors. Licensee MDPI, Basel, Switzerland. This article is an open access article distributed under the terms and conditions of the Creative Commons Attribution (CC BY) license (https://creativecommons.org/licenses/by/4.0/).
Share and Cite
MDPI and ACS Style
Mehdi, G.; Bonuso, S.; De Giorgi, M.G. Plasma Assisted Re-Ignition of Aeroengines under High Altitude Conditions. Aerospace 2022, 9, 66. https://doi.org/10.3390/aerospace9020066
AMA Style
Mehdi G, Bonuso S, De Giorgi MG. Plasma Assisted Re-Ignition of Aeroengines under High Altitude Conditions. Aerospace. 2022; 9(2):66. https://doi.org/10.3390/aerospace9020066
Chicago/Turabian StyleMehdi, Ghazanfar, Sara Bonuso, and Maria Grazia De Giorgi. 2022. "Plasma Assisted Re-Ignition of Aeroengines under High Altitude Conditions" Aerospace 9, no. 2: 66. https://doi.org/10.3390/aerospace9020066
Note that from the first issue of 2016, this journal uses article numbers instead of page numbers. See further details here.