
Structural Design of a Large-Scale 3D-Printed High-Altitude Propeller: Methodology and Experimental Validation

1
Department of Mechanical Engineering, Royal Military Academy, Avenue de la Renaissance 30, 1000 Brussels, Belgium
2
Department of Engineering Technology, Faculty of Engineering, Vrije Universiteit Brussel, Pleinlaan 2, 1050 Brussels, Belgium
3
Brussels Institute for Thermal-Fluid Systems and Clean Energy, Vrije Universiteit Brussel and Université Libre de Bruxelles, 1050 Brussels, Belgium
*
Author to whom correspondence should be addressed.
Aerospace 2023, 10(3), 256; https://doi.org/10.3390/aerospace10030256
Submission received: 25 December 2022
/
Revised: 13 February 2023
/
Accepted: 1 March 2023
/
Published: 7 March 2023
Abstract
:This paper presents an original approach to the structural design and analysis of a 3D-printed thermoplastic-core propeller blade for high-altitude UAVs. A macroscale linear isotropic numerical model for the behavior of 3D-printed parts (in Tough PLA, as well as ABS) is fed with values from tensile and bending testing on standard specimens (ISO 527-2/1A and ASTM D5023) before validation by experiments on a representative scaled substitute blade and blade root. The influence of printing parameters, such as material, layer thickness, and raster orientation, is also addressed, as well as variability between prints. To conclude on the validity of the present methodology for complex shapes, a validation of the numerical results with experiments was performed on a scaled 3D-printed twisted blade. The presented macroscale approach to 3D-printed materials was able to predict tensile and bending deformation with good accuracy compared to previously published micro- or meso-scale approaches since it is built from systematic tensile and bending testing on standard specimens to representative blade assemblies. It provides a reliable digital twin for the early design stages of 3D-printed propeller blades. As a proof-of-concept, the validated methodology was then used to design and numerically analyze a large-scale blade using steady one-way Fluid-Structure Interaction in take-off and cruise conditions. The computed stress levels in the blade structure were within safe margins, thereby proving the feasibility of the 3D printing of full-scale propeller blades for high-altitude platforms.
1. Introduction, Objectives, and State of the Art
In recent times, especially with the need to deliver satellite-like services at lower cost and with effortless deployment, High-Altitude Pseudo Satellites (HAPSs) have garnered much attention in various military and civilian fields. These unmanned vehicles, operating in the stratosphere, can be used for internet services, telecommunications, earth observation, and environmental monitoring [1]. The maneuverability and semi-persistence of HAPS make them flexible and offer the possibility to swiftly change their mission by switching the payload.
The use of a propeller as the propulsive element is widely preferred in such applications, due to the efficiency and the long endurance requirements. The high altitude conditions induce new challenges for propellers as the low air density reduces the Reynolds number, while the low temperature increases the Mach number. This regime is accompanied by lower engine power absorption and increased risk of flutter [2].
The structural aspect is one of the most important aspects in the design of propellers, including static as well as dynamic loads, modal analysis, vibrations, and fatigue. These types of analyses are highly dependent on the material characteristics and the process by which the propeller blades are manufactured. Generally, the propeller blades are made out of wood, metal, or composite materials. A propeller blade can be considered a rotating cantilever beam subjected to steady and vibratory loads. In this work, only the steady loads were considered, which are composed of centrifugal loads due to rotation and aerodynamic loads that can be divided into thrust and torque. The centrifugal force results in tension along the blade span and it is generally dominant in terms of stresses, while the thrust and torque result in bending and are generally dominant in terms of deformation. The blade structure should withstand all the loads and the generated deformations should be calculated with accuracy to identify the effect of these deformations on the propeller’s aerodynamic performance. The present work studies a proof-of-concept high-altitude propeller blade using the 3D printing technique and investigates the numerical modeling of the 3D-printed materials, and their experimental validation, to numerically analyze the blade structure and ensure reliable stress and deformation prediction.
Additive Manufacturing (AM), or three-dimensional (3D) printing, is a relatively new manufacturing technique, which is currently gaining popularity. This technology has become widely used for parts manufacturing from a wide range of materials, such as plastics, metal powder, and ceramics [3,4]. AM enables the production of complex and lightweight parts, saving time and money spent on the tooling process, and reduces material waste. These advantages have enabled it to gradually gain popularity in different industrial sectors. The principle of this technology is based on slicing a part into layers and building it by depositing the printing material layer by layer using different methods, such as Stereolithography (SLA), Digital Light Processing (DLP), Selective Laser Sintering (SLS), Selective Laser Melting (SLM), Fused Deposition Modeling (FDM). FDM consists of building parts by depositing partially melted thermoplastic filaments, extruded through a nozzle that follow a specific path determined by the slicing software to fill a specific area surrounded by contours for each layer. FDM presents a considerable number of printing parameters that affect the part quality and performance, such as raster orientation, layer thickness, part build orientation, air gap, and infill patterns [5,6,7,8], which implies that the selection of the building strategy has a significant effect on the behavior, and the properties, of the printed parts. This sensitivity of the properties to the building strategy leads to difficulties in the modeling and simulations.
1.1. Objectives
The objective of the present work was to characterize 3D-printed materials through elementary tensile and bending tests on standard samples, and to use the experimental results to numerically model the materials in order to simulate more complex 3D-printed parts, such as a substitute blade (i.e., a segment of a non-twisted blade without root), a blade root (i.e., a segment of a blade with root), and a twisted blade using ANSYS Mechanical. The present approach utilizes a simple macroscopic model of 3D-printed parts to numerically predict the blade stress and deformation. We obviate the need for complex micro- or meso-scale models by deliberately choosing printing parameters that reduce the degree of anisotropy (bidirectional raster orientation 45°/−45°, 100% infill density, no reinforcement). Unlike [8,9,10,11,12], here, we develop a simple macro-scale linear isotropic model, after choosing an appropriate set of printing parameters, and prove its suitability as a proof-of-concept for the design of a large-scale propeller blade. To validate the methodology, experimental and numerical tests were conducted on these complex 3D-printed parts. The work is part of a larger project aiming to complete the design process of a large-scale propeller blade (radius ranging from 0.9 m to 1.7 m), intended for HAPS, by using Fused Deposition Modeling. The 3D printing techniques have successfully been used to produce small-scale propellers for Small Unmanned Aerial Vehicles (SUAVs) [13,14,15,16]. Large-scale 3D printing is slowly coming to the fore as a cost-effective solution for manufacturing large parts and components. However, the nature of AM plastic structures brings new challenges in terms of material characterization, as well as in-service stresses and deformations. The final objective of the paper was to use the validated 3D-printed material models in order to perform blade preliminary stress analysis under static loading. Aerodynamic and centrifugal forces are investigated to ensure the mechanical strength and the structural integrity of the blade by using the Finite Element Method (FEM), in order to establish the feasibility of 3D-printed large propeller blades.
For this purpose, 3D-printed tensile and bending test samples were made and tested in order to determine the behavior and mechanical properties of AM materials. Tough PolyLactic Acid (Tough PLA) and Acrylonitrile Butadiene Styrene (ABS) were used as materials for the FDM process. These experiments were numerically matched with FEM in order to find the proper material behavior for AM-made parts. After that, the obtained models could be used to carry out finite element analysis of 3D-printed blades and validate them experimentally. Propeller blades are typically subjected to high centrifugal loads, resulting in predominantly tensile loading, although the generation of thrust yields the dominant bending deformation. Generally, thermoplastics do not have high mechanical strength, so the propeller blade cannot withstand high loads. To deal with this issue, the blade should be designed to operate at low rotational velocity to reduce the centrifugal loads, since these depend on the square of the rotational velocity. The blade’s internal topology can also be optimized to reduce weight, and, thus, reducing centrifugal loads. The final design, produced from an aerodynamic optimization process [17], was used to perform stress analysis under high altitude conditions using a steady one-way Fluid-Structure Interaction (FSI) calculation.
1.2. State of the Art
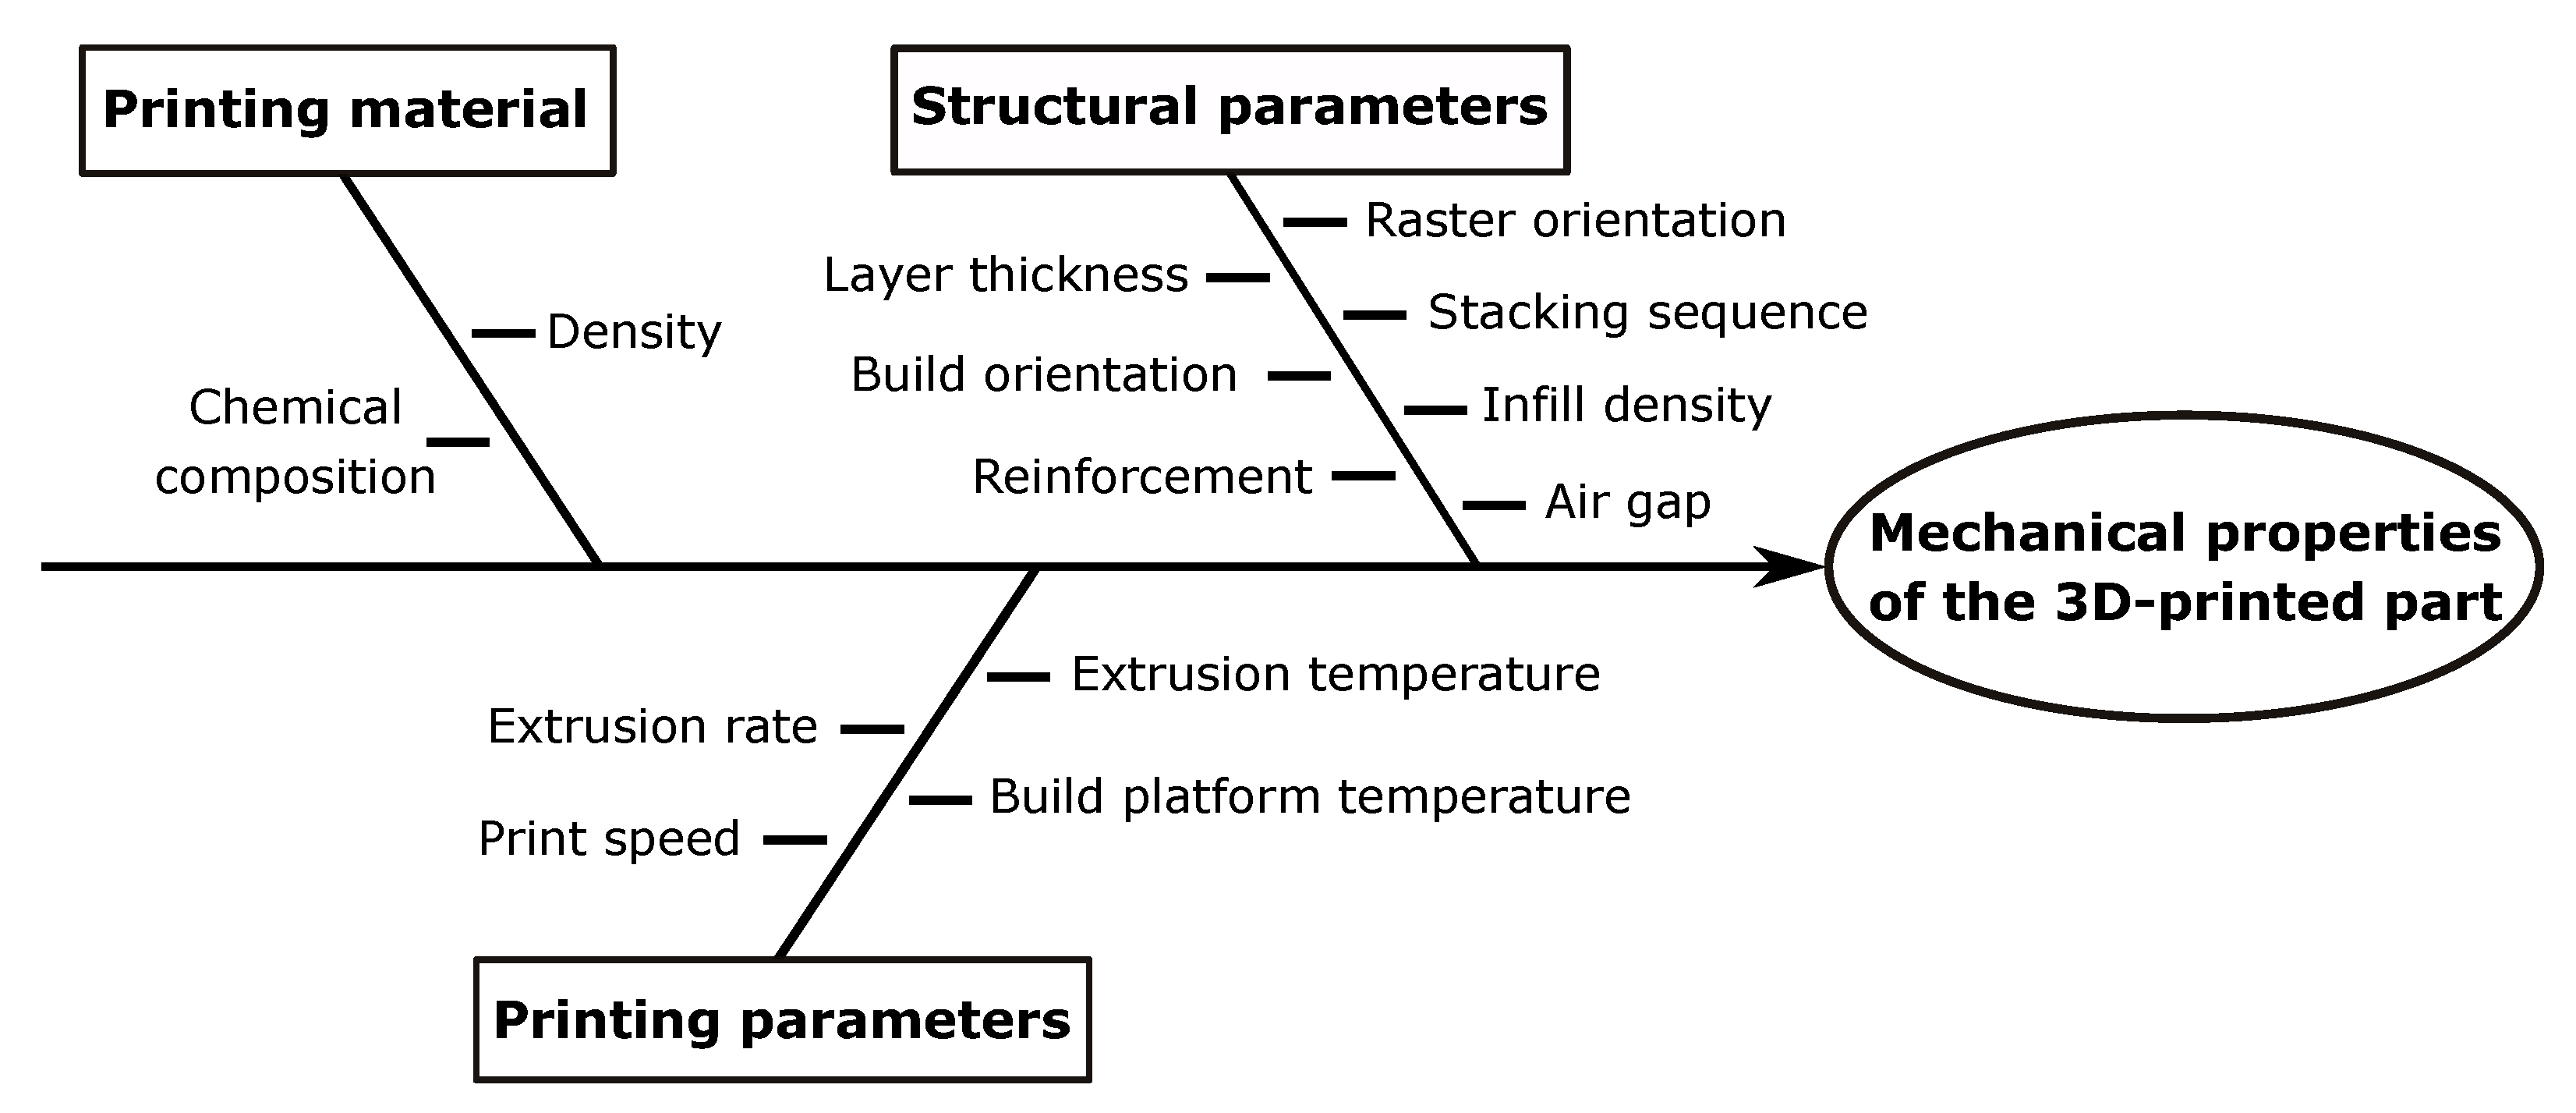
In order to determine the behavior of AM materials, a list of parameters influencing their properties is established. The fishbone diagram in Figure 1 shows the classification of these parameters. Different searches were performed to study the effect of these parameters on the properties and the behavior of the printed parts under various loading and solicitations. Tensile strength and stiffness were investigated [18,19,20,21,22], as were compressive strength [23,24,25,26], flexural behavior [5,6,27,28], and torsion [29,30,31].
Chacón et al. [7] studied the effect of process parameters on the mechanical properties of continuous fiber-reinforced thermoplastic composites (CFRTPCs). They presented a comprehensive tensile and flexural (three-point bending) characterization of two (02) types of unidirectional printed specimens: unreinforced and continuous reinforced nylon specimens. For the unreinforced nylon specimens, the layer thickness showed significant variations in maximum tensile and flexural strength and stiffness. For the reinforced nylon specimens, the flat build orientation showed higher mechanical strength than the on-edge build orientation for the three (03) fiber reinforcements and for both tensile and flexural loading.
In the same context, Penumakala et al. [32] presented a critical review of FDM composites. They expanded the set of reinforced thermoplastics by showing the effect of different combinations of thermoplastics with different reinforcement types on mechanical properties. The enhanced and affected properties, due to reinforcement, were shown for each combination.
Baikerikar [9] compared the experimental tensile stress–strain curves of ABS additive manufactured dogbone samples with as-built finite element (FEA) simulations. A set of different infill patterns was chosen to print the samples for the tensile tests, and four (04) material models were used to carry out the FEA simulations: isotropic model from the bulk ABS properties, isotropic model derived from the tensile experiment of the completely continuous sample (100% infill density), orthotropic model derived from the tensile experiments of the completely continuous samples (100% infill density) printed on three (03) build orientation X, Y, and Z, and composite lamina model dividing the part into stacked plies or laminae to form a composite. The orthotropic FEA model, applied on as-built dogbone specimens with different infill patterns, provided better results than the composite model and the two (02) other isotropic models. The comparison of the experimental and numerical stress–strain curves revealed an over-prediction (up to +75%) in the case of the bulk material isotropic model, an under-prediction (up to −50%) in the case of the experimentally-derived isotropic model, and a good matching in the case of the orthotropic model for the continuous specimens (error < 2%), but the discrepancies were up to 30% for complex infill patterns.
Three (03) different approaches for the mechanical characterization of FDM materials were presented by Cuan-Urquizo et al. [10], as well as some reviewed works related to each approach. The experimental approaches included static loading response (tensile, compression, bending, and torsion), dynamic loading response, and failure under cyclic loading (fatigue), where the effect of manufacturing and structural parameters on mechanical properties is reported in each type of loading. The theoretical approach (analytical and semi-analytical) includes Laminate Plate Theory (Classical Laminate Theory CLT combined with experimental tests) and a micro-mechanics method, which is based on repeating unit cells. The computational approach, based on FEA, includes two (02) types of models: Finite Element Homogenized Models (FEHMs), where the macro-scale material properties are considered and the extruded filaments (rasters) are not modeled explicitly, and Finite Element Microstructure Models (FEMMs), that explicitly represent the extruded filaments, using different FE models, such as Representative Volume Element (RVE), that represents a unit cell, and 1D finite beam elements. These models are adapted in order to represent the gaps, the overlapping, and the bonding between layers and filaments well.
Nelson et al. [11] proposed a generalization of mathematical models to empirically calculate the Yield Stress YS and the tensile modulus E of unidirectional 3D-printed tensile samples. The samples were printed with three (03) different materials (PC, ABSi, and nylon), and in different raster angles between 0° and 90°, incremented by 15° to get insight into the impact of anisotropy on mechanical properties. PC and ABSi showed brittle behavior while the nylon displayed ductile behavior. As general trends, YS was minimum at a raster angle of 75° and maximum at 0° (except for nylon where the maximum was at 15°), whereas E was minimum at 90° (except for nylon where the minimum was at 75°) and maximum at 0°. As the raster angle changed from 0° to 90°, YS decreased by 39%, 60%, and 20% and E decreased by 24%, 34%, and 10% for PC, ABSi, and nylon, respectively. In the end, YS and E were approximated by sinusoidal and exponential models, whose constants only needed the tests of 0° and 75° to be determined. These empirical expressions were then used to determine the E and YS of different polymer materials with minimal testing.
Ahn et al. [33] established a list of five (05) parameters influencing the mechanical properties of FDM ABS P400 parts. The tensile strength values were measured and compared to the ABS P400 injection molded material. The parameters are: air gap, layer thickness, extrusion temperature, ABS color, and raster orientation. The tensile results showed that the raster orientation and the air gap had the most significant effects, which showed the anisotropy of the FDM parts, especially the unidirectional printed parts.
Cesar et al. [29] analyzed the torsion behavior of FDM specimens printed with ABS-M30, considering the raster angle and the build orientation as parameters and ultimate shear strength, 0.2% yield strength, shear modulus, and fracture strain as measured properties, which were then compared to the properties of the injection-molded ABS-M30. The results indicated that the FDM technique can produce parts with similar elastic behavior in torsion to that of injection molding, but with less ductility.
Constitutive orthotropic models were established by Dmingo-Espin et al. [8], describing the linear elastic behavior of FDM parts, the independent constants of which are obtained by tensile tests on samples printed with Polycarbonate (PC) in different build and raster orientations. These models were then used to simulate L-shaped cantilever parts using FEA analysis to compare with experimental tests. The L-shaped parts were printed with Polycarbonate (PC) in different build and raster orientations and designed to undergo a complex stress state during the tests. An isotropic model, obtained by averaging the independent constants of the considered orthotropic models, was also used for comparison. The results revealed overall differences of and for the orthotropic and the isotropic models, respectively, when compared to experiments.
Somireddy and Czekanski [12] established a relationship between meso-structure and macro-mechanical properties of FDM parts. The meso-structures of unidirectional tensile specimens, printed in three (03) different raster orientations, were replicated in FEA by explicitly modeling the deposited filaments, whose bulk material ABS-P400 properties were assigned. The FDM part is considered as a laminated structure and each layer is considered as a lamina which is treated as an orthotropic material. The elastic moduli of a lamina are calculated using the strain energy obtained by FEA. The strain energy has a direct relationship with the stress and strain tensors which directly leads to calculating the elastic moduli of the lamina. The Classical Laminate Theory (CLT), which is dedicated to laminate structures and needs the lamina’s elastic moduli as inputs, was used to characterize the macro-mechanical behavior of FDM parts. After that, CLT was used to calculate the E moduli of a set of four (04) tensile samples printed in different stacking sequences, giving a good agreement compared to experimental E moduli, with differences between 1.25% and 4.26%.
Many different models have been proposed; from relatively simple macroscopic models, that suffice to describe the mechanical properties [8,9,10,11], to more complex mesoscale and microscopic models [10,12] that are required to describe the micro-mechanical characteristics of the individual lamina. In this article, we deliberately chose printing parameters (as described in Section 2.1) that reduce the anisotropy of the 3D-printed parts and allow simpler models, limited to the macroscopic level, to be used. These models were validated experimentally on 3D-printed blades and used, after that, as a proof-of-concept, to numerically analyze the structure of a large-scale propeller blade.
So, the present work uses a macro-scale approach, feeding experimental tensile and bending tests, carried out on 3D-printed standard samples, into the numerical modeling of Tough PLA and ABS 3D-printed materials. These numerical models were then validated using experimental tensile and bending tests on representative 3D-printed blades, produced with the same set of printing parameters. The validation was conducted by comparing the experimental results with those from a numerical simulation. After the validation, the numerical models of 3D-printed Tough PLA and ABS were used to simulate the operation of a large-scale propeller blade under centrifugal and aerodynamic loads.
2. Methodology
As shown in the flowchart of Figure 2, in order to model the 3D-printed materials, experimental tensile and three-point bending tests were performed on 3D-printed standard samples. The samples were printed with different parameters, as shown in Table 1. Each set of parameters was used to print 5 identical samples, in order to establish repeatability and to obtain reliable averages. Finally, the stress–strain curves were obtained by averaging the five (05) experimental curves. These tests were reproduced numerically on standard samples using ANSYS Mechanical in order to identify and validate the material models. After that, the selected material models were used to simulate the substitute blade, the twisted blade, and the blade root. Finally, experimental tensile and bending tests were performed on the 3D-printed substitute blade, twisted blade, and blade root to assess the validity of the numerical method with the selected stress–strain relationship.
Once the numerical approach was validated on different 3D-printed parts, it was used to design and analyze full blades and compute the stresses and displacements in operating conditions, considering centrifugal and aerodynamic loads.
2.1. Printing Process
Table 1 shows the chosen printing parameters that result from the discussion below. The printing process is carried out using an Ultimaker S5 printer, which is an FDM printer that can print in a 330 × 240 × 300 mm build volume.
Build and raster orientations are defined according to the axis system, shown in Figure 3. The choice of the printing parameters is based on a synthesis of the aforementioned research, as follows:
- It is known that the propeller blade undergoes a complex loading (tensile, bending, torsion), due to centrifugal and aerodynamic forces and moments, so the bidirectional raster orientation was chosen (criss-cross −45/45° and cross 0/90°) in which the rasters are alternatively oriented to −45° and 45° (or 0° and 90°) from layer to layer, instead of the unidirectional raster orientation. Bidirectional rasters allow advantage to be taken of the filament resistance in two (02) different orientations of the same 3D-printed part (X and Y orientations in case of flat build orientation), which directly leads to reducing its anisotropy and makes it transversally isotropic, whereas the unidirectional rasters give maximum strength and stiffness in the longitudinal direction, but, respectively, 60% and 34% lower in the transverse direction for ABSi [11], which directly leads to increasing its anisotropy. Furthermore, it can be observed from [29] that the criss-cross configuration (−45/45°) of ABS-M30 gives the highest shear modulus values associated with the smallest 95% confidence intervals, compared to the other unidirectional configurations (0°, 45°, and 90°) and to the injection-molded specimen, in different build orientation of the specimens (XYZ, XZY, YXZ, and ZXY). A higher shear modulus ensures lower blade distortion under aerodynamic and centrifugal twisting moments.
- The infill density was chosen to be solid infill (100%) for all standard samples, substitute blades, blade roots, and twisted blades in the present investigation (full cross-section) so as to keep the same patterns between the tested samples that provide the material models, and the designed blades on which the obtained material models are applied. Should weight-saving measures be applied at a later stage, such as a hollow blade structure with spars potentially through an optimization process, these would be printed with 100% infill density as well. Thereby the present methodology would still be valid. In addition, Refs. [8,9,10] showed that using 100% infill density reduces the degree of anisotropy in the elastic properties of the FDM parts, leading to the adoption of the Finite Element Homogenized Model (FEHM), which only considers the macro-scale material properties to assess the FDM parts’ stresses and deformations, without the need to explicitly model the extruded filaments.
- Positive air gap results in less resistant parts due to the voids between deposited filaments, which eliminate bonding and adhesion between the filaments of the same layer. Negative air gap is not recommended for relatively thick parts [33] because of the degradation of the surface quality and the dimensional tolerances, as well as the excess material build-up on the extrusion nozzle and the printed component itself. From the aforementioned, zero air gap was chosen in the present work to have simple adhesion between deposited filaments.
- The printing temperature and the build plate temperature, for Tough PLA and ABS, were chosen based on the recommendations of the Ultimaker S5 printer manufacturer [34].
- With respect to the possibility of embedded reinforcements during the printing process, the present work considered unreinforced printed parts, due to the difficulty of keeping the proportionality between the test samples and the printed blades in terms of the number and position of reinforcement layers, and, hence, the impossibility of applying the obtained models on other shapes. This implies that the observed safety margins of the final design are the lower threshold of what could be achieved in a full-scale industrial process.
Figure 3.
Build and raster orientations.

2.2. Tensile and Bending Tests
Different tensile and bending samples were printed, according to the parameters described in Table 1. The tests were conducted using a Zwick–Roell BZ1-MM100M1.UT07 universal testing machine. The 5 kN force cell was used for the tests with a contact extensometer (clip-on) type MFA2 (gauge length L0 = 30 mm) to measure the tensile displacement with a precision that depended on the measured displacement, ranging from 5% for 0.01 mm to 0.15% for 2 mm, while the bending displacement was measured using the machine crossbar. Table 2 describes the parameters used to conduct the tensile and bending tests.
3. Characterization—Experimental and Numerical Tests on 3D-Printed Standard Samples
3.1. Tensile Tests
Each stress–strain tensile curve was obtained from an average of five (05) tests. Figure 4 shows the averaged stress–strain tensile curves of Tough PLA and ABS for flat criss-cross −45/45° raster orientation and layer thickness 0.2 mm, as well as their 99% Confidence Interval (CI). Since the number of samples was five (05) (<30), the student’s t-distribution was used to calculate the confidence interval, based on the Standard Error of the Mean (SEM). In this case, the 99% CI equals the SEM multiplied by a coefficient (t-factor) that depends on the number of samples. For five (05) samples, the t-factor is 4.604. The confidence interval was plotted above and below the averaged curves (2-sided CI). As Figure 4 reveals, the deviation between the tensile tests was small, especially in the linear region. The tensile tests showed that the two (02) materials, ABS and Tough PLA, have linear behavior; they behave like a brittle material where the majority of the stress–strain curve is linear, as shown in Figure 5.
The tests also showed that both materials had almost the same behavior when printed in different orientations and with different layer thicknesses, where the samples printed in flat criss-cross −45/45° raster orientation showed better tensile stiffness and ultimate strength for Tough PLA, and better ultimate strength for ABS, while the layer thickness had a negligible effect, but the print time was doubled when using layer thickness 0.1 mm instead of 0.2 mm. The vertical printed samples exhibited the same slope (i.e., the same tensile stiffness) but with an ultimate strength (breaking point) that was 20% and 46% lower than the flat criss-cross −45/45° samples for Tough PLA and ABS, respectively.
Table 3 shows the tensile results of both Tough PLA and ABS for criss-cross −45/45° raster orientation and layer thickness H = 0.2 mm. In this case, Tough PLA and ABS can be modeled by a transversely isotropic model which is a special case of the orthotropic model. Transversely isotropic materials present the same properties in a given plane (XY plane in this case) and different properties in a direction normal to this plane (Z). Since the tensile stiffness (E modulus) is the same in the three (03) directions for each 3D-printed material and the difference is just in the ultimate strength, according to the macro-scale approach we propose modeling both materials with linear isotropic models to simulate their elastic behavior using FEA, taking into account the constraint of the low ultimate strength in the Z direction.
Figure 6 shows the experimental and numerical force–displacement tensile curves of Tough PLA and ABS obtained on standard samples with the properties of Table 3. The numerical curve represents the linear approximation of the experimental curve, since the linear isotropic model is considered in further simulations. The tensile tests are repeatable with maximum departure from the averaged experimental data in the working domain (the linear region) of 2.4% and 3.2% for Tough PLA and ABS, respectively, which is important from an industrial perspective.
3.2. Bending Tests
Each force–displacement bending curve was obtained from an average of five (05) tests. Figure 7 shows the averaged force–displacement bending curves of Tough PLA and ABS for flat criss-cross −45/45° raster orientation and layer thickness 0.2 mm, as well as their 99% Confidence Interval (CI), which was calculated using the same method used for tensile tests (Section 3.1). The bending tests on the materials printed with different parameters, shown in Figure 8, revealed a larger influence of the raster orientation than on the tensile tests. The layer thickness played a secondary role. Since the tensile load on the blade, due to centrifugal forces, was the dominant load case, the flat criss-cross −45/45° raster orientation and the 0.2 mm printing layer thickness were chosen to be considered in this study because of their tensile strength and print time. This combination, which was modeled with linear isotropic models derived from tensile tests, was used to compare the numerical and experimental three-point bending results for both materials, as shown in Figure 9. The numerical bending results matched precisely the experimental ones in the linear region of the bending curves for both 3D-printed materials. In other words, the use of the linear isotropic model for 3D-printed Tough PLA and ABS, with material properties calibrated from tensile tests, provided accurate numerical results for another solicitation (bending), which is the second most important load case for the propeller blade, since the blade undergoes bending due to the generated thrust and torque. The bending tests were repeatable with maximum departure from the averaged experimental data in the linear region of 0.9% and 4.2% for Tough PLA and ABS, respectively.
4. Results on Substitute Blade, Blade Root, and Twisted Blade
After obtaining the behavior of the two materials (see Table 3), the material models were applied to numerically analyze other 3D-printed shapes (substitute blade, blade root, and twisted blade) in tensile and bending, and to compare the numerical results with the experimental ones for validation. These blades were printed with flat criss-cross raster orientation = −45/45° and layer thickness H = 0.2 mm, which were chosen for the rest of the study. The properties of the FEA mesh used for each numerical simulation are described in Table A1.
Table 4 shows the geometrical information of the substitute blade, the blade root, and the twisted blade.
4.1. Experimental and Numerical Tests on 3D-Printed Substitute Blade
4.1.1. Tensile Test
Figure 10 shows the tensile setup of the substitute blade. Figure 11 shows the experimental and numerical force–displacement tensile curves of the 3D-printed substitute blade for both Tough PLA and ABS. The tensile substitute blade features holes at both ends in order to clamp the blade onto the test bench, as shown in Figure 10. Two displacement measurements were taken: a total displacement, using the machine crossbar, and a local displacement, measured in the middle of the blade close to the leading edge side, using a contact extensometer (clip-on) type MFA2 with gauge length L0 = 30 mm, as sketched in Figure 11a. From Figure 11b,c, it can be seen that the numerical results had good agreement with the experimental results for the global, as well as the local, displacement for both materials. At maximum tensile force (7 kN), the differences for the Tough PLA substitute blade were within 4% and 6% for the local and global displacements, respectively. Concerning the ABS substitute blade, these differences were 5% and 2%, respectively.
The Young’s modulus of Tough PLA and ABS were calculated again using the tensile results of the full substitute blades. The extensometer local measurement was used to calculate the strain by dividing the local displacement by the gauge length of the contact extensometer (L0 = 30 mm), while the stress was calculated by dividing the applied tensile force by the airfoil section area, which was 717.28 mm2. The upper part of the substitute blade tensile curve (last 20% of the curve points) was used to calculate the Young’s modulus E. The lower part of the curve shows non-linearity because of the local deformations, at the beginning of the test, between the pins and the holes in the blade sides, that are shown in Figure 11a. The obtained Young’s modulus (E) was compared to the one obtained from the tensile tests of standard samples (E), as shown in Table 5, resulting in differences of 2.55% and 3.31%, respectively, for Tough PLA and ABS, which was of the same order as in [12] with Classical Laminate Theory.
4.1.2. Bending Test
Figure 12 and Figure 13 show the experimental and numerical force–displacement bending curves of the 3D-printed substitute blade for both Tough PLA and ABS. The blade was fixed on one side while the other side was free, where the bending force was applied in four (04) different cases: on the pressure side at of the blade span, on the pressure side at the free end ( of the blade span), on the suction side at of the blade span, and on the suction side at the free end ( of the blade span). The bending tests on the 3D-printed substitute blade were reproduced numerically using the parameters described in Table 3. It can be seen from Figure 12 and Figure 13, that the numerical results were in very good agreement with the experimental results for all cases and for both materials, with a maximum deviation of 2.44% for the 25 N force applied on the pressure side of the Tough PLA 3D-printed substitute blade at of the blade span (Figure 12b).
The linear isotropic material models for Tough PLA and ABS predicted the substitute blade deformation under bending force in several cases with acceptable accuracy. The bending force, which can represent the aerodynamic forces generated by the blade, can dominantly affect the blade shape due to deflection, compared to tensile force, which can represent the centrifugal forces.
4.2. Experimental and Numerical Tests on 3D-Printed Blade Root and Twisted Blade
4.2.1. Tensile on Blade Root
Figure 14 shows the experimental and numerical force–displacement tensile curves of the 3D-printed blade root for both Tough PLA and ABS, with a maximum applied force of 25 kN and 20 kN, resulting in a displacement of 2.54 mm and 2.63 mm, respectively. The blade root contains holes in one side that were used to clamp the blade onto the test bench using pins passing through these holes, while the other side contains a shoulder which was used to hold the blade as a fixed boundary condition. The applied forces were approximately twice the centrifugal forces generated by the entire Tough PLA and ABS blades (radius R = 0.95 m) at 1800 rpm. It can be seen that the numerical and experimental curves had the same slope, with an offset of 0.23 mm and 0.2 mm at the maximum applied force for Tough PLA and ABS, respectively. The difference was due to nonlinear stiffening at low forces. These results proved that the deformation in the radial direction under centrifugal (tensile) forces had a negligible effect on the blade shape.
4.2.2. Bending on Twisted Blade
Figure 15 shows the experimental and numerical force-0displacement bending curves of the 3D-printed twisted blade for both Tough PLA and ABS. During the tests, the blade root was fixed while the other side was free, where the bending force was applied on the pressure side at 75% of the blade span and at the free end (100% of the blade span). The bending tests on the 3D-printed twisted blade were reproduced numerically using the parameters described in Table 3. It can be seen, from Figure 15, that the numerical results were in very good agreement with the experimental results for all cases and for both materials, with a maximum deviation of 3% for the 18 N force applied on the pressure side of the ABS 3D-printed twisted blade at 75% of the blade span (Figure 15c). Given the simplicity of the model (linear isotropic) and of the standard samples used to establish the material characteristics (Table 3), this result was an achievement, in light of the deviations sometimes found in Section 1.2 with more complex models (multi-linear isotropic, orthotropic, classical laminate theory, and as-built FEA simulations) or more complex procedures to establish the characteristics.
The deformation of the Tough PLA and ABS twisted blades under bending force was predicted with acceptable accuracy using the considered linear isotropic material models. Since this force can dominantly affect the blade shape, it is important to predict the deformed shape with accuracy in order to evaluate the real aerodynamic performance of the blade.
5. Proof-Of-Concept of a 3D-Printed High-Altitude Propeller Blade
The validated methodology was used with Tough PLA and ABS (for = −45/45° and H = 0.2 mm) to simulate the structural response of a high-altitude propeller blade under centrifugal and aerodynamic loads. The blade geometry was obtained from an aerodynamic optimization process, which is described in [17], resulting in the geometrical distributions shown in Figure 16a. The propeller contained four (04) blades with a radius R = 1.7 m. Two (02) operating points were considered which were take-off at sea level and cruise at 16 km altitude.
Since the numerical models of the 3D-printed tough PLA and ABS were validated experimentally, they could be used to perform stress analysis and deformation prediction of a 3D-printed blade. During its operation, a propeller blade undergoes two main forces: the centrifugal force, due to the rotation causing the tension, and the aerodynamic force (divided into thrust and torque) causing bending. The stresses and deformations generated by these loads could be calculated numerically with good accuracy based on the linear isotropic models validated in the previous section. A steady one-way FSI was used to analyze the blade structure using FEA in ANSYS Mechanical. Centrifugal forces were generated by rotation with a fixed blade root, while aerodynamic forces were generated by CFD in Star-CCM+ and imported as a pressure field around the blade surface for both operating points and both 3D-printed materials. In order to exploit the periodicity in the propeller operation, a single blade passage was considered with periodic boundary conditions. The 3D CFD domain was a quarter cylinder that contained 1.21 × 10⁷ cells, while the FEA mesh contained 8.28 × 10⁵ elements. The flight direction was + so the generated thrust direction was +, and the blade radial direction was + and it rotated around the Z axis. The operating conditions, which were obtained from the optimization process [17], and the CFD results (thrust, torque, and propulsive efficiency) are shown in Table 6. The blade was considered to be printed in the flat direction (XY plane), as shown in Figure 16b with = −45/45° and H = 0.2 mm.
The results of one-way FSI simulations of take-off and cruise are reported in Table 7, considering, in each case, 3D-printed blades made out of Tough PLA or ABS. They are reported in terms of maximum Von Mises stress S, maximum stress normal to the radial direction S, maximum stress normal to the two other directions S and S, and maximum deformation (displacement) in the three (03) directions D, D, and D. The results of one case (3D-printed Tough PLA blade at Cruise) are shown in Figure 17 for illustration.
The results of one-way FSI are discussed as follows:
- The maximum Von Mises stress was almost equal to the maximum radial direction stress S in take-off and cruise for both materials, which meant that S was dominant compared to the stresses in the two (02) other directions S and S. S resulted from a combination of centrifugal loads due to rotation, and tensile loads (compression loads) on the pressure side (the suction side) due to the bending resulting from aerodynamic loads. This domination explains the choice of the flat direction for the blade printing, which allows having the maximum stresses in the X direction where the ultimate strength is the highest for both materials, as explained in Section 3.1.
- From Figure 5, the limits of the linear regions of the tensile curves were 35 MPa and 29 MPa in the XY plane, 27 MPa and 20 MPa in the vertical direction Z for Tough PLA and ABS, respectively. From Table 7, it can be seen that the stress levels were acceptable with respect to the linear limits in all cases, with safety factors ranging from 2.02 to 13.41 for the take-off, and from 5.36 to 13.62 for the cruise, depending on the normal stress direction and the material.
- The maximum Y and Z displacements occurred at the blade tip in all cases, and they gradually decreased toward the blade root, due to the blade bending under thrust and torque. Y and Z displacements in take-off were almost eleven (11) times greater than those in the cruise regime, because of the required thrust for take-off and the high density of air at sea level compared to an altitude of 16 km. The aerodynamic performance of the blade could be affected by the bending deformation. This deformation could be calculated more accurately using two-way FSI, where the fluid and the structure solvers were coupled. In this case, the bending deformation was expected to be lower due to the increase in bending stiffness under centrifugal forces [35].
6. Conclusions
This paper presents a novel approach for the numerical modeling of 3D-printed materials that was used in the structural design, analysis, and manufacturing of a high-altitude propeller blade. The approach was applied to two (02) 3D-printed materials: Tough PLA and ABS. In the presented macro-scale approach, a linear isotropic model was fed with tensile and bending tests on 3D-printed standard samples. It was then validated on more complex shapes, such as a substitute blade, a blade root, and a twisted blade, using the same set of printing parameters as the standard samples, by comparing the experimental tensile and bending results with those obtained from FEA simulations.
The following conclusions can be drawn:
- Keeping the same set of printing parameters between the experimental characterization (standard samples) and the experimental validation (complex shapes), in order to ensure the same internal structure, allows the use of the numerical models, obtained by characterization, in the simulation of the complex shapes.
- The variability between printed items, especially in the range of interest of the stress–strain curve, is extremely low which makes the technique suited for industrial application.
- In this work, the selected set of printing parameters (bidirectional raster orientation −45/45°, layer thickness H = 0.2 mm, infill density 100%, no reinforcement, zero airgap) resulted in nearly homogenous 3D-printed Tough PLA and ABS samples with tensile properties that were equal in the three directions XYZ. Therefore, the linear isotropic model can be used to model and predict the behavior of complex 3D-printed blades with good accuracy without having recourse to transversally isotropic or orthotropic models. The selection of the set of printing parameters is substantial for the simplification of the 3D-printed material modeling.
- The deformations of the 3D-printed substitute blade, blade root, and twisted blade under tensile and bending loads are numerically predicted using linear isotropic material models, whose Young’s moduli and ultimate strengths are obtained by experimental characterization. The maximum errors in the numerical predictions were within 2.44% and 3% for the bending test on substitute and twisted blades, respectively. For the tensile test on substitute blades, the maximum error was 6%, while the tensile test on the blade root showed the same curve slope with an offset due to nonlinear stiffening at low forces. The accuracies exhibited were at least of the same order of magnitude as those obtained with micro-scale and meso-scale methods, or better.
- The 3D-printed blade structure can withstand different loads during operation with safety factors greater than 2 at take-off and greater than 5 at cruise.
- During the cruise regime at an altitude of 16 km, the centrifugal forces were dominant in terms of stresses, while the aerodynamic forces were dominant in terms of deformations. During the take-off at sea level, the aerodynamic forces contributed significantly and dominantly to the radial stress S due to highly generated thrust and highly resistant torque resulting in the blade bending, causing tension on the pressure side and compression on the suction side. The aerodynamic forces were still dominant in terms of deformations during the take-off.
A large-scale blade for a high-altitude winged platform was analyzed, as a proof-of-concept, using steady one-way Fluid-Structure Interaction in take-off and cruise conditions. We developed and validated a new methodology for the design and manufacture of large-scale blades using FDM. We showed that numerical simulations and experiments were in close agreement, thereby opening the path for future structure–topology optimizations. We proved that such blades can operate safely, withstanding all loads, and provided evidence, through a proof-of-concept for a HAPS blade under operating conditions. The computed stress levels in the blade structure were within safe margins, thereby proving the feasibility of 3D-printing of full-scale propeller blades for such platforms and showing further promise for the established methodology. The present methodology provides a reliable digital twin for the early design stages of 3D-printed propeller blades and topology optimization.
Author Contributions
Conceptualization, A.M., N.M., B.G.M. and T.D.T.; methodology, A.M. and B.G.M.; software, A.M. and N.M.; validation, A.M.; formal analysis, A.M.; investigation, A.M.; data curation, A.M.; writing—original draft preparation, A.M.; writing—review and editing, N.M., B.G.M. and T.D.T.; visualization, A.M.; supervision, B.G.M. and T.D.T.; project administration, B.G.M.; funding acquisition, B.G.M. All authors have read and agreed to the published version of the manuscript.
Funding
This work was funded by the Belgian Royal Higher Institute for Defence for the project Tailored High-Altitude Propeller (THAP) under grant MSP19-08. The APC was funded by the Belgian Royal Higher Institute for Defence.
Institutional Review Board Statement
Not applicable.
Informed Consent Statement
Not applicable.
Data Availability Statement
The data used to support the findings of this study are available from the corresponding author upon request.
Acknowledgments
The authors would like to acknowledge Laurens Willems, Brent Van Sprengel, and Jonathan Paesmans, from the Vrije Universiteit Brussel, for the preparatory work done during their internships, as well as Laurent Evrard and Abdelhak Raji for their support in the experimental campaign.
Conflicts of Interest
The authors declare no conflict of interest.
Nomenclature
| D | Deformation |
| E | Young’s modulus |
| F | Force |
| H | Layer thickness |
| L0 | Gauge length of the extensometer |
| Sn | Normal stress |
| SVM | Von Mises stress |
| Δl | Displacement |
| ɛ | Strain |
| ν | Poisson ratio |
| σ | Stress |
| θ | Raster orientation |
| US | Ultimate Strength |
| ·X | X direction |
| ·Y | Y direction |
| ·Z | Z direction |
Appendix A

Table A1.
Mesh properties for the numerical simulations using ANSYS Mechanical.
| Part | Loading | Size (mm) | Curvature (mm) | Type | N° Elements | N° Nodes |
|---|---|---|---|---|---|---|
| Sample | Tensile | 0.8 | – | Tetrahedrons | 169117 | 250971 |
| Sample | Bending | 0.3 | – | Tetrahedrons | 126321 | 189461 |
| Substitute blade | Tensile | 1.5 | 1 | Tetrahedrons | 1007842 | 1549338 |
| Substitute blade | Bending | 1.5 | 1 | Tetrahedrons | 486389 | 751911 |
| Blade root | Tensile | 1.5 | 1 | Tetrahedrons | 1493468 | 2061113 |
| Twisted blade | Bending | 1.5 | 1 | Tetrahedrons | 584149 | 972253 |
References
- Gonzalo, J.; López, D.; Domínguez, D.; García, A.; Escapa, A. On the capabilities and limitations of high altitude pseudo-satellites. Prog. Aerosp. Sci. 2018, 98, 37–56. [Google Scholar] [CrossRef]
- Marinus, B.G.; Mourousias, N.; Malim, A. Exploratory Optimizations of Propeller Blades for a High-Altitude Pseudo-Satellite. In Proceedings of the AIAA Aviation 2020 Forum, AIAA 2020-2798, Virtual Event, 15–19 June 2020. [Google Scholar] [CrossRef]
- Turner, B.N.; Strong, R.; Gold, S.A. A review of melt extrusion additive manufacturing processes: I. Process design and modeling. Rapid Prototyp. J. 2014, 20, 192–204. [Google Scholar] [CrossRef]
- Turner, B.N.; Gold, S.A. A review of melt extrusion additive manufacturing processes: II. Materials, dimensional accuracy, and surface roughness. Rapid Prototyp. J. 2015, 21, 250–261. [Google Scholar] [CrossRef]
- Sood, A.K.; Ohdar, R.K.; Mahapatra, S.S. Parametric appraisal of mechanical property of fused deposition modelling processed parts. Mater. Des. 2010, 31, 287–295. [Google Scholar] [CrossRef]
- Wu, W.; Geng, P.; Li, G.; Zhao, D.; Zhang, H.; Zhao, J. Influence of layer thickness and raster angle on the mechanical properties of 3D-printed PEEK and a comparative mechanical study between PEEK and ABS. Materials 2015, 8, 5834–5846. [Google Scholar] [CrossRef] [PubMed] [Green Version]
- Chacón, J.; Caminero, M.; Núñez, P.; García-Plaza, E.; García-Moreno, I.; Reverte, J. Additive manufacturing of continuous fibre reinforced thermoplastic composites using fused deposition modelling: Effect of process parameters on mechanical properties. Compos. Sci. Technol. 2019, 181, 107688. [Google Scholar] [CrossRef]
- Domingo-Espin, M.; Puigoriol-Forcada, J.M.; Garcia-Granada, A.A.; Llumà, J.; Borros, S.; Reyes, G. Mechanical property characterization and simulation of fused deposition modeling Polycarbonate parts. Mater. Des. 2015, 83, 670–677. [Google Scholar] [CrossRef]
- Baikerikar, P.J.; Turner, C.J. Comparison of as-built FEA simulations and experimental results for additively manufactured dogbone geometries. In Proceedings of the International Design Engineering Technical Conferences and Computers and Information in Engineering Conference. American Society of Mechanical Engineers, Cleveland, OH, USA, 6–9 August 2017; Volume 58110, p. V001T02A021. [Google Scholar] [CrossRef] [Green Version]
- Cuan-Urquizo, E.; Barocio, E.; Tejada-Ortigoza, V.; Pipes, R.B.; Rodriguez, C.A.; Roman-Flores, A. Characterization of the mechanical properties of FFF structures and materials: A review on the experimental, computational and theoretical approaches. Materials 2019, 12, 895. [Google Scholar] [CrossRef] [Green Version]
- Nelson, J.W.; Atkins, D.; Gottstine, M.L.; Yang, J.; Garapic, G.; Jaminion, S.; Nelson, A.; Wilson, K. Generalized models for unidirectional anisotropic properties of 3D printed polymers. Rapid Prototyp. J. 2020, 26, 1453–1462. [Google Scholar] [CrossRef]
- Somireddy, M.; Czekanski, A. Mechanical characterization of additively manufactured parts by FE modeling of mesostructure. J. Manuf. Mater. Process. 2017, 1, 18. [Google Scholar] [CrossRef] [Green Version]
- Toleos Jr, L.R.; Luna, N.J.A.B.D.; Manuel, M.C.E.; Chua, J.M.R.; Sangalang, E.M.A.; So, P.C. Feasibility Study for Fused Deposition Modeling (FDM) 3D-Printed Propellers for Unmanned Aerial Vehicles. Int. J. Mech. Eng. Robot. Res. 2020, 9, 548–558. [Google Scholar] [CrossRef]
- Khaleed, H.; Badruddin, I.A.; Saquib, A.; Addas, M.; Kamangar, S.; Khan, Y. Novel Approach to Manufacture an AUV Propeller by Additive Manufacturing and Error Analysis. Appl. Sci. 2019, 9, 4413. [Google Scholar] [CrossRef] [Green Version]
- Biswasa, P.; Heryudonoa, A.; Lia, J.; Bib, J. Prediction of Printing Failure of a 3D Printed Drone Propeller Using Fused Deposition Modeling; Science in the Age of Experience: Boston, MA, USA, 2018. [Google Scholar]
- Rutkay, B.D. A Process for the Design and Manufacture of Propellers for Small Unmanned Aerial Vehicles. Ph.D. Thesis, Carleton University, Ottawa, ON, Canada, 2014. [Google Scholar]
- Mourousias, N.; Malim, A.; Marinus, B.G.; Runacres, M. Surrogate-Based Optimization of a High-Altitude Propeller. In Proceedings of the AIAA Aviation 2021 Forum, AIAA 2021-2597, Virtual Event, 2–6 August 2021. [Google Scholar] [CrossRef]
- Shojib Hossain, M.; Espalin, D.; Ramos, J.; Perez, M.; Wicker, R. Improved mechanical properties of fused deposition modeling-manufactured parts through build parameter modifications. J. Manuf. Sci. Eng. 2014, 136. [Google Scholar] [CrossRef]
- Croccolo, D.; De Agostinis, M.; Olmi, G. Experimental characterization and analytical modelling of the mechanical behaviour of fused deposition processed parts made of ABS-M30. Comput. Mater. Sci. 2013, 79, 506–518. [Google Scholar] [CrossRef]
- Garg, A.; Bhattacharya, A. An insight to the failure of FDM parts under tensile loading: Finite element analysis and experimental study. Int. J. Mech. Sci. 2017, 120, 225–236. [Google Scholar] [CrossRef]
- Rajpurohit, S.R.; Dave, H.K. Effect of process parameters on tensile strength of FDM printed PLA part. Rapid Prototyp. J. 2018, 24, 1317–1324. [Google Scholar] [CrossRef]
- Gebisa, A.W.; Lemu, H.G. Influence of 3D printing FDM process parameters on tensile property of ULTEM 9085. Procedia Manuf. 2019, 30, 331–338. [Google Scholar] [CrossRef]
- Lee, C.; Kim, S.; Kim, H.; Ahn, S.H. Measurement of anisotropic compressive strength of rapid prototyping parts. J. Mater. Process. Technol. 2007, 187, 627–630. [Google Scholar] [CrossRef]
- Mercado-Colmenero, J.M.; Angel, R.P.M.; la Rubia-Garcia, M.; Lozano-Arjona, D.; Martin-Doñate, C. A numerical and experimental study of the compression uniaxial properties of PLA manufactured with FDM technology based on product specifications. Int. J. Adv. Manuf. Technol. 2019, 103, 1893–1909. [Google Scholar] [CrossRef]
- Abbas, T.; Othman, F.M.; Ali, H.B. Effect of infill Parameter on compression property in FDM Process. Int. J. Eng. Res. Appl. 2017, 7, 16–19. [Google Scholar] [CrossRef]
- Galantucci, L.; Lavecchia, F.; Percoco, G. Study of compression properties of topologically optimized FDM made structured parts. CIRP Ann. 2008, 57, 243–246. [Google Scholar] [CrossRef]
- Bellini, A.; Güçeri, S. Mechanical characterization of parts fabricated using fused deposition modeling. Rapid Prototyp. J. 2003, 9, 252–264. [Google Scholar] [CrossRef]
- Ziemian, C.; Sharma, M.; Ziemian, S. Anisotropic mechanical properties of ABS parts fabricated by fused deposition modelling. Mech. Eng. 2012, 23, 2397. [Google Scholar]
- Balderrama-Armendariz, C.O.; MacDonald, E.; Espalin, D.; Cortes-Saenz, D.; Wicker, R.; Maldonado-Macias, A. Torsion analysis of the anisotropic behavior of FDM technology. Int. J. Adv. Manuf. Technol. 2018, 96, 307–317. [Google Scholar] [CrossRef]
- Berzal, M.; Barajas, C.; del Mazo, D.; Caja, J.; Maresca, P. Simple filling patterns to model mechanical behaviour of FDM’s test pieces under torsion. Procedia Manuf. 2017, 13, 786–793. [Google Scholar] [CrossRef]
- Torres, J.; Cotelo, J.; Karl, J.; Gordon, A.P. Mechanical property optimization of FDM PLA in shear with multiple objectives. JOM 2015, 67, 1183–1193. [Google Scholar] [CrossRef]
- Penumakala, P.K.; Santo, J.; Thomas, A. A critical review on the fused deposition modeling of thermoplastic polymer composites. Compos. Part B Eng. 2020, 201, 108336. [Google Scholar] [CrossRef]
- Ahn, S.H.; Montero, M.; Odell, D.; Roundy, S.; Wright, P.K. Anisotropic material properties of fused deposition modeling ABS. Rapid Prototyp. J. 2002, 8, 248–257. [Google Scholar] [CrossRef] [Green Version]
- Ultimaker Support. 2021. Available online: https://support.ultimaker.com/hc/en-us/categories/360002336619-Materials (accessed on 20 December 2021).
- Chen, J.; Li, Q.S. Vibration characteristics of a rotating pre-twisted composite laminated blade. Compos. Struct. 2019, 208, 78–90. [Google Scholar] [CrossRef]
Figure 1.
Fishbone diagram of factors influencing the mechanical properties of 3D-printed parts.

Figure 2.
Validation strategy for 3D-printed material models.

Figure 4.
Averaged stress–strain tensile curves with their 99% confidence interval for = −45/45°, H = 0.2 mm, and flat orientation.
Figure 4.
Averaged stress–strain tensile curves with their 99% confidence interval for = −45/45°, H = 0.2 mm, and flat orientation.

Figure 5.
Averaged experimental stress–strain tensile curves: (a) Tough PLA. (b) ABS.

Figure 6.
Experimental and numerical force–displacement tensile curves for = −45/45°, H = 0.2 mm, and flat orientation: (a) Tough PLA. (b) ABS.
Figure 6.
Experimental and numerical force–displacement tensile curves for = −45/45°, H = 0.2 mm, and flat orientation: (a) Tough PLA. (b) ABS.

Figure 7.
Averaged force–displacement bending curves with their 99% confidence interval for = −45/45°, H = 0.2 mm, and flat orientation.
Figure 7.
Averaged force–displacement bending curves with their 99% confidence interval for = −45/45°, H = 0.2 mm, and flat orientation.

Figure 8.
Averaged experimental force–displacement bending curves: (a) Tough PLA. (b) ABS.

Figure 9.
Experimental and numerical force–displacement bending curves for = −45/45°, H = 0.2 mm, and flat orientation: (a) Tough PLA. (b) ABS.
Figure 9.
Experimental and numerical force–displacement bending curves for = −45/45°, H = 0.2 mm, and flat orientation: (a) Tough PLA. (b) ABS.

Figure 10.
Tensile test on the substitute blade.

Figure 11.
Experimental and numerical force–displacement tensile curves of the substitute blades for = −45/45° and H = 0.2 mm: (a) Tensile test bench CAD. (b) Tough PLA. (c) ABS.
Figure 11.
Experimental and numerical force–displacement tensile curves of the substitute blades for = −45/45° and H = 0.2 mm: (a) Tensile test bench CAD. (b) Tough PLA. (c) ABS.

Figure 12.
Experimental and numerical force–displacement bending curves of the substitute blade for = −45/45° and H = 0.2 mm (force on the pressure side): (a) Substitute blade CAD. (b) Tough PLA. (c) ABS.
Figure 12.
Experimental and numerical force–displacement bending curves of the substitute blade for = −45/45° and H = 0.2 mm (force on the pressure side): (a) Substitute blade CAD. (b) Tough PLA. (c) ABS.

Figure 13.
Experimental and numerical force–displacement bending curves of the substitute blade for = −45/45° and H = 0.2 mm (force on the suction side): (a) Substitute blade CAD. (b) Tough PLA. (c) ABS.
Figure 13.
Experimental and numerical force–displacement bending curves of the substitute blade for = −45/45° and H = 0.2 mm (force on the suction side): (a) Substitute blade CAD. (b) Tough PLA. (c) ABS.

Figure 14.
Experimental and numerical force–displacement tensile curves of the blade root for = −45/45° and H = 0.2 mm: (a) Tensile test bench CAD. (b) Tough PLA. (c) ABS.
Figure 14.
Experimental and numerical force–displacement tensile curves of the blade root for = −45/45° and H = 0.2 mm: (a) Tensile test bench CAD. (b) Tough PLA. (c) ABS.

Figure 15.
Experimental and numerical force–displacement bending curves of the twisted blade for = −45/45° and H = 0.2 mm (force on pressure side): (a) Scaled twisted blade CAD. (b) Tough PLA. (c) ABS.
Figure 15.
Experimental and numerical force–displacement bending curves of the twisted blade for = −45/45° and H = 0.2 mm (force on pressure side): (a) Scaled twisted blade CAD. (b) Tough PLA. (c) ABS.

Figure 16.
(a) Chord, thickness, sweep angle, and twist angle radial distributions of the optimized blade [17]. (b) Blade build orientation.
Figure 16.
(a) Chord, thickness, sweep angle, and twist angle radial distributions of the optimized blade [17]. (b) Blade build orientation.

Figure 17.
One-way FSI results on Tough PLA blade at cruise: (a) S. (b) S. (c) D.

Table 1.
3D printing parameters.
| Material | Tough PLA | ABS |
|---|---|---|
| Raster orientation (°) | 0/90, −45/45 | 0/90, −45/45 |
| Layer thickness H (mm) | 0.1, 0.2 | 0.1, 0.2 |
| Build orientation | flat, vertical | flat, vertical |
| Printing temperature (°C) | 215 | 250 |
| Build plate temperature (°C) | 60 | 85 |
| Infill density | 100% | 100% |
| Print speed (mm·s) | 145 | 145 |
| Nozzle diameter (mm) | 0.4 | 0.4 |
| Reinforcement | No | No |
| Air gap | Zero | Zero |
| Number of contours | 2 | 2 |
Table 2.
Tensile and bending test parameters.
| Test | Standard | N° of Samples | Speed (mm/min) | Displacement Tool |
|---|---|---|---|---|
| Tensile | ISO 527-2/1A | 5 | 5 | Extensometer |
| Bending | ASTM D5023 | 5 | 2 | Machine crossbar |
Table 3.
Tensile results for = −45/45° and H = 0.2 mm.
| Material | Density (kg/m3) | E (MPa) | US (MPa) | ||||
|---|---|---|---|---|---|---|---|
| Ex | Ey | Ez | USx | USy | USz | ||
| Tough PLA | 1160 | 2617 | 2617 | 2617 | 47 | 47 | 38 |
| ABS | 1084 | 1813 | 1813 | 1813 | 37.5 | 37.5 | 20 |
Table 4.
Substitute blade, blade root, and twisted blade information.
| Blades | Loading | Length (mm) | Airfoil | Chord (mm) |
|---|---|---|---|---|
| Substitute | Tensile | 320 | AG35-il | 105 |
| Substitute | Bending | 320 | AG35-il | 70 |
| Root | Tensile | 320 | NACA16-009 | Distributed |
| Twisted | Bending | 320 | NACA16-009 | Distributed |
Table 5.
Comparison of Young’s moduli.
| Tested Part | Standard Sample | Substitute Blade | |
|---|---|---|---|
| Young Modulus | E (MPa) | ESB (MPa) | Difference (%) |
| Tough PLA | 2617 | 2683.8 | 2.55 |
| ABS | 1813 | 1873.1 | 3.31 |
Table 6.
Operating conditions and CFD results.
| Regime | Altitude (km) | rpm | Flight Velocity (m/s) | Thrust (N) | Torque (N.m) | Efficiency (%) |
|---|---|---|---|---|---|---|
| Take-off | 0 | 493.64 | 25.72 | 626.51 | 441.71 | 70.57 |
| Cruise | 16 | 478.93 | 55.00 | 54.91 | 71.53 | 84.18 |
Table 7.
One-way FSI results.
| Regime | Take-Off | Cruise | ||||||
|---|---|---|---|---|---|---|---|---|
| Tough PLA | SF1 | ABS | SF1 | Tough PLA | SF1 | ABS | SF1 | |
| Max S (MPa) | 14.74 | 2.37 | 14.31 | 2.03 | 5.61 | 6.24 | 5.28 | 5.49 |
| Max S (MPa) | 14.81 | 2.36 | 14.38 | 2.02 | 5.79 | 6.04 | 5.41 | 5.36 |
| Max S (MPa) | 2.61 | 13.41 | 2.48 | 11.70 | 2.57 | 13.62 | 2.45 | 11.84 |
| Max S (MPa) | 2.56 | 10.55 | 2.52 | 7.94 | 3.02 | 8.94 | 2.81 | 7.12 |
| Max D (mm) | 2.63 | – | 3.96 | – | 1.46 | – | 2.01 | – |
| Max D (mm) | 179.83 | – | 265.34 | – | 18.26 | – | 26.17 | – |
| Max D (mm) | 115.19 | – | 166.95 | – | 11.08 | – | 15.96 | – |
SF1: Safety Factor, which was calculated by dividing the actual maximum stress by the corresponding stress limit
(linear region limit).
Disclaimer/Publisher’s Note: The statements, opinions and data contained in all publications are solely those of the individual author(s) and contributor(s) and not of MDPI and/or the editor(s). MDPI and/or the editor(s) disclaim responsibility for any injury to people or property resulting from any ideas, methods, instructions or products referred to in the content. |
© 2023 by the authors. Licensee MDPI, Basel, Switzerland. This article is an open access article distributed under the terms and conditions of the Creative Commons Attribution (CC BY) license (https://creativecommons.org/licenses/by/4.0/).
Share and Cite
MDPI and ACS Style
Malim, A.; Mourousias, N.; Marinus, B.G.; De Troyer, T. Structural Design of a Large-Scale 3D-Printed High-Altitude Propeller: Methodology and Experimental Validation. Aerospace 2023, 10, 256. https://doi.org/10.3390/aerospace10030256
AMA Style
Malim A, Mourousias N, Marinus BG, De Troyer T. Structural Design of a Large-Scale 3D-Printed High-Altitude Propeller: Methodology and Experimental Validation. Aerospace. 2023; 10(3):256. https://doi.org/10.3390/aerospace10030256
Chicago/Turabian StyleMalim, Ahmed, Nikolaos Mourousias, Benoît G. Marinus, and Tim De Troyer. 2023. "Structural Design of a Large-Scale 3D-Printed High-Altitude Propeller: Methodology and Experimental Validation" Aerospace 10, no. 3: 256. https://doi.org/10.3390/aerospace10030256
Note that from the first issue of 2016, this journal uses article numbers instead of page numbers. See further details here.