
Decompression Load Analysis in Large Passenger Planes with Windshield Cracked
by
Wenbin He
1, 
Xi Yang
1,
Ding Luo
1,
Jiang Lei
1,*,
Zhimao Li
2,
Shiquan Lin
2 and
Congxiao Zhang
2 1
State Key Laboratory for Strength and Vibration of Mechanical Structures, Xi’an Jiaotong University, Xi’an 710049, China
2
Shanghai Aircraft Design & Research Institute, Shanghai 200126, China
*
Author to whom correspondence should be addressed.
Aerospace 2022, 9(9), 517; https://doi.org/10.3390/aerospace9090517
Submission received: 26 July 2022
/
Revised: 6 September 2022
/
Accepted: 10 September 2022
/
Published: 16 September 2022
(This article belongs to the Special Issue Aircraft Design (SI-4/2022))
Abstract
:To prevent the possible accident of a large passenger plane due to rapid decompression, transient load analysis is of vital importance in the assessment of structure strength and also an important clause of airworthiness standard. A 0-D isentropic model and a 1-D model based on the characteristic line are developed to simulate the rapid decompression process of the cockpit-cabin model due to a cracked windshield. The accuracy of these models is presented by comparing them with experiments and 3-D CFD simulations. Then, the 1-D model is applied to study the influence of cabin and cockpit volume, windshield and decompression panel area, compartments, and environment pressure on the decompression load. The non-dimensional decompression time and the non-dimensional decompression load are developed to evaluate the decompression characteristics, and the correlation equations are established. The relative deviation between the results of the correlation equation fit and the results of the one-dimensional simulation is less than 3%. This work provides a new engineering method for structure strength design and decompression load analysis with high accuracy and low resource consumption.
1. Introduction
Large passenger planes generally fly at high altitudes to minimize aerodynamic drag and maximize fuel efficiency. Unfortunately, humans cannot withstand prolonged exposure to low atmospheric pressure and low oxygen conditions above 3000 m altitude. Hence, to provide a comfortable environment and satisfy the physiological needs of the crew on board, a continuous supply of air is routed to the cabin, which keeps the cabin under a pressure corresponding to 2500–3000 m altitude [1]. If an opening appears or the pressurization system abruptly fails when the plane is cruising at high altitude, the air in the cabin will suddenly flow out. Then, the inter-compartment pressure imbalance induces the extra decompression load, which is likely to lead to serious accidents. In 2018, an A319 airliner belonging to Sichuan Airlines experienced an accidental windshield crack while cruising. The pressure in the cockpit dropped abruptly, causing instrument damage and copilot injury. The tragedy was avoided by a successful forced landing [2]. Prior to that, a DC-10 belonging to Turkish Airlines (1974) [3] and a Boeing-747 belonging to Japan Airlines (1985) [4] had airplane disasters induced by explosive decompression.
In order to ensure safety, 14-CFR 25.365(e) [5] of the United States stipulates that: Any structure, component or part, inside or outside a pressurized compartment, the failure of which could interfere with continued safe flight and landing, must be designed to withstand the effects of a sudden decompression through an opening in any compartment at any operating altitude resulting from each of the listed conditions. Therefore, the analysis of decompression load is an important part of the strength evaluation of the preliminary design scheme of the cabin structure.
The 3-D simulation of the rapid decompression process is one of the most direct and accurate methods for decompression load analysis. Breard et al. [6] used commercial 3-D CFD code to simulate the decompression process for an aircraft with the cockpit windshield off. Bai et al. [7] investigated the influence of throttling and cabin volume on the explosive decompression process by 3-D numerical simulation. Due to the complexity of compartment structures and the transient and compressible characteristics of the decompression process, the 3-D simulation method is complex and time-consuming. Therefore, it is not suitable for the engineering application of aircraft structural design. Schroll and Tibbals et al. [8] proposed the 0-D model based on the simple isentropic flow assumption and the gas state equation, which achieved a fast simulation of the cockpit decompression process. Daidzic and Simones [9] applied the 0-D model to simulate the decompression process for typical large transport aircraft with different compartment geometries, discharge coefficients, leakage areas, and pressures. Pagani et al. [10] and Zhang [11] also applied the 0-D model to aircraft decompression load analysis. However, in the 0-D model, the pressure, temperature, and other aerodynamic parameter distributions in each compartment are assumed to be uniform, and the viscosity of air is also ignored. All of these factors reduce the accuracy of the decompression load analysis and adversely affect the structural strength assessment of the plane.
Active decompression panels between compartments are applied to enhance air circulation and reduce decompression load. Pratt [1] and Pagani [10] studied the decompression process in pressurized compartments with decompression panels. Zhang et al. [11] investigated the effects of different flight altitudes (environmental pressure) and the location of a leakage hole on the rapid decompression process of pressurized compartments, and the influence of the opening process of the decompression panel was considered. Their research also reported that the external surface pressure of the plane is not equal to the environmental pressure, and the effects of flight speed on pressure should be considered in the decompression load analysis. The accident report of Sichuan Airlines 3U8633 [2] also pointed out that there is local high pressure on the windshield due to the aerodynamic appearance when the passenger plane is cruising, which further affects the decompression process. Furthermore, the volume and shape of the compartment, the shape and area of the leakage hole, environmental pressure, flight altitude, and other parameters also have significant influences on the decompression load. Daidzic and Simones [9] applied a 0-D model to simulate the decompression process for a plane with an installed cockpit security door and studied the influence of compartments and environmental pressure, the shape and volume of the compartments, the leakage area, and the discharge coefficient of the leakage hole. Zhang et al. [12] conducted rapid decompression load analysis in a model with a layout similar to that of a real commercial plane, and the influence of compartment volume, discharge coefficient of leakage hole, and flight altitude was researched. Nevertheless, systematic research on the influence factors of decompression load is still scarce, and there are no commonly accepted non-dimensional parameters to evaluate the decompression process.
In this paper, the 0-D model and the 1-D model [13,14] are proposed to simulate the decompression process for a cabin-cockpit system with windshield failure. The accuracy of these models is presented by comparing them with experiments and 3-D CFD simulations. Then, the 1-D transient model is used to simulate the decompression process of a cabin-cockpit model with a cracked windshield. The effects of cockpit and cabin volume, windshield and decompression panel area, compartment and environment pressure, and flight Mach number on decompression load are discussed. The non-dimensional time and non-dimensional decompression load are proposed to evaluate the decompression process, and the correlation equations are established. This work provides a new engineering method for decompression load analysis with high accuracy and low consumption.
2. Modeling
2.1. Physical Model
The double-compartment model consists of a cabin and a cockpit (Figure 1), with windshields at the front of the cockpit and a decompression panel between the cabin and the cockpit. The air between the cabin and the cockpit is connected by the decompression panel. When the windshield fails suddenly, the air in the cockpit first leaks out and its pressure drops. The inter-compartment’s pressure imbalance induces the extra decompression load. Then the air in the cabin enters the cockpit through the decompression panel, which balances the pressure difference between cockpit and cabin. The decompression load decreases until a new pressure balance is established.
2.2. 0-D Model
The decompression process of a cabin-cockpit model with windshield off is a complex 3-D transient compressible flow process, thus it is not applicable to engineering design which needs quick calculations and multiple iterations. The decompression process can be discretized into infinitesimal time steps, and the calculation at each time step is divided into two parts (Figure 2). The first part is to calculate the mass flow rate of the decompression panel and windshield at the current moment, and the second part is to calculate the aerodynamic parameters in each compartment at the next moment.
In the first part, the windshield and the decompression panel are deemed as nozzles (Figure 3a). At each decompression time step, the flow process through nozzles is regarded as a quasi-static process, and the nozzle flow formula is applied to calculate the mass flow rate:
where, AS is the area of the decompression panel or the windshield, pin,t denotes the total inlet pressure, pout,s is the static outlet pressure, and ζ is the pressure ratio. Tin,t refers to the total inlet temperature; κ is the adiabatic exponential of the air and equals 1.4; R is the gas constant of the air and equals 287 J/(kg·K); and Cd is the discharge coefficient of the decompression panel and the windshield, which was obtained in advance by experiments. Several previous studies [15,16,17] carried out experimental studies on the discharge coefficients of typical airflow channels in passenger planes, including the rectangular channel. Figure 4 displays the discharge coefficient of the rectangular channel under various outlet pressures (pout,s) and inlet-outlet pressure ratios (pin,t/pout,s). The discharge coefficient increases gradually with the increase of pressure ratio. In each time step, the discharge coefficient needs to be updated by linear interpolation.
In the second part, the 0-D model ignores the pressure distribution and flow in the cabin and the cockpit. The decompression process in the cabin and the cockpit is also considered isentropic. To satisfy continuity, the change of density Δρ can be calculated using the following Equation (3) as shown in (Figure 3b):
where, V refers to the volume of compartment, is the mass flow rate flowing into the compartment, out is the mass flow rate flowing out of the compartment, ρ is the air density, and Δt is the time step. Then, other parameters such as pressure (pn+1) and temperature (Tn+1) at the next moment are solved based on the isentropic flow assumption.
2.3. 1-D Model
The 1-D model simplifies the complex decompression flow into the one-dimensional flow along the cabin and the cockpit. It also considers the effect of friction on the wall. The difference between the 1-D model and 0-D model is the calculation of the aerodynamic parameters of the cabin and cockpit in the second part (Figure 5). The two models are completely the same in the calculation of the mass flow rate of the decompression panel and the windshield in the first part, which will not be repeated here.
Governing equations of the 1-D model are established as follows. Based on conservation of mass, the continuity equation is:
where, U represents the air velocity and A represents the cross-sectional area of the compartment. By substituting the velocity of sound and the mass flow rate into the equation, the continuity equation transforms into the following form:
The momentum equation (x-direction) is as follows:
where, P represents the section circumference of the cabin and cockpit and τ stands for the wall shear stress, which can be calculated by Darcy’s formula:
Substituting the mass flow rate and the velocity of sound into the equation, the momentum equation transforms into:
The energy equation is as follows:
where, e stands for the internal energy. Substituting into the equation, and assuming that the wall is adiabatic, the energy equation finally transforms into the following form:
where, represents the friction force per unit mass of air.
Factor λ is used to combine continuity Equation (6) and momentum Equation (9) linearly (12), and the characteristic equation is obtained as (13), in which, represents the source term generated by friction.
C1, C2, C3, and λ are solved in Equation (14), and then two characteristic lines (Figure 6) are obtained. The red line (BD) is the C− characteristic line and the blue line (AD) is the C+ characteristic line . Equation (15) can be obtained by integrating (13) along the characteristic lines. The aerodynamic parameters of points A and B can be calculated by interpolating.
The explicit finite-difference method is applied to discretize energy Equation (11), and the discrete equation is as follows:
For the boundary nodes, including the node adjacent to the windshield, the two nodes adjacent to the decompression panel from both sides, and the node near cabin tail, the method similar to the 0-D model is used to calculate the aerodynamic parameters. Taking the node near the windshield as an example (Figure 7), the mass flow rate flowing out of the tiny space ① is the leakage mass flow rate at the windshield 1, and the mass flow rate flowing into the tiny space ① is the mass flow rate of the upstream node up. By substituting these into Equations (3) and (4), the aerodynamic parameters can be calculated.
2.4. Non-Dimensional Method
The factors affecting the decompression load include geometric parameters (e.g., the volume of cabin and cockpit, the area of decompression panel, windshield leakage area, etc.) and aerodynamic parameters (e.g., the pressure of compartments and environment, flight Mach number, etc.). In order to study the above factors, the dimensional analysis method [18] is applied to propose non-dimensional decompression load and non-dimensional decompression time, which can also provide reference for scaling the decompression experiment. Then, the non-dimensional time and non-dimensional decompression load are proposed to evaluate the decompression process, and the correlation equations are established as a design tool to provide a reference for the assessment of the structural strength of the cabin and cockpit. Table 1 gives the dimensions of the main parameters.
The decompression load Δp has the same dimension as the compartment pressure p2 (p4), thus the ratio of decompression load to compartment pressure is defined as the non-dimensional decompression load:
The non-dimensional time is defined as follows:
The dimensional equation is obtained as follows:
Solving the dimensional equations: α = 0.5, β = −0.5, and 2γ + 3ε = −1. Let γ = 1, then ε = −1, which means that the decompression time is directly proportional to the total volume of the compartments and inversely proportional to the area of the windshield. Thus, the non-dimensional time is finally defined as follows:
3. Model Verification
3.1. Experimental Verification
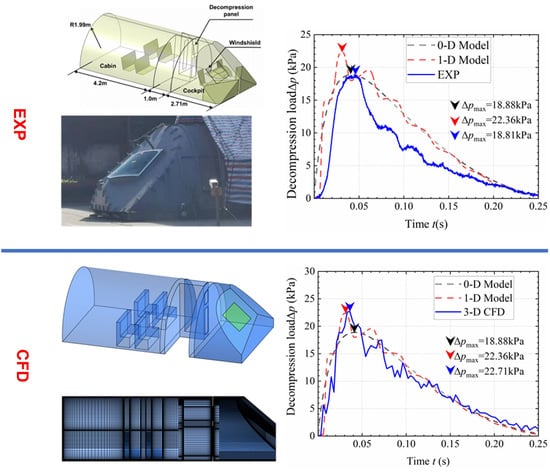
An experimental platform for cracked cockpit windshields of passenger planes was built in Jiangsu Tiemao Glass Co., Ltd. (Nantong, China). Relevant decompression experiments are carried out on the ground and transient pressure data of the cabin and cockpit are obtained, which provide support for the accuracy verification of the 0-D and 1-D models. The experimental compartment is the scaled model (1:2) of a certain passenger plane, including the cockpit and the cabin, as shown in Figure 8. Due to space constraints, the cabin is shorter than a real cabin, containing only two rows of seats. There are decompression panels (rectangular) between the cabin and the cockpit, which remain open during the decompression process. Several pressure sensors (5000 Hz) are arranged on both sides of the decompression panel to obtain transient pressure data. The geometric parameters and aerodynamic parameters are shown in Table 2. At the beginning of the experiment, the pressure of the cabin and cockpit was raised to 159.1 kPa, and the environment pressure was about 99.3 kPa. Then, the windshield was knocked via a remotely-controlled ‘hammer’ from outside. Several pressure sensors were used to measure the transient pressure on both sides of the decompression panel, and the decompression load curve was attained.
Both the 0-D model and the 1-D model are applied to predict the decompression process. It is verified that, when the time step of the 0-D model is less than 0.0001 s, the result is independent of the time step (Table 3). For the 1-D model, when the time step is less than 0.00002 s and the mesh number of the cockpit and cabin, respectively, reach 30 and 100, the result is independent of the time step and mesh (Table 4).
Figure 9 displays the decompression load curves (specified as the pressure differences on both sides of the decompression panel) of the experimental results and the predicted results of the 0-D and 1-D models. According to the experimental results, the decompression process can be divided into two stages. In the first stage, the air in the cockpit first leaks out and its pressure drops. As a consequence, the decompression load rapidly increases, accounting for about 15% of the total decompression time. In the second stage, air from the cabin enters the cockpit through the decompression panel, thus the decompression load slowly drops until a new pressure balance is established. Furthermore, the decompression load also presents a fluctuation characteristic. The possible reason is that the pressure wave reaches the cabin wall and reflects back, which is further explained in Section 4.
The predicted results of 0-D and 1-D models are compared with experimental results. The decompression load has a similar variation trend, both experiencing a rapid rise and then a slow decline, and the maximum decompression load appears at a similar time. The 1-D model also accurately simulates the characteristics of decompression load fluctuation, although the predicted maximum decompression load is approximately 18% higher than the experimental result. The main reason for the deviation is that the influencing factors of the experiment are complex and difficult to simulate comprehensively. For example, in the experiment, at the initial decompression moment, the leakage area gradually increases from zero to the windshield area. However, in the 0-D and 1-D models, the leakage area is set as a definite value (windshield area). As a result, the initial leakage velocity predicted by the 1-D model is faster than the experiment, which leads to a higher computed decompression load. To evaluate the accuracy of the 0-D and 1-D models reasonably and comprehensively, it is better to compare them with the 3-D CFD results.
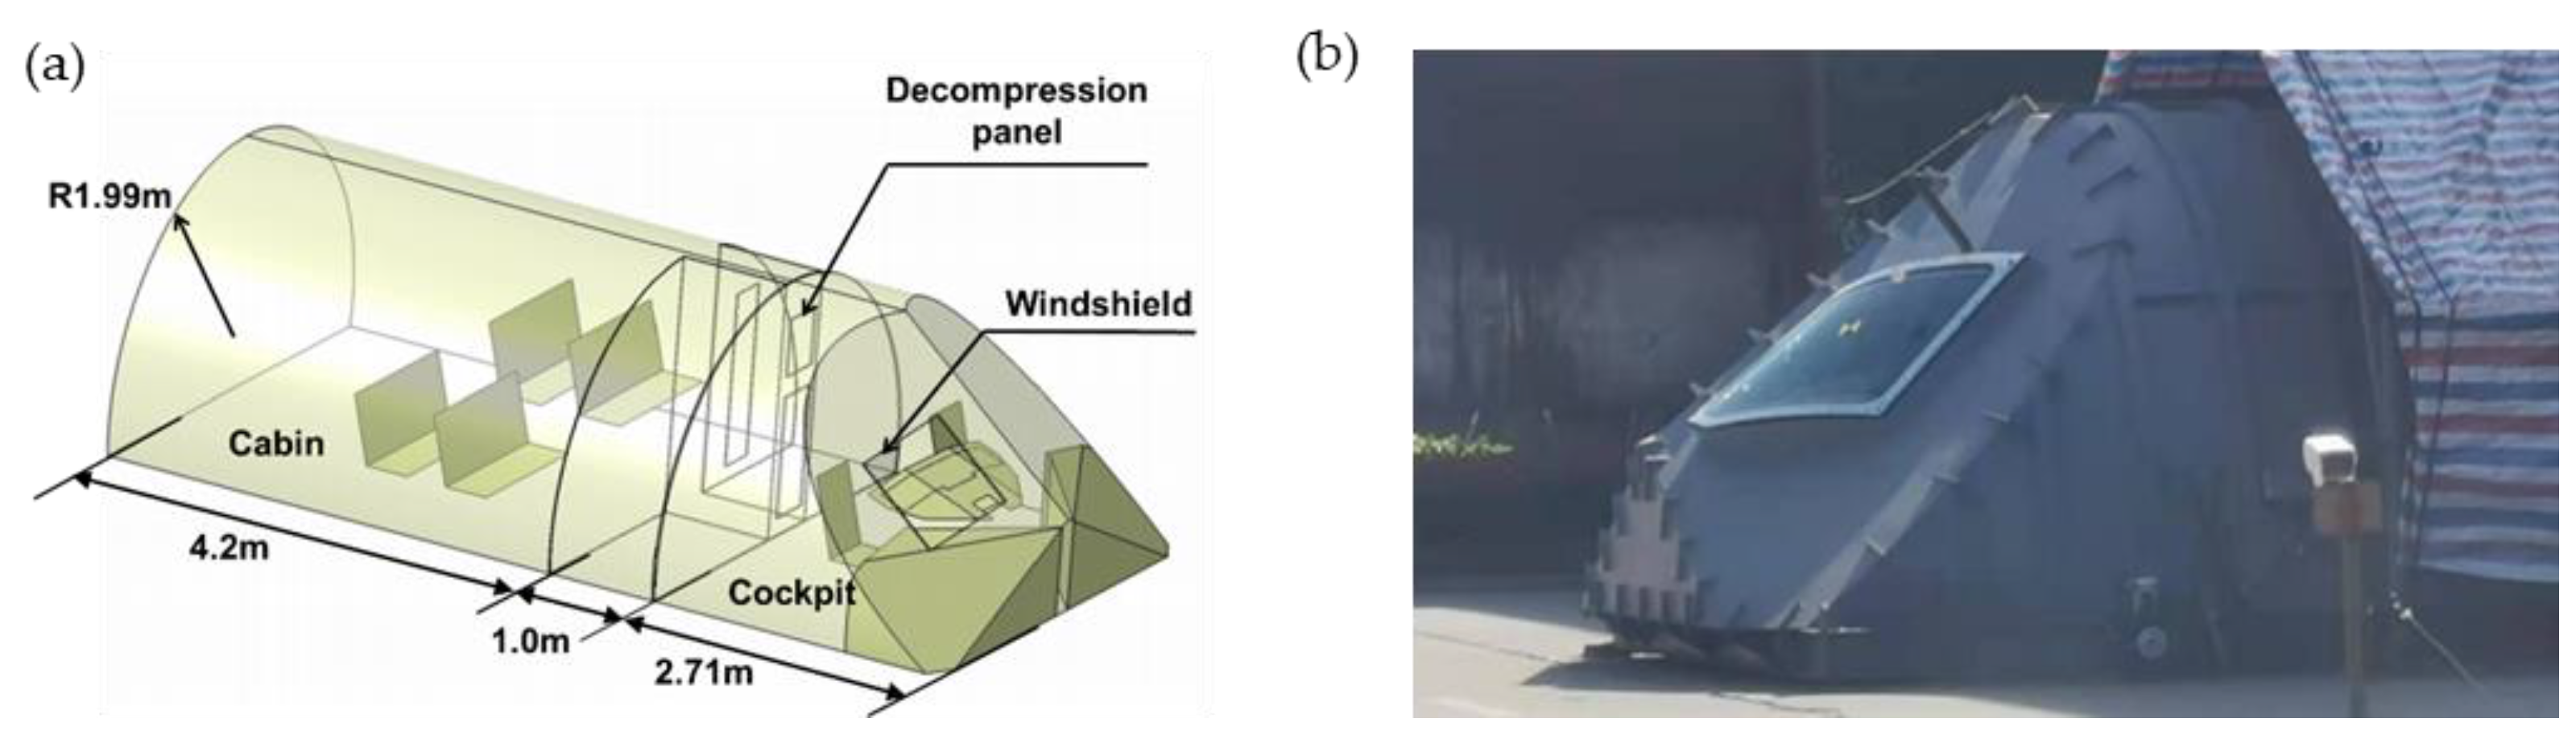
3.2. 3-D CFD Verification
A 3-D CFD simulation for the decompression process of the experimental compartment model with a cracked windshield can further verify the numerical accuracy of the 0-D and 1-D models. The simulation model is the same size as the experiment, and the ANSYS ICEM software is used to generate the fully-structured mesh. The simulation domain and mesh are illustrated in Figure 10. The total mesh size is 3.5 M. The ANSYS CFX solver is used for 3-D transient simulation, and the SST k-ω turbulence model is applied. The advection scheme is higher resolution, and the transient scheme is second-order backward Euler. At the initial moment, the cabin and cockpit pressure are set at 159.080 kPa and the environmental pressure is 99.325 kPa. The mass flow rate is set at 0 kg/s, and the wall surface is set as adiabatic. The time step is 10−6 s and the maximum iteration number is set as 100 in each time step. The convergence criterion is that the residual error (RMS) is less than 10−4.
Figure 11 displays the decompression load curves of the 3-D CFD results and the predicted results of the 0-D and 1-D models. It can be observed that the maximum decompression load predicted by the 0-D model is lower than the results of the 3-D CFD simulation, and the relative deviation is 16.86%. This is because the 0-D model ignores the non-uniformity of pressure and fails to predict the reflection of pressure waves in the cabin. The decompression load predicted by the 1-D model is more similar to that of the 3-D CFD simulation, and the relative deviation of the maximum decompression load is only 1.54%. In terms of time cost, the 1-D model took 5–8 min, while the 3-D CFD took about 10 days. The calculation time for the 1-D model is about 0.05% that of of the 3-D CFD simulation.
3.3. Analysis of the Decompression Process
Figure 12 shows the pressure distribution in the middle section at 6 moments, predicted by the 3-D CFD simulation. Figure 13 shows the pressure and mass flow rate distribution curves predicted by the 1-D model. Figure 12 and Figure 13 show consistent decompression processes. When t = 0.003 s, the pressure wave propagates in the cockpit but does not reach the cabin, and the pressure in the cockpit starts to drop. When t = 0.015 s, the pressure wave reaches the cabin but does not spread to the tail of the cabin; the pressure at the front of the cabin starts to drop. When t = 0.04 s, the pressure wave reaches the tail of the cabin and reflects. The pressure in the whole cabin drops and the pressure fluctuation appears, which causes the pressure in the tail of the cabin to be lower than that in the middle of the cabin. Then the pressure in the cabin and cockpit continues to decrease until it reaches external environmental pressure. As can be seen from the mass flow rate distribution curve, the mass flow rate is higher in the cockpit and the front of cabin, while the mass flow rate in the cabin tail remains at a lower value.
4. Results and Discussion
4.1. Effects of Compartment and Environmental Pressure
As the flight altitude rises, the environmental pressure decreases significantly, leading to changes in decompression loads. In addition, the flight Mach number of the passenger plane will also affect the back pressure (p0,b) of the windshield, and then alter the decompression process. According to the accident report of Sichuan Airlines 3U8633 [2], there is a local high pressure on the windshield due to the aerodynamic appearance of the passenger plane during flight. To analyze the effect of flight Mach number, the back pressure (p0,b) of the windshield is set as Equation (21) to simulate the local high pressure. Here, δ is the total pressure recovery coefficient, representing the ratio of the back pressure at the windshield to the total environmental pressure. According to the accident report of Sichuan Airlines 3U8633 [2], its value is approximately 0.88. Consequently, the effects of environmental pressure, flight Mach number, and the aerodynamic appearance of the passenger plane on the decompression process can be comprehensively considered as the influence of back pressure at the windshield.
In this section, the decompression processes are simulated under five different pressure conditions. The volume of the cockpit and passenger cabin are 9.8 m3 and 108.2 m3, respectively. The leakage areas of the windshield and the decompression panel are both 0.8 m2. Five pressure cases are given in Table 5. Cases P1–P3 correspond to operating conditions with different environmental pressures. The pressure of the cabin and cockpit is approximately the pressure corresponding to 2500–3000 m altitude (0.7 atm). Case P1 represents the condition that a passenger plane is cruising at an altitude of 9 km with Ma = 0.8 and the back pressure on the windshield is set at 0.4 atm. Compared to case P1, the cruising altitudes of cases P2 and P3 are lower, and the back pressure at the windshield is 0.45 atm and 0.50 atm, respectively. The pressure ratios of cases P4 and P5 are consistent with that of case P1. The environmental pressure of case P4 is 1 atm. For case P5, the back pressure on the windshield is 1 atm, which can be used for verification of the ground test.
Figure 14a,b, respectively, displays the curves of decompression load and non-dimensional decompression load under different pressure conditions. Comparing the curves of cases P1, P2, and P3 in Figure 14a,b, with the cabin/cockpit pressure remaining constant, the decompression speed in the cockpit slows down in the initial stage as the pressure ratio decreases (back pressure of windshield increases). As a consequence, the pressure difference between the cabin and cockpit decreases, and the decompression load has a great reduction. Elevated back pressure also means that less air escapes from the cabin and cockpit, thus reducing the total decompression time.
Comparing the decompression load curves of cases P1, P4, and P5 in Figure 14a, under the same pressure ratio conditions, with the cabin/cockpit pressure rising, the maximum decompression load increases significantly, while the total decompression time has no obvious changes. The maximum decompression loads are 11.637 kPa, 16.723 kPa, and 29.994 kPa, approximately directly proportional to the cabin pressure. The regression coefficient R2 is 99.89%. Comparing the non-dimensional decompression load of cases P1, P4, and P5 in Figure 14b, the curves almost coincide. In addition, the pressure fluctuation effect only increases slightly with the cabin/cockpit pressure increasing. In conclusion, the directly proportional relationship between the decompression load and the cabin (cockpit) pressure is verified.
4.2. Effects of Cabin and Cockpit Volume
In this section, the conditions that a passenger plane is cruising at an altitude of 9 km with Ma = 0.8 are simulated. The cabin and cockpit pressures are approximately the pressure corresponding to 2500–3000 m altitude (0.7 atm), and the back pressure at the windshield is 0.4 atm. The leakage areas of the windshield and the decompression panel are 0.8 m2. The five different cases of cabin and cockpit volume are given in Table 6. Case V1 corresponds to the actual cabin and cockpit volumes of a passenger plane, and the cabin-cockpit volume ratio is 11.04. The total volumes of cases V2 and V3 are the same as case V1, while the cabin-cockpit volume ratio increases to 13.75 and 18.67, respectively. The volume parameters of cases V4 and V5 are the volume parameters of case V1 scaled by 1:0.5 and 1:2, respectively.
Figure 15a,b, respectively, shows the curves of decompression load and non-dimensional decompression load under different volumes of cabin and cockpit. A comparison of the curves of cases V1, V2, and V3 in Figure 15a,b demonstrates that the cabin-cockpit volume ratio has almost no effect on the maximum decompression load and the total decompression time. However, it is worth mentioning that the increased cabin-cockpit volume ratio leads to the advance of maximum decompression load. That is because the reduction of cockpit volume leads to the acceleration of decompression in the cockpit at the initial moment, but the compensation of cockpit pressure from the cabin also accelerates. As a result, although the speed of decompression load increase is accelerated, the change in maximum decompression load is slight, even weaker than the decompression load fluctuation caused by pressure wave reflection.
As can be seen from the curves of cases V1, V4, and V5 in Figure 15a, under the same volume ratio conditions, the increased total volume leads to a significant increase in total decompression time but a slight change in maximum decompression load. The total decompression times of cases V1, V4, and V5 are 0.8599 s, 0.4299 s, and 1.7214 s, approximately directly proportional to the total volume. The regression determination coefficient R2 is 99.99%. The curves of cases V1, V4, and V5 in Figure 15b virtually coincide, thus it is reasonable to set the directly proportional relationship between the decompression time and the total volume. In addition, it also verifies the scaling effectiveness to some extent and provides theoretical support for the study of the decompression process by applying the scaling model in laboratory conditions.
4.3. Effects of the Windshield and Decompression Panel Area
In this section, the conditions that a real passenger plane is cruising at an altitude of 9 km with Ma = 0.8 are simulated. The cabin and cockpit pressures are 0.7 atm and the back pressure on the windshield is 0.4 atm. The volumes of cockpit and cabin are 9.8 m3 and 108.2 m3, respectively. The five different cases of windshield areas and decompression panel areas are provided in Table 7. The windshield areas of cases A1, A2, and A3 are the same, and the area ratio increases successively. For cases A2, A4, and A5, the windshield areas differ, while the area ratio remains.
Figure 16a,b, respectively, displays the curves of decompression load and non-dimensional decompression load under different areas of the windshield and decompression panels. It can be observed from the curves of cases A1, A2, and A3 in Figure 16a,b, that, under the same windshield area condition, increased area ratio (increased decompression area) accelerates the rate of air circulation between the cabin and the cockpit. As a consequence, the pressure difference between the cabin and the cockpit decreases and the decompression load drops. In addition, the cabin decompression velocity is also improved, thereby reducing the total decompression time. The increased area ratio also results in more dramatic effects of decompression load fluctuation.
The decompression curves of cases A2, A4, and A5 in Figure 16a indicate that, under the same condition of area ratio, the decompression speed accelerates with the increase of the windshield area, and the total decompression times are 1.756 s, 0.860 s, and 0.554 s, respectively, which are approximately inversely proportional to the windshield area. The regression determination coefficient R2 is 99.78%. The rationality of establishing an inversely proportional relationship between the decompression time and the windshield area is also evident. It is worth mentioning that there are considerable differences in non-dimensional decompression curves of cases A2, A4, and A5 in Figure 16b. This is because as the windshield area expands, the decompression speed increases, resulting in more significant decompression load fluctuations.
4.4. Regression Analysis
Table 8 presents the Pearson correlation coefficients between the non-dimensional maximum decompression load and the non-dimensional total decompression time with volume ratio, area ratio, and pressure ratio. It is concluded that the area ratio and pressure ratio are moderately correlated with the non-dimensional maximum decompression load and non-dimensional total decompression time. The correlation between the volume ratio with the non-dimensional maximum decompression load and the non-dimensional total decompression time is weak. This indicates that for a large passenger plane, when the cabin-cockpit volume ratio is between 10 and 20, it has little effect on the decompression process.
Through regression analysis, the final correlation equations are obtained as (22) and (23), and the regression coefficients of determination R2 are 93.32% and 99.63%, respectively. Figure 17a–f shows the curves of non-dimensional maximum decompression load and non-dimensional total decompression time as functions of volume ratio, area ratio, and pressure ratio, and the correlation fitting curves are also given. It is obvious that the data points fit well with the correlation fitting curves and that the relative deviations are all less than 3%.
Figure 17a,b illustrates that as the pressure ratio increases, both the maximum decompression load and the total decompression time increase, but the growth rate gradually slows. When the pressure ratio approaches 1, decompression does not occur, and the maximum decompression load and the total decompression time are both 0. According to the results of Figure 17c,d, within the range of typical volume ratio (10–20) of larger passenger planes, the maximum decompression load and total decompression time almost remain constant with the volume ratio increase. The reason is that, under the condition of large volume ratio, the decompression load variation caused by volume ratio is minor, and even weaker than the decompression load fluctuation caused by pressure wave reflection. As shown in Figure 17e,f, the maximum decompression load and total decompression time both decrease with the increase of area ratio, but the decrease rate is slowing down. When the area ratio approaches infinity, the air in the cabin and the cockpit is sufficiently connected. The two-compartment system is transformed into a single-compartment system. As a result, the dimensionless maximum decompression load tends to 0 and the dimensionless total decompression time tends to a constant value.
5. Conclusions
In this paper, 0/1-D transient flow models are proposed, which enables a rapid simulation of the decompression process with high precision. The effects of several geometric parameters and aerodynamic parameters on the decompression process are investigated. The conclusions are as follows:
(1) The decompression process is divided into two stages: in the first stage, the decompression load rapidly increases to the maximum value; in the second stage, the decompression load drops slowly. In the decompression process, the pressure wave reflects after contacting the cabin wall, which causes decompression load fluctuation.
(2) Compared to the experimental result and the 3-D CFD simulation results, the decompression load predicted by the 0-D and 1-D models both experienced a rapid rise and then a slow decline, and the 1-D model accurately simulates the characteristics of decompression load fluctuation. The decompression load predicted by the 1-D model is more similar to that of 3-D CFD simulation, and the relative deviation of the maximum decompression load is only 1.54%. In addition, the calculation time of the 1-D model is only 0.05% of that of the 3-D CFD simulation.
(3) Effects of compartment pressure and back pressure of windshield: When the pressure ratio remains constant, with the compartment pressure rising, the decompression load increases by the same proportion, while the total decompression time does not have significant changes. When the pressure ratio increases, both the maximum decompression load and the total decompression time rise.
(4) Effects of cabin and cockpit volume: When the volume ratio remains constant, the decompression time is directly proportional to the total volume, while the maximum decompression load has no obvious changes. Within the range of typical volume ratio (10–20) of larger passenger planes, the maximum decompression load and total decompression time almost remain constant with the volume ratio increase.
(5) Effects of decompression panel and windshield area: When the area ratio remains constant, the decompression time is inversely proportional to the windshield area. As the windshield area decreases significantly, the fluctuation effect of the decompression load decreases, and the maximum decompression load decreases slightly. As the area ratio increases, the air circulation rate between cabin and cockpit increases, thus the maximum decompression load and total decompression time are greatly reduced.
(6) Non-dimensional parameters and correlation equations: The non-dimensional decompression load and non-dimensional decompression time are proposed based on the dimensional analysis method, and the correlation equations are established. The relative deviation between the results of the correlation equation fit and the results of the one-dimensional simulation are less than 3%.
Author Contributions
Conceptualization, J.L., Z.L., S.L. and C.Z.; methodology, J.L., Z.L., S.L. and W.H.; software, W.H., X.Y. and D.L.; validation, J.L., W.H., X.Y. and D.L.; formal analysis, J.L., W.H., X.Y. and D.L.; investigation, J.L., W.H., X.Y. and D.L.; resources, J.L., Z.L., S.L. and C.Z.; data curation, J.L., W.H., X.Y. and D.L.; writing—original draft preparation, J.L. and W.H.; writing—review and editing, J.L., W.H. and X.Y.; visualization, J.L., W.H., X.Y. and D.L.; supervision, J.L., Z.L. and S.L.; project administration, J.L., Z.L., S.L. and C.Z. All authors have read and agreed to the published version of the manuscript.
Funding
This research received no external funding.
Institutional Review Board Statement
Not applicable.
Informed Consent Statement
Not applicable.
Data Availability Statement
The data presented in this study are available on request from the corresponding author.
Acknowledgments
This work was supported by the crosswise project “Experiment and Simulation of the Discharge Coefficient in the Pressurized Cabin of Long-range Wide-body Aircraft” of the Shanghai Aircraft Design and Research Institute.
Conflicts of Interest
The authors declare no conflict of interest.
Nomenclature
| A | area |
| p | pressure |
| ζ | pressure ratio |
| T | temperature |
| Cd | discharge coefficient |
| R | gas constant of the air |
| κ | adiabatic exponential of the air |
| V | volume |
| ρ | density |
| t | time |
| Δt | time step |
| Mass flow rate | |
| U | velocity |
| the velocity of sound | |
| P | circumference |
| τ | wall shear stress |
| e | internal energy |
| friction force per unit mass of air | |
| S | source term generated by friction |
| Ma | Mach number |
| Subscripts | |
| t | total |
| s | static |
| up | upstream |
| 0 | environment |
| 1 | windshield |
| 2 | cockpit |
| 3 | decompression panel |
| 4 | cabin |
| max | maximum |
| all | total |
| in | inlet |
| out | outlet |
References
- Pratt, J.D. Rapid Decompression of Pressurized Aircraft Fuselages. J. Fail. Anal. Prev. 2006, 6, 70–74. [Google Scholar] [CrossRef]
- Plane Serious Symptoms Investigation Report; SWCAAC-SRI-2018-1; Civil Aviation Administration Of China (CAAC): Beijing, China, 2020; Available online: https://perma.cc/NM6A-XH92 (accessed on 5 September 2022).
- Zhao, W.; Guo, Z. The Study of Pre-sight for the Air Transportation Systems. Phys. Procedia 2012, 24, 1469–1474. [Google Scholar] [CrossRef]
- Britannica. Japan Airlines Flight 123. Encyclopaedia Britannica. 2022. Available online: https://perma.cc/9MTT-XA4J (accessed on 5 September 2022).
- FAA, Code of Federal Regulations, Title 14, §25.365 Pressurized Compartment Loads. 2022. Available online: https://perma.cc/EHQ3-T3YL (accessed on 5 September 2022).
- Bréard, C.; Lednicer, D.; Lachendro, N.; Murvine, E. A CFD Analysis of Sudden Cockpit Decompression. In Proceedings of the 42nd AIAA Aerospace Sciences Meeting and Exhibit, Reno, NV, USA, 5–8 January 2004. [Google Scholar] [CrossRef]
- Bai, B.; Wang, J.; Zhou, Y. Numerical Study of the Effects of Fluid Conductance and the Capacity of Negatively Pressured Cabin to the Process of Explosive Decompression. IOP Conf. Ser. Mater. Sci. Eng. 2018, 449, 012019. [Google Scholar] [CrossRef]
- Schroll, D.; Tibbals, T. A Program for Analysis of Rapid Aircraft Cabin Decompression. In Proceedings of the SAFE Association 37th Annual Symposium Proceedings, Atlanta, GA, USA, 6–8 December 1999. [Google Scholar]
- Daidzic, N.E.; Simones, M.P. Aircraft Decompression with Installed Cockpit Security Door. J. Aircr. 2010, 47, 490–504. [Google Scholar] [CrossRef]
- Pagani, A.; Carrear, E. Gas Dynamics of Rapid and Explosive Decompressions of Pressurized Aircraft Including Active Venting. Adv. Aircr. Spacecr. Sci. 2016, 3, 77–93. [Google Scholar] [CrossRef]
- Zhang, T.; Lin, G.; Bu, X.; Jia, C.; Du, C. Simulation Research on Rapid Decompression of Aircraft Cabins. In Proceedings of the 2019 IEEE 10th International Conference on Mechanical and Aerospace Engineering, Brussels, Belgium, 22–25 July 2019; pp. 11–17. [Google Scholar] [CrossRef]
- Zhang, C.; Lin, S.; Liu, H.; Li, Y. Rapid Decompression Analysis Based on Commercial Plane Layout. In Proceedings of the AUS 2020: CSAA/IET International Conference on plane Utility Systems, Tianjin, China, 18–21 September 2021; pp. 575–580. [Google Scholar] [CrossRef]
- Deen, J.K.; Reintsema, S.R. Modeling of High Pressure Gas Transmission Lines. Appl. Math. Model. 1983, 7, 268–273. [Google Scholar] [CrossRef]
- Kiuchi, T. An Implicit Method for Transient Gas Flows in Pipe Net Works. Int. J. Heat Fluid Flow 1994, 15, 378–383. [Google Scholar] [CrossRef]
- Lin, S.; Zhang, C.; Li, Y. Experimental Study on Discharge Coefficient of Wing Box Channel in Civil Aircraft. In Proceedings of the AUS 2020: CSAA/IET International Conference on Aircraft Utility Systems, Tianjin, China, 18–21 September 2021; pp. 43–48. [Google Scholar] [CrossRef]
- Yang, X.; Luo, D.; Lu, R.; Lei, J.; Ling, S.; Zhang, C. Experiment of Discharge Coefficient for Flow Channel of Airplane Pressurized Cabin. Aerodyn. Res. Exp. 2021, 33, 107–114. Available online: https://perma.cc/FWR6-7WU2 (accessed on 5 September 2022).
- Zhang, C.; Lin, S.; Miao, Y. Experimental Study on Discharge Coefficient of Long Flow Channel in Airplane Pressurized Cabin. In Proceedings of the AUS 2020: CSAA/IET International Conference on Aircraft Utility Systems, Tianjin, China, 18–21 September 2021; pp. 430–434. [Google Scholar] [CrossRef]
- Tan, Q. Dimensional Analysis. With Case Studies in Mechanics; Springer: Berlin, Germany, 2011. [Google Scholar] [CrossRef]
Figure 1.
Schematic of the double-compartment model.

Figure 2.
Calculation process of the 0-D model.

Figure 3.
Calculation schematic of (a) mass flow rate and (b) Aerodynamic Parameters.

Figure 4.
Discharge coefficient of the rectangular channel.

Figure 5.
Calculation process of the 1-D model.

Figure 6.
Schematic of characteristic line.

Figure 7.
Calculation schematic of boundary nodes.

Figure 8.
(a) Model of the experimental compartment and (b) picture of the real experimental compartment.
Figure 8.
(a) Model of the experimental compartment and (b) picture of the real experimental compartment.

Figure 9.
Curves of decompression load (experimental verification).

Figure 10.
Geometry and mesh model of 3-D simulation: (a) simulation domain, (b) main view of the mesh, and (c) top view of mesh.
Figure 10.
Geometry and mesh model of 3-D simulation: (a) simulation domain, (b) main view of the mesh, and (c) top view of mesh.

Figure 11.
Curves of decompression load (3D-CFD verification).

Figure 12.
Pressure distribution in the middle section at 6 characteristic moments, predicted by 3-D CFD simulation.
Figure 12.
Pressure distribution in the middle section at 6 characteristic moments, predicted by 3-D CFD simulation.

Figure 13.
(a) Pressure distribution and (b) mass flow rate distribution at 6 characteristic moments, predicted by 1-D models.
Figure 13.
(a) Pressure distribution and (b) mass flow rate distribution at 6 characteristic moments, predicted by 1-D models.

Figure 14.
(a) Decompression load curves and (b) non-dimensional decompression load curves with varying pressure.
Figure 14.
(a) Decompression load curves and (b) non-dimensional decompression load curves with varying pressure.

Figure 15.
(a) Decompression load curves and (b) non-dimensional decompression load curves with varying cabin and cockpit volumes.
Figure 15.
(a) Decompression load curves and (b) non-dimensional decompression load curves with varying cabin and cockpit volumes.

Figure 16.
(a) Decompression load curves and (b) non-dimensional decompression load curves with windshield areas and decompression panel areas.
Figure 16.
(a) Decompression load curves and (b) non-dimensional decompression load curves with windshield areas and decompression panel areas.

Figure 17.
(a) Curve of non-dimensional maximum decompression load-pressure ratio, (b) curve of non-dimensional total decompression time-pressure ratio, (c) curve of non-dimensional maximum decompression load-volume ratio, (d) curve of non-dimensional total decompression time-volume ratio, (e) curve of non-dimensional maximum decompression load-area ratio, and (f) curve of non-dimensional total decompression time-area ratio.


Table 1.
Dimension of parameters.
| Parameter | Dimension |
|---|---|
| Pressure of cabin, cockpit (p2, p4) and environment (p0) | [ML−1 T−2] |
| Density of cabin, cockpit (ρ2, ρ4) and environment (ρ0) | [ML−3] |
| Area of the windshield (A1) | [L2] |
| Total volume of compartments (V2 + V4) | [L3] |
| Decompression load (Δp) | [ML−1 T−2] |
| Time (t) | [T] |
Table 2.
Experimental parameters.
| Geometric Parameters | Aerodynamic Parameters | ||
|---|---|---|---|
| Cabin volume V4/m3 | 30 | Environment pressure p0/kPa | 99.33 |
| Cockpit volume V2/m3 | 13 | Cabin pressure p4/kPa | 159.1 |
| Cross-sectional area of cabin A4/m2 | 5.7 | Cockpit pressure p2/kPa | 159.1 |
| Cross-sectional area of Cockpit A2/m2 | 5.0 | Environment temperature T0/K | 298.3 |
| Windshield area A1/m2 | 0.8 | Cabin temperature T4/K | 298.3 |
| Decompression panel area A3/m2 | 0.6 | Cockpit temperature T2/K | 298.3 |
Table 3.
Time-step-independence verification of 0-D model.
| No. | Time Steps (s) | Maximum Decompression Load (kPa) |
|---|---|---|
| 1 | 0.0005 | 18.978 |
| 2 | 0.0002 | 18.907 |
| 3 | 0.0001 | 18.882 |
| 4 | 0.00005 | 18.881 |
Table 4.
Time-step-independence and mesh-independence verification of the 1-D model.
| No. | Time Steps (s) | Mesh Number of Cockpit | Mesh Number of Cabin | Maximum Decompression Load (kPa) |
|---|---|---|---|---|
| 1 | 0.00002 | 10 | 50 | 21.532 |
| 2 | 0.00002 | 20 | 75 | 22.057 |
| 3 | 0.0001 | 30 | 100 | 23.502 |
| 4 | 0.00005 | 30 | 100 | 22.686 |
| 5 | 0.00002 | 30 | 100 | 22.356 |
| 6 | 0.00001 | 30 | 100 | 22.277 |
| 7 | 0.00002 | 40 | 120 | 22.401 |
Table 5.
Varying pressure cases.
| Cases | Pressure of Cabin and Cockpit p2 = p4 (atm) | Back Pressure of Windshield p0,b (atm) | Pressure Ratio p2/p0,b |
|---|---|---|---|
| P1 | 0.7 | 0.40 | 1.75 |
| P2 | 0.7 | 0.45 | 1.56 |
| P3 | 0.7 | 0.50 | 1.4 |
| P4 | 1.0 | 0.57 | 1.75 |
| P5 | 1.75 | 1.0 | 1.75 |
Table 6.
Varying volume cases.
| Cases | Total Volume V2 + V4 (m3) | Cockpit Volume V2 (m3) | Volume Ratio V4/V2 |
|---|---|---|---|
| V1 | 118 | 9.8 | 11.04 |
| V2 | 118 | 8.0 | 13.75 |
| V3 | 118 | 6.0 | 18.67 |
| V4 | 59 | 4.9 | 11.04 |
| V5 | 236 | 19.6 | 11.04 |
Table 7.
Varying windshield areas and decompression panel areas.
| Cases | Windshield Area A1 (m2) | Decompression Panel Area A3 (m2) | Area Ratio A3/A1 |
|---|---|---|---|
| A1 | 0.8 | 0.4 | 0.5 |
| A2 | 0.8 | 0.8 | 1.0 |
| A3 | 0.8 | 1.2 | 1.5 |
| A4 | 0.4 | 0.4 | 1.0 |
| A5 | 1.2 | 1.2 | 1.0 |
Table 8.
Pearson correlation.
| Non-Dimensional Maximum Decompression Load | Non-Dimensional TOTAL Decompression Time | |
|---|---|---|
| Pressure ratio | 0.4267 | 0.5370 |
| Volume ratio | 0.0562 | 0.0186 |
| Area ratio | 0.7628 | 0.4784 |
Publisher’s Note: MDPI stays neutral with regard to jurisdictional claims in published maps and institutional affiliations. |
© 2022 by the authors. Licensee MDPI, Basel, Switzerland. This article is an open access article distributed under the terms and conditions of the Creative Commons Attribution (CC BY) license (https://creativecommons.org/licenses/by/4.0/).
Share and Cite
MDPI and ACS Style
He, W.; Yang, X.; Luo, D.; Lei, J.; Li, Z.; Lin, S.; Zhang, C. Decompression Load Analysis in Large Passenger Planes with Windshield Cracked. Aerospace 2022, 9, 517. https://doi.org/10.3390/aerospace9090517
AMA Style
He W, Yang X, Luo D, Lei J, Li Z, Lin S, Zhang C. Decompression Load Analysis in Large Passenger Planes with Windshield Cracked. Aerospace. 2022; 9(9):517. https://doi.org/10.3390/aerospace9090517
Chicago/Turabian StyleHe, Wenbin, Xi Yang, Ding Luo, Jiang Lei, Zhimao Li, Shiquan Lin, and Congxiao Zhang. 2022. "Decompression Load Analysis in Large Passenger Planes with Windshield Cracked" Aerospace 9, no. 9: 517. https://doi.org/10.3390/aerospace9090517
Note that from the first issue of 2016, this journal uses article numbers instead of page numbers. See further details here.