
EEG Feature Analysis Related to Situation Awareness Assessment and Discrimination

1
School of Aeronautic Science and Engineering, Beihang University, Beijing 100191, China
2
Intelligent Human-Machine Systems Laboratory, College of Engineering, Northeastern University, Boston, MA 02115, USA
*
Author to whom correspondence should be addressed.
Aerospace 2022, 9(10), 546; https://doi.org/10.3390/aerospace9100546
Submission received: 29 August 2022
/
Revised: 16 September 2022
/
Accepted: 22 September 2022
/
Published: 25 September 2022
(This article belongs to the Special Issue Latest Advancements in Aeronautics and Astronautics: Celebrating the 70th Anniversary of Beihang University)
Abstract
:In order to discriminate situation awareness (SA) levels on the basis of SA-sensitive electroencephalography (EEG) features, the high-SA (HSA) group and low-SA (LSA) groups, which are representative of two SA levels, were classified according to the situation awareness global assessment technology (SAGAT) scores measured in the multi-attribute task battery (MATB) II tasks. Furthermore, three types of EEG features, namely, absolute power, relative power, and slow-wave/fast-wave (SW/FW), were explored using spectral analysis. In addition, repeated analysis of variance (ANOVA) was conducted in three brain regions (frontal, central, and parietal) × three brain lateralities (left, middle, and right) × two SA groups (LSA and HSA) to explore SA-sensitive EEG features. The statistical results indicate a significant difference between the two SA groups according to SAGAT scores; moreover, no significant difference was found for the absolute power of four waves (delta (δ), theta (θ), alpha (α), and beta (β)). In addition, the LSA group had a significantly lower β relative power than the HSA group in central and partial regions. Lastly, compared with the HSA group, the LSA group had higher θ/β and (θ + α)/(α + β) in all analyzed brain regions, higher α/β in the parietal region, and higher (θ + α)/β in all analyzed regions except for the left and right laterality in the frontal region. The above SA-sensitive EEG features were fed into principal component analysis (PCA) and the Bayes method to discriminate different SA groups, and the accuracies were 83.3% for the original validation and 70.8% for the cross-validation. The results provide a basis for real-time assessment and discrimination of SA by investigating EEG features, thus contributing to monitoring SA decrement that might lead to threats to flight safety.
1. Introduction
Human error was shown to contribute to more than 70% of safety accidents and incidents in safety-critical industrial areas, while 88% of human error was found to be due to problems with situation awareness (SA) [1,2]. The broadest definition of SA is “the perception of elements in the environment within a volume of time and space, the comprehension of their meaning, and the projection of their status in the near future” [3]. In consideration of its importance in human factor/ergonomics areas, the related work to measure and discriminate SA continuously and effectively is still insufficient [3,4].
According to the related literature, SA measurement can be mainly categorized into subjective measures, freezing or real-time probe measures, performance measures, and physiological measures [5,6]. Each of these measures has its advantages and disadvantages. For example, the three-dimensional situation awareness rating technology (3D-SART) is a typical subjective method to measure SA [7]. The primary advantages of subjective measures are that they are inexpensive, are easy to administer, and have high face validity [8]. However, the sensitivity and subjectivity of this method have been criticized considering the post-trial collection of the operator’s scoring. As for freezing or real-time probe techniques, the situational awareness global assessment technology (SAGAT) method and the situation present assessment method (SPAM) are two excellent representatives [9,10]. SAGAT is a freezing probe SA measurement which has received widespread acceptance with large amounts of empirical validations [11,12,13,14]. However, the SAGAT method is not conducted in real time and introduces interference to the primary task (requires the testing scenario to be frozen randomly), which makes it hard to be accepted in a real environment. SPAM is a real-time probe measure with the advantage of in field application and intrusion decrements imposed by task freezes in the freezing probe techniques [5]. However, the limitations of the intrusion to the primary task and its validity have been debated [15]. Another method is represented by performance measures. Although it is continuous, objective, and nonintrusive, its serious drawback is its unclear relationships with SA, whereby efficient performance does not necessarily lead to an operator having good SA during the task, and vice versa [5].
Physiological measures, which use sensors to collect human biological signals, have the advantages of being continuous, objective, mobile, and real-time [16,17]. Compared with the previous measures, physiological measures show great potential considering the above benefits. Electrocardiographic (ECG), electrodermal (EDA), respiration, and eye movement signals have been explored in the physiological measurement of SA. Sun et al. (2017) comprehensively used EDA, ECG, and respiration in a flight simulation environment, and the result revealed the correlations between physiological indicators (standard deviation of normal to normal (SDNN), respiratory rate, and coefficient variation of RR interval (RRCV)) and SA. Van de Merwe et al. (2012) demonstrated the potential of eye movement indicators (fixation rates, dwell times, and entropy) to assess SA in a flight simulator experiment. Similarly, de Winter et al. (2019) outlined the limitations of the SAGAT and indicated the potential of using eye-tracking metrics in eye-based SA [11]. Among these physiological measures, eye-tracking technology was the most common modality adopted in the identified SA studies, and it was often correlated with direct SA measures [11].
Compared with the above physiological methods, electroencephalography (EEG) possesses high time resolution (accurately records quick changes in electrical activity on a millisecond timescale), direct measurement of operator’s neural activity at group level, and correlations with SA-related cognitive constructs, e.g., perception, comprehension, and working memory, which makes it suitable for use in SA studies [18,19,20,21,22]. Moreover, mental states that are closely related to SA can also be reflected in EEG, such as mental workload [23,24], fatigue [25], and alertness [26]. Although a large number of EEG measures have been reported for the above mental states, few published SA-related studies have explored EEG measures. For example, Catherwood et al. (2014), found that the early coactivity in high-order and visual perception regions may provide a basis for top-down influence on perception during early intervals in the loss of SA in target and threat identification tasks [18]. Yeo et al. (2017) found that EEG is a promising approach for measuring the SA of air traffic controllers by investigating machine learning methods combined with EEG indicators (power, power ratio, and entropy) [19]. Kaur et al. (2020) found that the pre-task resting alpha frontal asymmetry, pre-task resting absolute alpha, and associated neural mechanisms significantly influence the outcome of SA tasks via the Stroop effect [27]. Kästle et al. (2021) identified the EEG signatures associated with SA in various regions of the brain under the operator’s high and low SA [28].
Another approach is to discriminate different SA levels. For instance, Li et al. (2020) discriminated two fatigue-related SA levels (high and low SA), yielding various accuracies of the spectral–spatial (S–S) model (70.6%), logistic regression (67.9%), support vector machine (63.8%), EEGNet-4.2 (59.0%), and EEGNet-8.2 (60.3%) [29]. However, the 2020 model of Li et al. uses the reaction time to quantitatively define the SA, leading to concerns regarding its validity because of the unclear relationship between performance measures and SA. Kästle et al. (2021) used random forest and boosted trees combined with all EEG data to discriminate SA levels, achieving 67% accuracy [28]. In the 2021study of Kästle et al., the power spectral density (PSD) of five EEG bands was used to perform the discrimination, lacking connection with the results of SA-sensitive EEG signals. Despite the above efforts, several limitations can be highlighted. First, the EEG features used for discrimination were limited, and most accuracies were less than 70%. Second, traditional discrimination methods, such as regression analysis [30] and Bayes method [31], which have been widely used for the discrimination of several typical human states, were rarely used in the discrimination of SA. Considering their good interpretability, they could benefit from clarification of the underlying mechanisms of SA. Third, most of the current studies used all EEG features rather than SA-sensitive EEG features, especially those in the frequency domain, which probably introduced interruption and led to nonoptimal discriminate results.
On the basis of the above limitations, an exploration of EEG experiments and feature extraction for different SA groups was conducted in this manuscript. At first, the high-SA (HSA) group and low-SA (LSA) group, which are representative of two SA levels, were classified according to SAGAT scores measured in the multi-attribute task battery (MATB) II tasks. Moreover, three types of EEG features, namely, absolute power, relative power, and slow-wave/fast-wave (SW/FW), were explored using spectral analysis. In addition, repeated analysis of variance (ANOVA) was conducted in three brain regions (frontal, central, and parietal) × three brain lateralities (left, middle, and right) × two SA groups (LSA and HSA) to explore SA-sensitive EEG features. Lastly, the above SA-sensitive EEG features were fed into principal component analysis (PCA) and the Bayes method to discriminate between the two SA groups. Correspondingly, five hypotheses were also proposed in the current study:
Hypothesis 1 (H1).
Groups with low and high SA levels according to SAGAT scores can be distinguished when operating the MATB II tasks.
Hypothesis 2 (H2).
There are absolute power differences between HSA and LSA groups.
Hypothesis 3 (H3).
There are relative power differences between HSA and LSA groups.
Hypothesis 4 (H4).
There are SW/FW differences between HSA and LSA groups.
Hypothesis 5 (H5).
The combination of SA-sensitive EEG features and a linear discrimination method can achieve effective SA classification results.
2. Methods
2.1. Experimental Design
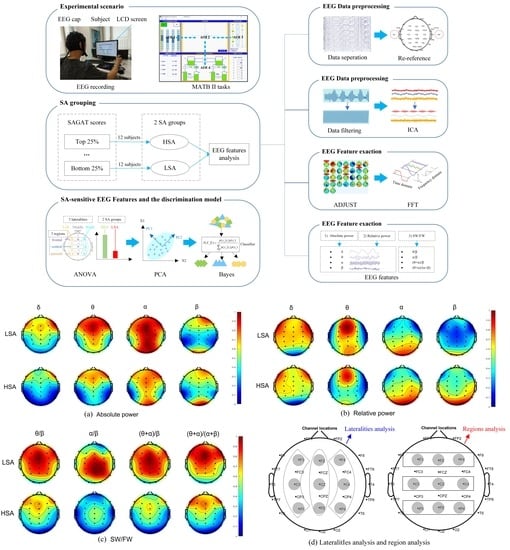
This research aimed to investigate the sensitive EEG features for SA assessment and discrimination. In our experimental design, the SA level was the independent variable, while the measured EEG features were the dependent variables. The SA levels were achieved by high- and low-SA groups, which were distinguished according to SAGAT scores in the MATB II tasks. The EEG features of absolute power, relative power, and SW/FW were analyzed, as shown in Figure 1.
2.2. Subjects
Forty-eight graduate students with an average age of 23.15 years (standard deviation (SD) = 0.72, ranging from 22 to 24 years) were selected as subjects (39 males and 9 females) from the School of Aeronautic Science and Engineering, Beihang University. All participants were informed of the instructions and procedures of the experiment, and they signed written informed consent forms before the experiment. All subjects were in good health, with right-hand dominance, normal vision or corrected-to-normal vision, and adequate sleep (at least 8 h) during the 24 h before the experiment. This research was approved by the Beihang University Biological and Medical Ethics Committee.
2.3. Experimental Platform and Tasks
MATB II developed by the National Aeronautics and Space Administration (NASA) is widely used when building simulation scenarios in a laboratory environment. MATB II was originally designed as a classic computer-based platform to evaluate operator performance and workload [32]. After several updates, it was validated in numerous studies and extended to several related areas [33,34,35]. In consideration of its acceptance in testing the human cognitive state, the MATB II platform was used in this study for evaluating SA. MATB II includes four typical subtasks: system monitoring, target tracking, scheduling display, and resource management, which originated from typical flight task characteristics [32]. The flying joystick, keyboard, and mouse can be used to interact with the platform.
2.4. EEG Equipment and Indicators
In the current study, the Neuroscan Neuamps amplifier was used to record the EEG data, including 32 channels: F7, FT7, T3, TP7, T5, A1, FP1, F3, FC3, C3, CP3, P3, O1, FZ, FCZ, CZ, CPZ, PZ, OZ, FP2, F4, FC4, C4, CP4, P4, O2, F8, FT8, T4, TP8, T6, and A2. All electrodes were Ag/AgCl. The recorded wave was 0.1–200 Hz, and the sampling rate was 1000 Hz. The impedance of the electrodes was maintained under 5 kΩ. GND served as the ground, and the left mastoid A1 was referenced online. The vertical and horizontal channels of the electrooculogram (EOG) were recorded simultaneously. In addition, the EEG signal was re-referenced to the average of the bilateral mastoid electrodes offline. The analysis was performed using the toolbox MATLAB R2014a eeglab14_1_1b (available from https://sccn.ucsd.edu/eeglab/download/daily/, accessed on 16 September 2022), and the bandpass filtering of 1–30 Hz was adopted. The EEG signals were analyzed with independent component analysis (ICA), and the Adjust 1.1.1 toolbox (available from https://www.nitrc.org/frs/?group_id=739&release_id=3054#, accessed on 16 September 2022) was used to eliminate the artifacts. All EEG data were segmented, and fast Fourier transform (FFT) was performed. Then, the segmented data were averaged and divided into four waves: 1–4 Hz for the delta (δ) wave, 4–8 Hz for the theta (θ) wave, 8–12 Hz for the alpha (α) wave, and 13–30 Hz for the beta (β) wave. The overall band power was determined from the integration of the power across the designated spectrum. The unit of power analysis was microvolts squared per octave (μV2). The EEG signals were collected in real time using the EEG acquisition device throughout the experiment.
2.5. EEG Equipment and Indicators
Before the formal experiment, all subjects received enough training and practice to make sure that they were skilled in completing the designed subtasks (with an accuracy higher than 90%). Meanwhile, each subject was required to wear EEG sensors and complete the resting test. After the training session, the SAGAT measures were performed to test the SA levels of subjects in MATB II tasks [28]. According to previous studies, SAGAT is a highly sensitive, reliable, and predictive measure of SA shown to be useful across a wide variety of domains and experimental settings [13]. Therefore, the SAGAT method based on the computerized freezing technique was used in our study to measure SA. Specifically, the MATB II interface was frozen and completely covered by the presented question interface at a random time during the experiment. The presentation interval of freezing was about 5 min, and six questions were raised each time. The average presentation time of questions was less than 1 min, and the interval of each freezing was more than 2 min [10]. It was guaranteed that no question was asked within the first 3 min so that the subject could obtain information in a stable scenario [10]. The popup question selected from the SAGAT database was answered by the subject using mouse clicks.
3. Results and Analysis
3.1. Grouping of SA Levels
In our study, two SA groups (i.e., HSA group and LSA group) were classified according to SAGAT scores. Referring to previous studies, subjects with the top 25% SAGAT scores (12 subjects) were categorized as the HSA group, while subjects with the bottom 25% SAGAT scores (12 subjects) were categorized as the LSA group [28,36]. The mean age of the HSA group was 23.08 years (SD = 0.79), while that of the LSA group was 23.17 years (SD = 0.58). An independent t-test was conducted using SPSS 25.0 on SAGAT scores of different SA groups. It was found that SAGAT scores showed an increasing trend from the LSA group (70.83 ± 5.86) to the HSA group (91.20 ± 2.86). Statistical results indicated that the SAGAT score of the LSA group was significantly lower than that of the HSA group (t(22) = −10.817, p < 0.001). The above results demonstrate that the grouping effect of SA among the two groups was validated.
3.2. Quantitative EEG Analysis of Different SA Groups
3.2.1. Data Analysis Methods
Electrode placements in three brain regions (frontal: F3, Fz, F4; central: C3, Cz, C4; parietal: P3, Pz, P4), which have close connections with the construct of SA, were considered for analysis in our study [37,38,39]. Moreover, the differences among left, right, and central brain literalities have often been investigated [24,39]; hence, three lateralities (left: F3, C3, P3; central: Fz, Cz, Pz; right: F4, C4, P4) were also studied. On the basis of the SA grouping, the sensitive EEG features were further explored for SA. One of the most standard methods of EEG analysis is frequency-domain analysis [21]. Considering its representativeness in the distribution of full-head electrode sites and widespread use in EEG research, nine electrode sites (F3, Fz, F4, C3, Cz, C4, P3, Pz, and P4) including three brain regions (frontal, central, and parietal) and three lateralities (left, middle, and right) were selected for the analysis of EEG spectral features [23,24,25]. The absolute power (μV2) and relative power (%) of the four bands, as well as four SW/FW ratios, were selected as the EEG spectral features. The relative power of a certain wave is the ratio of the absolute power of a certain wave to the absolute power of the whole wave (1–30 Hz). The four typically used SW/FW ratios of θ/β, α/β, (θ + α)/β, and (θ + α)/(α + β) were adopted for analysis in this manuscript [40].
Therefore, three types of EEG spectral features under the LSA group and HSA group were selected for repeated-measures ANOVA of three brain regions (frontal, central, and parietal) × three brain lateralities (left, middle, and right) × 2 SA groups (LSA and HSA). The Bonferroni method was used for post hoc analysis [41]. Mauchly’s method was used for the test of sphericity, and, if the assumption was rejected, the Greenhouse–Geisser method was used for correction [42,43]. The topographical maps in Figure 2 provide a descriptive demonstration of the three types of EEG spectral features. Higher activations in relevant electrode sites are demonstrated by brighter colors (in this case, red) in the figures; otherwise, blue indicates nonactivated electrode sites.
3.2.2. Absolute Power of Different SA Groups
Descriptive results of the absolute power in four waves for the different SA groups are shown in Figure 3. ANOVA results showed that no significant interaction effect (p > 0.05) of the absolute power was found. Moreover, the main effect of the SA group for the absolute power in four waves was also not significant (p > 0.05), as shown in Table 1.
3.2.3. Relative Power of Different SA Groups
Descriptive results of the relative power in four waves for the different SA groups are shown in Figure 4. The ANOVA results demonstrated a significant interaction effect of the beta relative power for the region × SA group (F(1.506, 33.130) = 4.467, p = 0.028, η2 = 0.169), and further simple effect analysis indicated that the beta relative power under the LSA group was significantly lower than that of the HSA group in the central and parietal brain regions (p = 0.016, p = 0.006). No significant interaction effects and main effects were found in the other waves (p > 0.05), as shown in Table 2.
3.2.4. SW/FW Ratios of Different SA Groups
Descriptive results of the four SW/FW ratios for the different SA groups are shown in Figure 5. The statistical results of the four SW/FW ratios for the different SA groups are shown in Table 3. For θ/β, the main effect of the SA group was significant, with the LSA group having a significantly higher θ/β than the HSA group (p = 0.005). For α/β and (θ + α)/β, significant interaction effects were found in the region × laterality × SA group (F(3.175, 69.858) = 3.404, p = 0.020, η2 = 0.134; F(2.953, 64.975) = 3.103, p = 0.033, η2 = 0.124). Simple effect analysis showed that, in the parietal brain region, the α/β of the LSA group was significantly higher than that of the HSA group in left (p = 0.018), midline (p = 0.013), and right laterality (p = 0.007). For (θ + α)/β, except for the left and right laterality in the frontal region, (θ + α)/β of the LSA group was significantly higher than that of the HSA group in the other electrode sites (p < 0.005), as shown in Figure 5. The main effect of the SA group was significant, with the LSA group having a significantly higher (θ + α)/(α + β) than the HSA group (p = 0.025). No other significant interaction effects and main effects were found (p > 0.05).
3.3. Bayesian Discrimination Model of SA Based on Sensitive EEG Features
According to the above analysis, three aspects of EEG features of the high- and low-SA groups were analyzed: (1) the absolute power showed no significant differences; (2) the beta relative power showed significant differences in the central and parietal regions; (3) the SW/FW ratios of θ/β and (θ + α)/(α + β) showed significant differences in the frontal, central, and parietal regions, the α/β showed significant differences in the parietal brain region, and the (θ + α)/β showed significant differences in the other electrode sites except for the left and right laterality in the frontal region.
Thirty-four SA-sensitive EEG features at relevant electrode sites were used for the classification of high and low SA levels, as shown in Table 4. Two steps were taken. Initially, the EEG features were downscaled through a PCA method, and three principal components of F1, F2, and F3 were selected, which explained 91.37% of the total square deviation (72.2%, 12.4%, and 6.7%, respectively), as shown in Figure 6.
PCA is a method of data dimensionality reduction, which characterizes multiple sets of related data as several unrelated principal components [44,45]. If Oi1 is the original dataset, where Oi1 = [o1, o2, …, oi]T, and Fj1 represents the new principal components, where Fj1 = [f1, f2, …, fj]T, then the relationship between the two variables can be expressed as
where C is the component matrix, and . The component matrix of F1–F3 is shown in Table 4.
Fj1 = Cji × Oi1,
Then, F1, F2, and F3 were fed into a classification model based on the Bayesian method.
There are categories ; the prior probability of category is , and . Given sample , the class-conditional probability density of on is . Therefore, its posterior probability of belonging to , , can be described by the Bayes equation.
The discriminant function is a description of the classifier, which can be described as . For the Bayes classifier, the discriminant function is , which can also be simplified to according to the Bayes equation, or expressed as in logarithmic form.
Suppose that the class-conditional probability density of sample follows the multivariate Gaussian density , i.e.,
Substituting Equation (3) into , the quadratic discriminant function can be obtained as follows:
If the covariance matrices of all categories are considered equal, , Equation (4) can be expanded and simplified to obtain the corresponding linear discriminant function.
On the basis of the above equations, the linear discrimination equation in our manuscript was built as follows:
Z1 = −0.961F1 + 0.167F2 + 0.419F3 − 1.032.
Z2 = 0.961F1 − 0.167F2 − 0.419F3 + 1.032.
The values of F1–F3 were fed into Equations (6) and (7), and the maximum output of Z1–Z2 was set as the grouping result. The classification results were 83.3% accuracy in the original validation and 70.8% accuracy in the cross-validation (leaving 1 out), as shown in Table 5.
4. Discussion
To investigate the EEG changes related to different SA levels, 48 subjects were recruited to complete MATB II tasks. In our study, subjects with the highest 25% and the lowest 25% SAGAT scores were defined as the HSA group and the LSA group, respectively. The independent-sample t-test showed that SAGAT scores of the LSA group were significantly lower than those of the HSA group, thus confirming H1. In addition, the EEG features related to SA levels were analyzed on the basis of the SA grouping. The experiment demonstrated significant differences in the beta relative power and four SW/FW ratios. Choosing the SA-sensitive EEG features as input, discrimination accuracies of 83.3% in the original validation and 70.8% in the cross-validation were obtained for different SA groups using the PCA and Bayes methods.
PSD represents the signal power distributed over a range of frequencies [20]. δ oscillations are frequently observed in states of diminished consciousness, including slow-wave sleep and disorders of consciousness [46]. θ oscillations are involved in active maintenance and recall of working memory (WM) representations, which increase with added WM load or higher attentional demands [29,47]. α waves occur during relaxed conditions at decreased attention levels, often in a drowsy but wakeful state [23,29,48]. β oscillations are associated with the preservation of the current brain state, typically alertness and arousal [23,49,50]. Although the above literature indicates a possible connection between EEG waves and SA-related construct, no obvious EEG absolute power differences were demonstrated in our study, thus rejecting H2. The results may indicate that absolute power as an EEG feature has limited contribution to detecting different SA levels.
In addition, the analysis of relative power in four waves was carried out. The results showed a significantly lower β relative power for the LSA group than the HSA group in central and parietal brain regions, thus partly confirming H3. The findings of β relative power differences in the central and parietal regions are consistent with the findings of Kästle et al. (2021) and Shayesteh and Jebelli (2022) [28,51]. The β wave activity is usually observed during the state of normal consciousness, alertness, or active concentration. According to previous studies, the β wave is normally considered to be associated with excitation, and is expected to be more active when the SA is higher and significantly reduced under fatigue [20,21,25]. In the present study, the LSA group may have had lower alertness or mental arousal, which was not conducive to the perception, comprehension, and prediction of the situation, thus causing poor SA. The central brain region is considered to be associated with sensory and motor functions [38], while the parietal brain regions control the sensory and motor systems, awareness, and perception [39,52]. The findings in our research provide support that the two brain regions are both closely correlated to the cognitive processes of SA, which could provide evidence for exploration of the underlying neurophysiological mechanisms of SA.
In addition, analysis of the four SW/FW ratios (θ/β, α/β, (θ + α)/β, and (θ + α)/(α + β)) in the high- and low-SA groups was also conducted. The results showed that the four SW/FW ratios were sensitive to different SA groups, thus confirming H4, which could provide sensitive EEG features for SA classification in similar situations. The SW/FW ratios of EEG are typical indicators used by researchers to reflect the cortical control function over subcortical [20]. Studies have observed an increase in the four SW/FW ratios under fatigue, which can be applied in human alertness assessment [26,53]. The θ/β ratio was initially introduced in attention-deficit/hyperactivity disorder diagnosis, and recent studies explored its connection to various aspects of executive cognitive performance in healthy individuals, such as working memory, attention (especially executive attentional control), stress, and sleepiness [20,40,54,55]. The adoption of θ/β ratio in the current study was based on the assumption that the LSA group may have had decreased alertness and task engagement, which would have resulted in a decrease in β power and an increase in θ power, i.e., a higher θ/β [40]. The α/β ratio is often used to investigate an individual’s cognitive state such as mental attentiveness, mental fatigue, and stress [20]. Furthermore, (θ + α)/β has been used to study alertness and task engagement, mental attentional investment, mental effort, vigilance, and attention, while a high value of this index may be associated with a state of high vigilance [40]. Our findings are consistent with the above assumption, as higher SW/FW ratios were found in the LSA group, providing new and important SA-sensitive EEG features for SA discrimination.
According to the repeated ANOVA results, sensitive SA-related EEG features were found in our research, which were fed into the Bayes model for discrimination after PCA. According to calculation, the discrimination result of the Bayes method based on sensitive EEG features was 83.3% for the original validation and 70.8% for the cross-validation, thus H5 was confirmed. Up to now, a limited number of studies have been conducted on SA discrimination. For example, the 2020 model of Li et al. discriminated two fatigue-related SA levels (high and low SA), with accuracies recorded for the S–S model (70.6%), logistic regression (67.9%), support vector machine (63.8%), EEGNet-4.2 (59.0%), and EEGNet-8.2 (60.3%) [29]; Kästle et al. (2021) used Random Forest and Boosted Trees combined with all EEG data to discriminate SA levels, and achieved 67% accuracy [28]. In our study, the selection of sufficient SA-sensitive EEG features and adequate consideration of their contribution is conductive to the improvement of discrimination accuracy, as conflicting information is excluded to reduce the possible confusion. Therefore, the combination of SA-sensitive EEG features and a linear discriminant model can also achieve effective discrimination results, which can be a feasible direction in more realistic situations.
This study performed an EEG feature analysis related to different SA levels. It is possible to provide an in-depth analysis of the mechanisms underlying the decrease in SA through the findings, propose achievable preventive measures, and ensure safe completion of the operator’s task [19]. The research characteristics of our study include three aspects. First, performance measures were commonly used in most previous studies related to SA assessment and classification, however, the relationship between SA and performance was unclear [56], which reduces the reliability of research results. In our study, the SAGAT method was used to classify the high and low SA levels. As a highly sensitive, reliable, and predictive measure of SA that was useful across a wide variety of domains and experimental settings [13], the SAGAT method can improve the objectivity of SA grouping effectively [29]. Second, it is well accepted that physiological measurements have promising potential for online monitoring and identification of SA; However, most of the current studies have focused on eye movement measurements, and the correlation between EEG and SA remains unclear. For online discrimination of SA, EEG measurement has the advantages of high temporal resolution and direct measurement of population-level neural activity in the operator. According to our experiment, EEG features of beta relative power and SW/FW are found to be sensitive to different SA levels, thus providing useful indicators for the discriminative analysis of SA. Most studies on the discrimination of operator cognitive states focus on mental workload and fatigue, while the discriminative analysis of SA based on objective EEG features is rare and has limited predictive accuracy. Bayesian methods are applied on the basis of sensitive EEG features in our study, yielding an enhanced discriminative accuracy. In addition, compared with the machine learning methods, the results of classical Bayes discriminant model are more interpretable for SA discrimination mechanisms [19].
5. Conclusions
This study distinguished HSA and LSA groups according to SAGAT scores in MATB II tasks. EEG spectrum analysis of high- and low-SA groups was performed to explore SA-sensitive features, including the absolute power and relative power of four frequency bands, and the SW/FW ratios were selected. In addition, the Bayes method was used to further discriminate different SA groups, combined with SA-sensitive EEG features and PCA. According to the experimental results, several conclusions can be drawn. First, the LSA group had significantly lower SAGAT scores than the HSA group. Second, the absolute power of the four waves showed no significant difference between LSA and HSA groups. Third, the LSA group had a significantly lower beta relative power than the HSA group in the central and parietal brain regions. Fourth, compared with the HSA group, the LSA group had higher θ/β and (θ + α)/(α + β) in the frontal, central, and parietal regions, higher α/β in the parietal region, and higher (θ + α)/β in all regions except for the left and right laterality in the frontal region. Lastly, in combination with the above SA-sensitive EEG features, through the PCA and Bayes method, discrimination could be achieved between the two SA groups with 83.3% accuracy for the original validation and 70.8% accuracy for the cross-validation. These results provide evidence for online assessment and discrimination of SA using EEG features, thus contributing to dealing with SA decrement that might lead to threats to flight safety.
However, this study had some limitations. First, this was a pilot study in a laboratory environment; hence, the results need to be further validated in actual task situations, especially for operators in the field and on real operation platforms (typically professional pilots in high-fidelity flight simulators). Second, three or more SA levels can be defined to uncover the mechanisms between SA and EEG, and a more flexible objective and reliable SA measure is needed to set/collect more labels for machine learning and pattern recognition. Our research explored and validated the applicability of EEG features to assess and discriminate SA levels. Combinations with other physiological signals, such as eye tracking and heart rate variability (HRV), can also be helpful in future research on the discrimination of SA. Furthermore, future work can be carried out to explore various SA characteristics under different subject groups, such as the male/female groups, as well as professional pilots/flight cadets/student groups with an aviation background.
Author Contributions
Conceptualization, formal analysis, investigation, methodology, software, validation, visualization, and writing—original draft preparation, C.F.; formal analysis, investigation, methodology, resources, software, validation, and writing—review and editing, S.L.; conceptualization, data curation, funding acquisition, methodology, project administration, resources, supervision, and writing—review and editing, X.W.; investigation, validation, and visualization, H.C.; validation and visualization, Y.M. (Yuchen Min); visualization, investigation, Y.M. (Yilan Ma). All authors have read and agreed to the published version of the manuscript.
Funding
This research was funded by the joint program of the national Natural Science Foundation of China (NSFC) and Civil Aviation Administration of China (CAAC) (No. U1733118), the NSFC (No. 71301005), and the Aeronautical Science Foundation of China (ASFC) (No. 201813300002).
Institutional Review Board Statement
This study was carried out based on the postgraduate course of ergonomics experiment (Course number: 05116106). The curriculum design and experimental outline have been reviewed and approved by school of aeronautical science and engineering, Beihang University. This research was conducted in accordance with the Declaration of Helsinki, and further approved by Beihang University Biological and Medical Ethics Committee (Approval No: BM20220176).
Informed Consent Statement
Informed consent was obtained from all subjects involved in the study.
Data Availability Statement
The data presented in this study are available on request from the corresponding author. The data are not publicly available due to privacy.
Acknowledgments
The authors gratefully acknowledge the agencies NSFC, CCAC, and ASFC for the financial support. In addition, the authors acknowledge the subjects for their participation.
Conflicts of Interest
The authors declare no conflict of interest.
References
- Liu, P.; Zhang, R.; Yin, Z.; Li, Z. Human Errors and Human Reliability. In Handbook of Human Factors and Ergonomics; Salvendy, G., Karwowski, W., Eds.; Wiley: Hoboken, NJ, USA, 2021; pp. 514–572. ISBN 978-1-119-63608-3. [Google Scholar]
- Endsley, M.R.; Jones, D.G. Designing for Situation Awareness: An Approach to User-Centered Design, 2nd ed.; CRC Press: Boca Raton, FL, USA, 2013. [Google Scholar]
- Endsley, M.R. Toward a Theory of Situation Awareness in Dynamic Systems. Hum. Factors 1995, 37, 32–64. [Google Scholar] [CrossRef]
- Stanton, N.A.; Salmon, P.M.; Walker, G.H.; Salas, E.; Hancock, P.A. State-of-Science: Situation Awareness in Individuals, Teams and Systems. Ergonomics 2017, 60, 449–466. [Google Scholar] [CrossRef]
- Nguyen, T.; Lim, C.P.; Nguyen, N.D.; Gordon-Brown, L.; Nahavandi, S. A Review of Situation Awareness Assessment Approaches in Aviation Environments. IEEE Syst. J. 2019, 13, 3590–3603. [Google Scholar] [CrossRef]
- Wang, Y.; Hu, R.; Lin, S.; Schultz, M.; Delahaye, D. The Impact of Automation on Air Traffic Controller’s Behaviors. Aerospace 2021, 8, 260. [Google Scholar] [CrossRef]
- Taylor, R.M. Situation Awareness Rating Technique (SART): The Development of a Tool for Aircrew Systems Design; Advisory Group for Aerospace Research & Development: Neuilly Sur Seine, France, 1990; pp. 3-1–3-17. [Google Scholar]
- Valerie Jane, G. Measures of Situational Awareness. In Human Performance and Situation Awareness Measures; CRC Press: Boca Raton, FL, USA, 2019; pp. 135–174. ISBN 978-0-429-00102-4. [Google Scholar]
- Durso, F.T.; Hackworth, C.A.; Truitt, T.R.; Crutchfield, J.; Nikolic, D.; Manning, C.A. Situation Awareness as a Predictor of Performance for En Route Air Traffic Controllers. Air Traffic Control Q. 1998, 6, 1–20. [Google Scholar] [CrossRef]
- Endsley, M.R. Measurement of Situation Awareness in Dynamic Systems. Hum. Factors 1995, 37, 65–84. [Google Scholar] [CrossRef]
- De Winter, J.C.F.; Eisma, Y.B.; Cabrall, C.D.D.; Hancock, P.A.; Stanton, N.A. Situation Awareness Based on Eye Movements in Relation to the Task Environment. Cogn. Technol. Work 2019, 21, 99–111. [Google Scholar] [CrossRef]
- Endsley, M.R. The Divergence of Objective and Subjective Situation Awareness: A Meta-Analysis. J. Cogn. Eng. Decis. Mak. 2020, 14, 34–53. [Google Scholar] [CrossRef]
- Endsley, M.R. A Systematic Review and Meta-Analysis of Direct Objective Measures of Situation Awareness: A Comparison of SAGAT and SPAM. Hum. Factors 2021, 63, 124–150. [Google Scholar] [CrossRef]
- Dorton, S.L.; Maryeski, L.R.; Costello, R.P.; Abrecht, B.R. A Case for User-Centered Design in Satellite Command and Control. Aerospace 2021, 8, 303. [Google Scholar] [CrossRef]
- Loft, S.; Bowden, V.; Braithwaite, J.; Morrell, D.B.; Huf, S.; Durso, F.T. Situation Awareness Measures for Simulated Submarine Track Management. Hum. Factors 2015, 57, 298–310. [Google Scholar] [CrossRef]
- Charles, R.L.; Nixon, J. Measuring Mental Workload Using Physiological Measures: A Systematic Review. Appl. Ergon. 2019, 74, 221–232. [Google Scholar] [CrossRef]
- Van de Merwe, K.; van Dijk, H.; Zon, R. Eye Movements as an Indicator of Situation Awareness in a Flight Simulator Experimen. Int. J. Aviat. Psychol. 2012, 22, 78–95. [Google Scholar] [CrossRef]
- Catherwood, D.; Edgar, G.K.; Nikolla, D.; Alford, C.; Brookes, D.; Baker, S.; White, S. Mapping Brain Activity during Loss of Situation Awareness: An EEG Investigation of a Basis for Top-down Influence on Perception. Hum. Factors 2014, 56, 1428–1452. [Google Scholar] [CrossRef]
- Yeo, L.G.; Sun, H.; Liu, Y.; Trapsilawati, F.; Sourina, O.; Chen, C.-H.; Mueller-Wittig, W.; Ang, W.T. Mobile EEG-Based Situation Awareness Recognition for Air Traffic Controllers. In Proceedings of the 2017 IEEE International Conference on Systems, Man, and Cybernetics (SMC) IEEE, Banff, AB, Canada, 5–8 October 2017; pp. 3030–3035. [Google Scholar]
- Wen, T.Y.; Aris, S.A.M. Electroencephalogram (EEG) Stress Analysis on Alpha/Beta Ratio and Theta/Beta Ratio. Indones. J. Electr. Eng. Comput. Sci. 2020, 17, 175. [Google Scholar] [CrossRef]
- Zhang, T.; Yang, J.; Liang, N.; Pitts, B.J.; Prakah-Asante, K.O.; Curry, R.; Duerstock, B.S.; Wachs, J.P.; Yu, D. Physiological Measurements of Situation Awareness: A Systematic Review. Hum. Factors 2020, 1–22. [Google Scholar] [CrossRef]
- Cohen, M.X. Where Does EEG Come From and What Does It Mean? Trends Neurosci. 2017, 40, 208–218. [Google Scholar] [CrossRef]
- Borghini, G.; Astolfi, L.; Vecchiato, G.; Mattia, D.; Babiloni, F. Measuring Neurophysiological Signals in Aircraft Pilots and Car Drivers for the Assessment of Mental Workload, Fatigue and Drowsiness. Neurosci. Biobehav. Rev. 2014, 44, 58–75. [Google Scholar] [CrossRef]
- Wanyan, X.; Zhuang, D.; Lin, Y.; Xiao, X.; Song, J.-W. Influence of Mental Workload on Detecting Information Varieties Revealed by Mismatch Negativity during Flight Simulation. Int. J. Ind. Ergon. 2018, 64, 1–7. [Google Scholar] [CrossRef]
- Zhao, C.; Zhao, M.; Liu, J.; Zheng, C. Electroencephalogram and Electrocardiograph Assessment of Mental Fatigue in a Driving Simulator. Accid. Anal. Prev. 2012, 45, 83–90. [Google Scholar] [CrossRef]
- Eoh, H.J.; Chung, M.K.; Kim, S.-H. Electroencephalographic Study of Drowsiness in Simulated Driving with Sleep Deprivation. Int. J. Ind. Ergon. 2005, 35, 307–320. [Google Scholar] [CrossRef]
- Kaur, A.; Chaujar, R.; Chinnadurai, V. Effects of Neural Mechanisms of Pretask Resting EEG Alpha Information on Situational Awareness: A Functional Connectivity Approach. Hum. Factors 2020, 62, 1150–1170. [Google Scholar] [CrossRef]
- Kästle, J.L.; Anvari, B.; Krol, J.; Wurdemann, H.A. Correlation between Situational Awareness and EEG Signals. Neurocomputing 2021, 432, 70–79. [Google Scholar] [CrossRef]
- Li, R.; Lan, Z.; Cui, J.; Sourina, O.; Wang, L. EEG-Based Recognition of Driver State Related to Situation Awareness Using Graph Convolutional Networks. In Proceedings of the 2020 International Conference on Cyberworlds (CW) IEEE, Caen, France, 29 September–1 October 2020. [Google Scholar]
- Feng, C.; Wanyan, X.; Yang, K.; Zhuang, D.; Wu, X. A Comprehensive Prediction and Evaluation Method of Pilot Workload. Technol. Health Care 2018, 26, 65–78. [Google Scholar] [CrossRef]
- Wei, Z.; Zhuang, D.; Wanyan, X.; Liu, C.; Zhuang, H. A Model for Discrimination and Prediction of Mental Workload of Aircraft Cockpit Display Interface. Chin. J. Aeronaut. 2014, 27, 1070–1077. [Google Scholar] [CrossRef]
- Santiago-Espada, Y.; Myer, R.R.; Latorella, K.A.; Comstock, J.R. The Multi-Attribute Task Battery II (MATB-II) Software for Human Performance and Workload Research: A User’s Guide; National Aeronautics and Space Administration, Langley Research Center: Hampton, VA, USA, 2011. [Google Scholar]
- Ferraro, J.C.; Mouloua, M. Effects of Automation Reliability on Error Detection and Attention to Auditory Stimuli in a Multi-Tasking Environment. Appl. Ergon. 2021, 91, 103303. [Google Scholar] [CrossRef]
- Liu, S.; Nam, C.S. Quantitative Modeling of User Performance in Multitasking Environments. Comput. Hum. Behav. 2018, 84, 130–140. [Google Scholar] [CrossRef]
- Wickens, C.D.; Gutzwiller, R.S.; Vieane, A.; Clegg, B.A.; Sebok, A.; Janes, J. Time Sharing between Robotics and Process Control: Validating a Model of Attention Switching. Hum. Factors 2016, 58, 322–343. [Google Scholar] [CrossRef]
- Butchibabu, A.; Sparano-Huiban, C.; Sonenberg, L.; Shah, J. Implicit Coordination Strategies for Effective Team Communication. Hum. Factors 2016, 58, 595–610. [Google Scholar] [CrossRef]
- Li, H.; Huang, G.; Lin, Q.; Zhao, J.; Fu, Q.; Li, L.; Mao, Y.; Wei, X.; Yang, W.; Wang, B.; et al. EEG Changes in Time and Time-Frequency Domain During Movement Preparation and Execution in Stroke Patients. Front. Neurosci. 2020, 14, 827. [Google Scholar] [CrossRef]
- Teplan, M. Fundamentals of EEG Measurement. Meas. Sci. Rev. 2002, 2, 11. [Google Scholar]
- Trapsilawati, F.; Herliansyah, M.K.; Nugraheni, A.S.A.N.S.; Fatikasari, M.P.; Tissamodie, G. EEG-Based Analysis of Air Traffic Conflict: Investigating Controllers’ Situation Awareness, Stress Level and Brain Activity during Conflict Resolution. J. Navig. 2020, 73, 678–696. [Google Scholar] [CrossRef]
- Fernandez Rojas, R.; Debie, E.; Fidock, J.; Barlow, M.; Kasmarik, K.; Anavatti, S.; Garratt, M.; Abbass, H. Electroencephalographic Workload Indicators during Teleoperation of an Unmanned Aerial Vehicle Shepherding a Swarm of Unmanned Ground Vehicles in Contested Environments. Front. Neurosci. 2020, 14, 40. [Google Scholar] [CrossRef]
- Armstrong, R.A. When to Use the Bonferroni Correction. Ophthalmic Physiol. Opt. 2014, 34, 502–508. [Google Scholar] [CrossRef]
- Armstrong, R.A. Recommendations for Analysis of Repeated-Measures Designs: Testing and Correcting for Sphericity and Use of MANOVA and Mixed Model Analysis. Ophthalmic Physiol. Opt. 2017, 37, 585–593. [Google Scholar] [CrossRef]
- Mishra, P.; Singh, U.; Pandey, C.; Mishra, P.; Pandey, G. Application of Student’s t-Test, Analysis of Variance, and Covariance. Ann. Card. Anaesth. 2019, 22, 407. [Google Scholar] [CrossRef]
- De Giorgi, M.G.; Strafella, L.; Menga, N.; Ficarella, A. Intelligent Combined Neural Network and Kernel Principal Component Analysis Tool for Engine Health Monitoring Purposes. Aerospace 2022, 9, 118. [Google Scholar] [CrossRef]
- Li, Z.; Dong, Y.; Li, P.; Li, H.; Liew, Y. A New Method for Remote Sensing Satellite Observation Effectiveness Evaluation. Aerospace 2022, 9, 317. [Google Scholar] [CrossRef]
- Frohlich, J.; Toker, D.; Monti, M.M. Consciousness among Delta Waves: A Paradox? Brain 2021, 144, 2257–2277. [Google Scholar] [CrossRef]
- Ren, M.; Xu, J.; Zhao, J.; Zhang, S.; Wang, W.; Xu, S.; Zhou, Z.; Chen, X.; Chen, S.; Li, Y.; et al. The Modulation of Working-Memory Performance Using Gamma-Electroacupuncture and Theta-Electroacupuncture in Healthy Adults. Evid. Based Complement. Alternat. Med. 2021, 2021, 2062718. [Google Scholar] [CrossRef]
- Frey, J.N.; Ruhnau, P.; Weisz, N. Not so Different after All: The Same Oscillatory Processes Support Different Types of Attention. Brain Res. 2015, 1626, 183–197. [Google Scholar] [CrossRef] [Green Version]
- Khanna, P.; Carmena, J.M. Neural Oscillations: Beta Band Activity across Motor Networks. Curr. Opin. Neurobiol. 2015, 32, 60–67. [Google Scholar] [CrossRef]
- Spitzer, B.; Haegens, S. Beyond the Status Quo: A Role for Beta Oscillations in Endogenous Content (Re)Activation. eNeuro 2017, 4, 1–15. [Google Scholar] [CrossRef]
- Shayesteh, S.; Jebelli, H. Enhanced Situational Awareness in Worker-Robot Interaction in Construction: Assessing the Role of Visual Cues. In Proceedings of the Construction Research Congress 2022, Arlington, VA, USA, 9–12 March 2022; pp. 422–430. [Google Scholar]
- Abbass, H.A.; Tang, J.; Amin, R.; Ellejmi, M.; Kirby, S. Augmented Cognition Using Real-Time EEG-Based Adaptive Strategies for Air Traffic Control. In Proceedings of the Human Factors and Ergonomics Society Annual Meeting, Chicago, IL, USA, 27–31 October 2014; Volume 58, pp. 230–234. [Google Scholar]
- Jap, B.T.; Lal, S.; Fischer, P. Comparing Combinations of EEG Activity in Train Drivers during Monotonous Driving. Expert Syst. Appl. 2011, 38, 996–1003. [Google Scholar] [CrossRef]
- Angelidis, A.; van der Does, W.; Schakel, L.; Putman, P. Frontal EEG Theta/Beta Ratio as an Electrophysiological Marker for Attentional Control and Its Test-Retest Reliability. Biol. Psychol. 2016, 121, 49–52. [Google Scholar] [CrossRef]
- Wen, T.Y.; Bani, N.A.; Muhammad-Sukki, F.; Mohd Aris, S.A. Electroencephalogram (EEG) Human Stress Level Classification Based on Theta/Beta Ratio. Int. J. Integr. Eng. 2020, 12, 174–180. [Google Scholar] [CrossRef]
- Bakdash, J.Z.; Marusich, L.R.; Cox, K.R.; Geuss, M.N.; Zaroukian, E.G.; Morris, K.M. The Validity of Situation Awareness for Performance: A Meta-Analysis. Theor. Issues Ergon. Sci. 2022, 23, 221–244. [Google Scholar] [CrossRef]
Figure 1.
Overview of experimental procedures and data analysis methods.

Figure 2.
Three types of EEG features and channel locations for the two SA groups.


Figure 3.
Absolute power for the two SA groups.

Figure 4.
Relative power for the two SA groups.

Figure 5.
Four SW/FW ratios for the two SA groups.

Figure 6.
Principal component analysis results of SA-sensitive EEG features.


Table 1.
ANOVA results of absolute power for the two SA groups.
| Waves (μV2) | Region × Laterality × SA Group | Region × SA Group | Laterality × SA Group | SA Group | ||||||||
|---|---|---|---|---|---|---|---|---|---|---|---|---|
| F | p | η2 | F | p | η2 | F | p | η2 | F | p | η2 | |
| δ | 0.879 | 0.437 | 0.038 | 0.155 | 0.751 | 0.007 | 0.974 | 0.378 | 0.042 | 3.020 | 0.096 | 0.121 |
| θ | 0.653 | 0.556 | 0.029 | 0.003 | 0.967 | <0.001 | 1.450 | 0.247 | 0.062 | 3.272 | 0.084 | 0.129 |
| α | 0.945 | 0.429 | 0.041 | 0.455 | 0.560 | 0.020 | 0.266 | 0.733 | 0.012 | 0.911 | 0.350 | 0.040 |
| β | 0.453 | 0.681 | 0.020 | 0.639 | 0.452 | 0.028 | 0.392 | 0.667 | 0.018 | 0.490 | 0.491 | 0.022 |
Table 2.
ANOVA results of relative power for the two SA groups.
| Waves (%) | Region × Laterality × SA Group | Region × SA Group | Laterality × SA Group | SA Group | ||||||||
|---|---|---|---|---|---|---|---|---|---|---|---|---|
| F | p | η2 | F | p | η2 | F | p | η2 | F | p | η2 | |
| δ | 1.460 | 0.234 | 0.062 | 0.239 | 0.694 | 0.011 | 1.854 | 0.171 | 0.078 | 0.871 | 0.361 | 0.038 |
| θ | 0.535 | 0.652 | 0.024 | 0.246 | 0.673 | 0.011 | 0.134 | 0.859 | 0.006 | 1.439 | 0.243 | 0.061 |
| α | 0.663 | 0.575 | 0.029 | 0.421 | 0.623 | 0.019 | 1.448 | 0.246 | 0.062 | 0.276 | 0.064 | 0.012 |
| β | 2.204 | 0.097 | 0.091 | 4.467 | 0.028 * | 0.169 | 1.918 | 0.160 | 0.080 | 6.911 | 0.015 * | 0.239 |
* p < 0.05.
Table 3.
ANOVA results of SW/FW ratios for the two SA groups.
| SW/FW Ratios | Region × Laterality × SA Group | Region × SA Group | Laterality × SA Group | SA Group | ||||||||
|---|---|---|---|---|---|---|---|---|---|---|---|---|
| F | p | η2 | F | p | η2 | F | p | η2 | F | p | η2 | |
| θ/β | 2.228 | 0.105 | 0.092 | 1.185 | 0.303 | 0.051 | 1.572 | 0.221 | 0.067 | 9.610 | 0.005 * | 0.304 |
| α/β | 3.404 | 0.020 * | 0.134 | 5.920 | 0.007 * | 0.212 | 1.057 | 0.343 | 0.046 | 4.040 | 0.057 | 0.155 |
| (θ + α)/β | 3.103 | 0.033 * | 0.124 | 2.778 | 0.092 | 0.112 | 1.770 | 0.184 | 0.074 | 9.072 | 0.006 * | 0.292 |
| (θ + α)/(α + β) | 1.180 | 0.321 | 0.051 | 0.299 | 0.661 | 0.013 | 0.708 | 0.485 | 0.031 | 5.761 | 0.025 * | 0.208 |
* p < 0.05.
Table 4.
Component matrix for SA-sensitive EEG features.
| Component | F1 | F2 | F3 | F1 | F2 | F3 | F1 | F2 | F3 | F1 | F2 | F3 | F1 | F2 | F3 | |
|---|---|---|---|---|---|---|---|---|---|---|---|---|---|---|---|---|
| Electrode Sites | β Relative Power | θ/β | α/β | (θ + α)/β | (θ + α)/(α + β) | |||||||||||
| F3 | 0.788 | −0.065 | 0.492 | 0.762 | 0.419 | 0.441 | ||||||||||
| FZ | 0.841 | 0.171 | 0.449 | 0.863 | −0.074 | 0.446 | 0.687 | 0.558 | 0.338 | |||||||
| F4 | 0.790 | −0.120 | 0.518 | 0.721 | 0.406 | 0.402 | ||||||||||
| C3 | −0.910 | 0.138 | 0.074 | 0.939 | 0.002 | 0.083 | 0.890 | −0.315 | 0.109 | 0.843 | 0.485 | −0.004 | ||||
| CZ | −0.932 | −0.006 | 0.060 | 0.938 | 0.209 | 0.027 | 0.964 | −0.105 | 0.094 | 0.729 | 0.598 | −0.088 | ||||
| C4 | −0.899 | 0.145 | 0.073 | 0.970 | 0.009 | −0.001 | 0.899 | −0.357 | 0.051 | 0.835 | 0.484 | −0.064 | ||||
| P3 | −0.918 | 0.096 | 0.164 | 0.947 | −0.030 | −0.122 | 0.629 | −0.743 | 0.049 | 0.903 | −0.363 | −0.056 | 0.859 | 0.387 | −0.214 | |
| PZ | −0.881 | 0.053 | 0.267 | 0.916 | 0.120 | −0.338 | 0.673 | −0.692 | 0.017 | 0.923 | −0.264 | −0.210 | 0.738 | 0.497 | −0.416 | |
| P4 | −0.916 | 0.116 | 0.244 | 0.883 | 0.008 | −0.303 | 0.683 | −0.690 | 0.046 | 0.890 | −0.305 | −0.180 | 0.767 | 0.351 | −0.414 | |
Table 5.
Component matrix for SA-sensitive EEG features.
| Validation Methods | SA Group | Predicted Accuracy (%) | Average Accuracy (%) | |
|---|---|---|---|---|
| HSA | LSA | |||
| Original validation | HSA | 83.3 | 16.7 | 83.3 |
| LSA | 16.7 | 83.3 | ||
| Cross-validation | HSA | 58.3 | 41.7 | 70.8 |
| LSA | 16.7 | 83.3 | ||
Publisher’s Note: MDPI stays neutral with regard to jurisdictional claims in published maps and institutional affiliations. |
© 2022 by the authors. Licensee MDPI, Basel, Switzerland. This article is an open access article distributed under the terms and conditions of the Creative Commons Attribution (CC BY) license (https://creativecommons.org/licenses/by/4.0/).
Share and Cite
MDPI and ACS Style
Feng, C.; Liu, S.; Wanyan, X.; Chen, H.; Min, Y.; Ma, Y. EEG Feature Analysis Related to Situation Awareness Assessment and Discrimination. Aerospace 2022, 9, 546. https://doi.org/10.3390/aerospace9100546
AMA Style
Feng C, Liu S, Wanyan X, Chen H, Min Y, Ma Y. EEG Feature Analysis Related to Situation Awareness Assessment and Discrimination. Aerospace. 2022; 9(10):546. https://doi.org/10.3390/aerospace9100546
Chicago/Turabian StyleFeng, Chuanyan, Shuang Liu, Xiaoru Wanyan, Hao Chen, Yuchen Min, and Yilan Ma. 2022. "EEG Feature Analysis Related to Situation Awareness Assessment and Discrimination" Aerospace 9, no. 10: 546. https://doi.org/10.3390/aerospace9100546
Note that from the first issue of 2016, this journal uses article numbers instead of page numbers. See further details here.